. 2018 Nov 1:9:2489.
doi: 10.3389/fimmu.2018.02489. eCollection 2018.

Human Dendritic Cell Subsets Undergo Distinct Metabolic Reprogramming for Immune Response

Affiliations

Human Dendritic Cell Subsets Undergo Distinct Metabolic Reprogramming for Immune Response

Farhan Basit et al. Front Immunol. .

Abstract

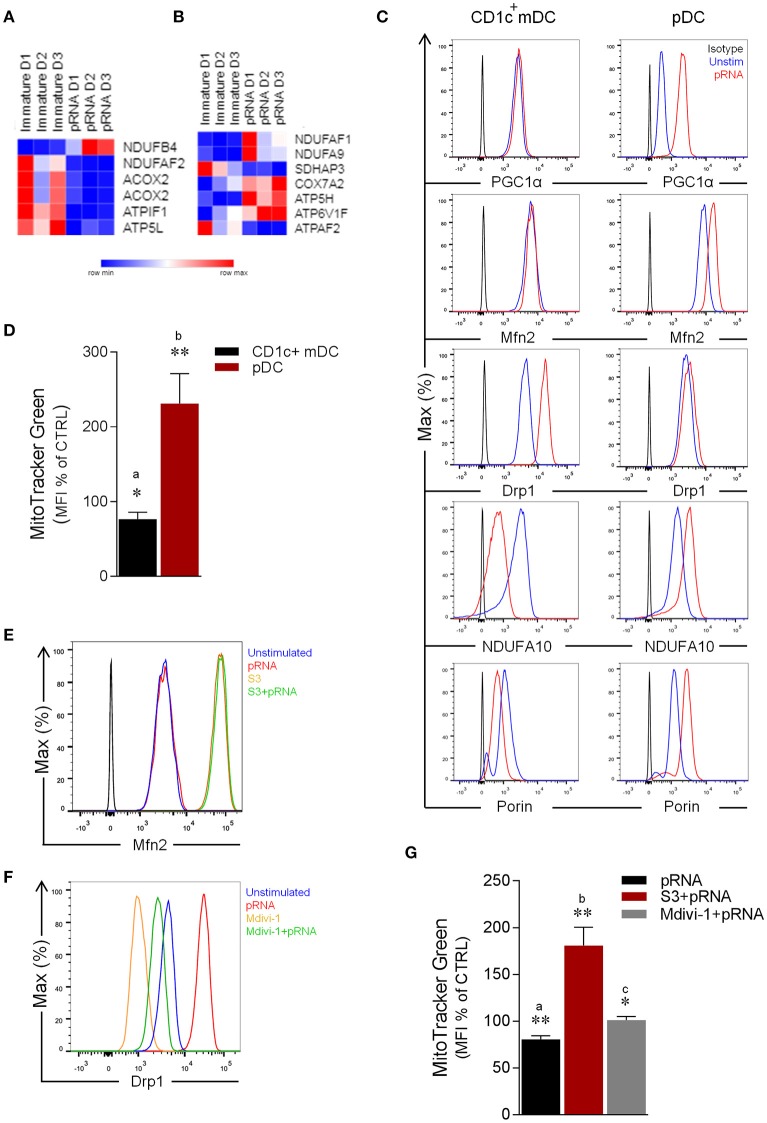
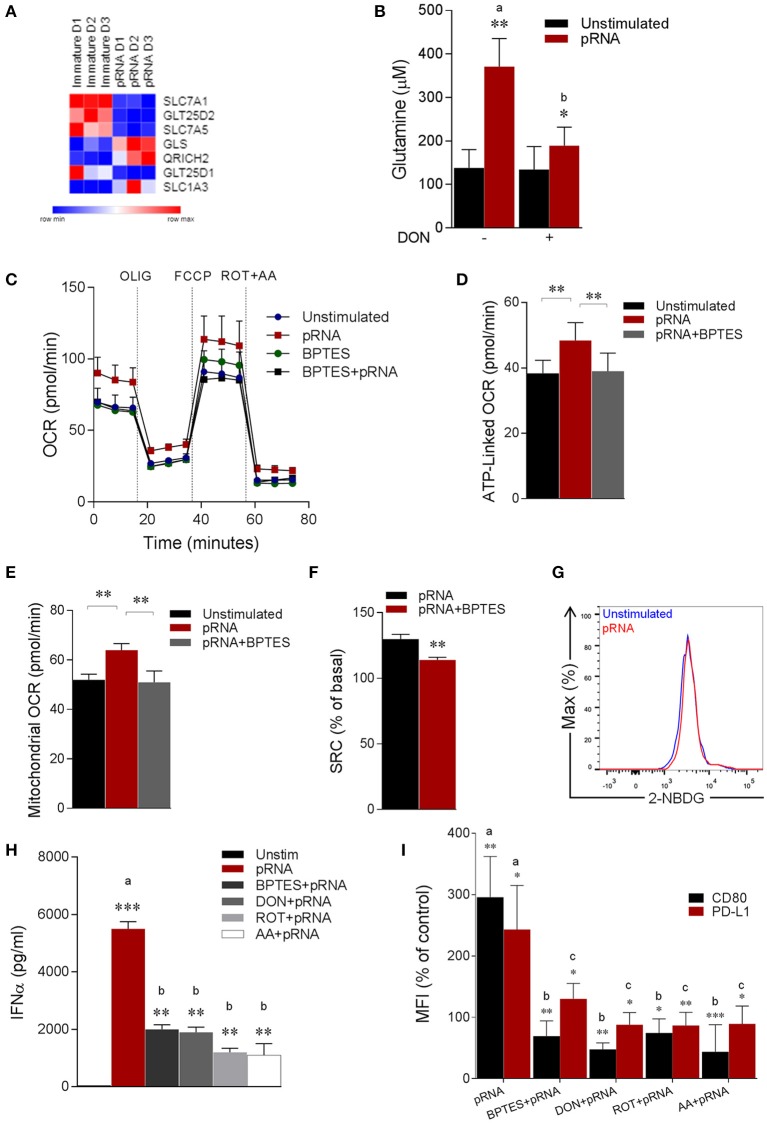
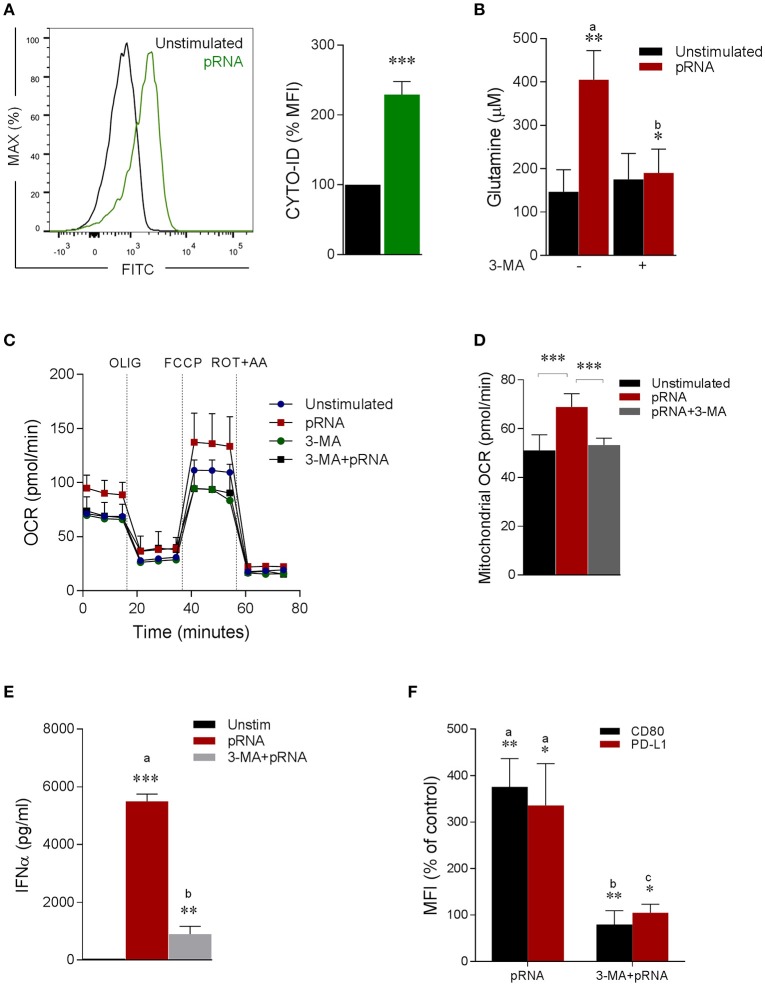
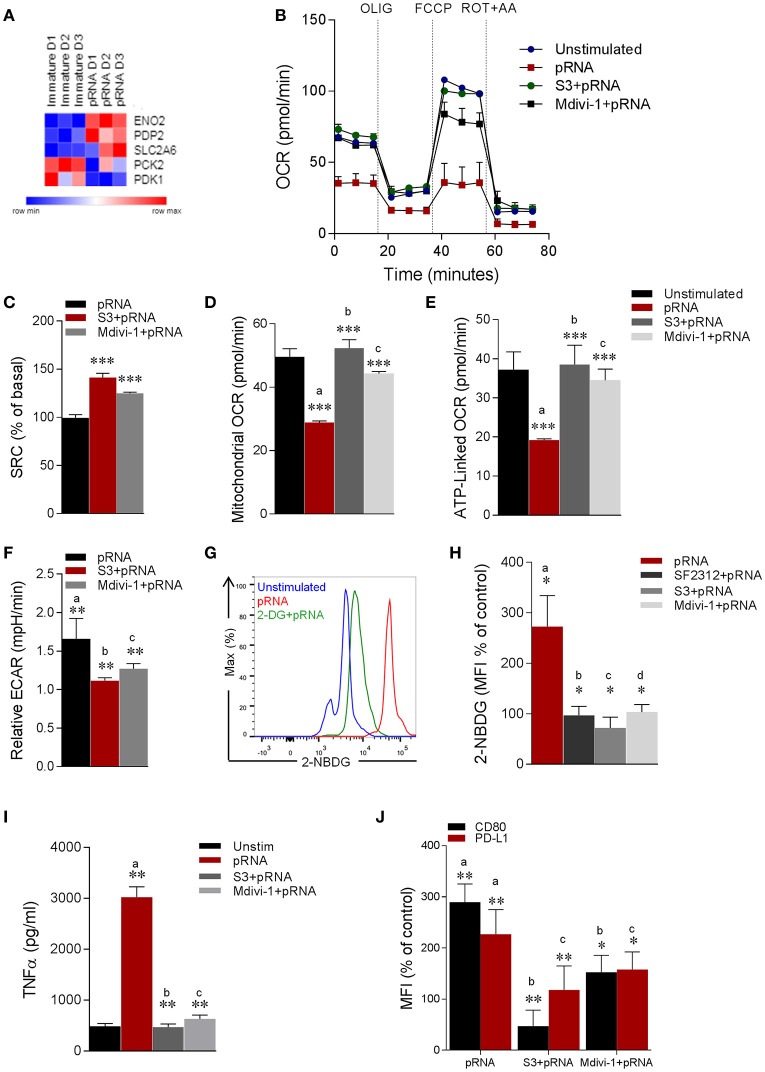
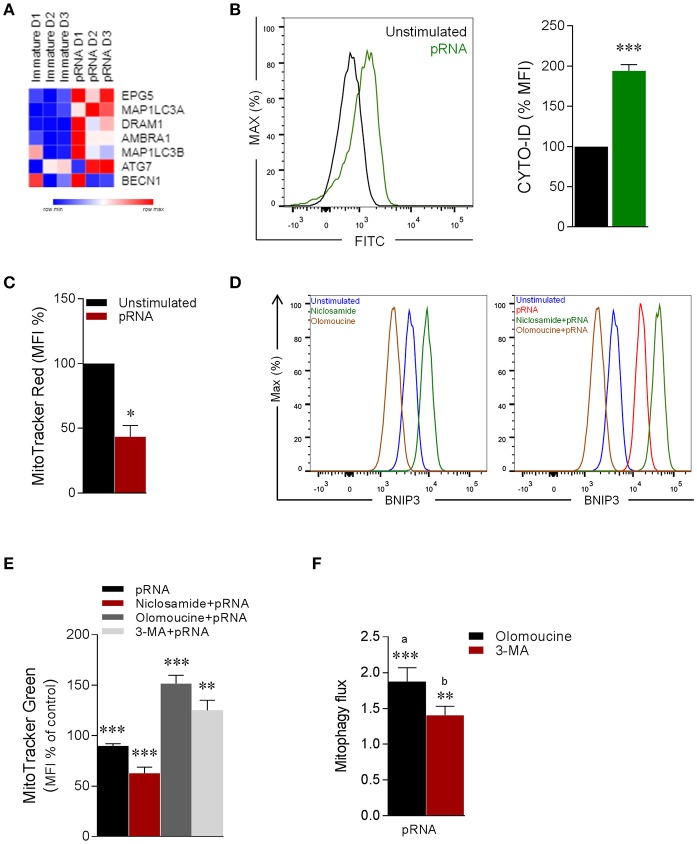
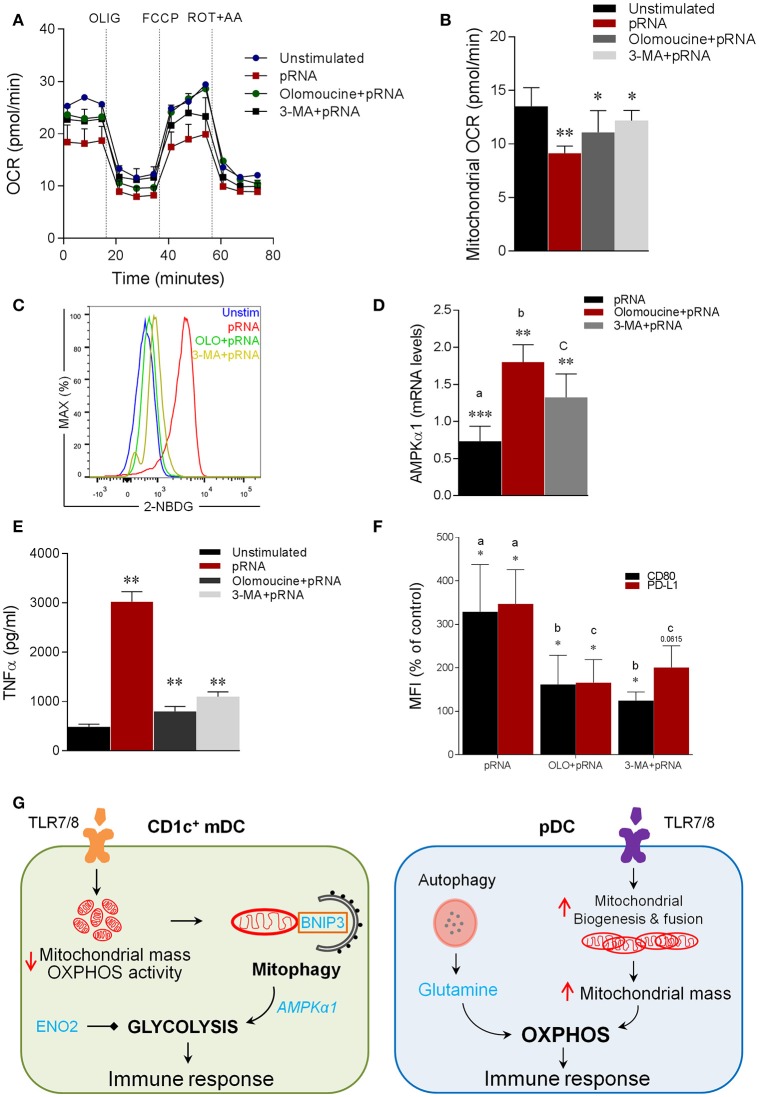
Toll-like receptor (TLR) agonists induce metabolic reprogramming, which is required for immune activation. We have investigated mechanisms that regulate metabolic adaptation upon TLR-stimulation in human blood DC subsets, CD1c+ myeloid DCs (mDCs) and plasmacytoid DCs (pDCs). We show that TLR-stimulation changes expression of genes regulating oxidative phosphorylation (OXPHOS) and glutamine metabolism in pDC. TLR-stimulation increases mitochondrial content and intracellular glutamine in an autophagy-dependent manner in pDC. TLR-induced glutaminolysis fuels OXPHOS in pDCs. Notably, inhibition of glutaminolysis and OXPHOS prevents pDC activation. Conversely, TLR-stimulation reduces mitochondrial content, OXPHOS activity and induces glycolysis in CD1c+ mDC. Inhibition of mitochondrial fragmentation or promotion of mitochondrial fusion impairs TLR-stimulation induced glycolysis and activation of CD1c+ mDCs. TLR-stimulation triggers BNIP3-dependent mitophagy, which regulates transcriptional activity of AMPKα1. BNIP3-dependent mitophagy is required for induction of glycolysis and activation of CD1c+ mDCs. Our findings reveal that TLR stimulation differentially regulates mitochondrial dynamics in distinct human DC subsets, which contributes to their activation.

Keywords: CD1c+ mDC; OXPHOS; glutaminolysis; glycolysis; mitochondrial dynamics; mitophagy; pDC.


Figures

Figure 1
Figure 1
Effect of pRNA on mitochondrial dynamics in CD1c+ mDC and pDC. (A) Heatmap showing expression of significantly changed genes which regulate OXPHOS in CD1c+ mDC upon pRNA-stimulation. Red color indicates increased expression while blue color shows decreased expression. (B) Heatmap showing expression of significantly changed genes which regulate OXPHOS in pDC upon pRNA-stimulation. Red color indicates increased expression while blue color shows decreased expression. (C) Flow cytometry histograms of PGC1α, Mfn2, NDUFA10, Porin and Drp1 in Drp1 in CD1c+ mDC and pDC. Black represents isotype control, blue represents unstimulated control and red represents pRNA stimulated cells for 6 h. (D) Percentage mean fluorescence intensity of cells stained with MitoTracker Green FM and stimulated with pRNA for 6 h. Data represents mean ± SEM of four independent experiments *p < 0.05; **p < 0.01 (Student's t-test). (E) Flow cytometry histograms of Mfn2 in CD1c+ mDC. Blue represents unstimulated control, red represents pRNA stimulated cells for 6 h, brown represents S3 and green represents S3+pRNA. (F) Flow cytometry histograms of Drp1 in CD1c+ mDC. Blue represents unstimulated control, red represents pRNA stimulated cells, brown represents Mdivi-1 and green represents Mdivi-1+pRNA. (G) Percentage mean fluorescence intensity of cells stained with MitoTracker Green FM and stimulated with pRNA for 6 h in the presence or absence of 5 μM S3 or 1 μM Mdivi-1. Data represents mean ± SEM of four independent experiments. *p < 0.05; **p < 0.01 (Student's t-test).
Figure 2
Figure 2
pDC stimulated with pRNA have increased glutaminolysis and OXPHOS which are required for activation. (A) Heatmap showing expression of significantly changed genes which regulate amino acid metabolism in pDCs upon pRNA-stimulation for 6 h. Red color indicates increased expression while blue color shows decreased expression. (B) Glutamine concentration measured by a coupled glutaminase, glutamate dehydrogenase assay with correction for glutamate concentration. Data represents mean ± SEM of experiments from six donors. *p < 0.05; **p < 0.01 (Student's t-test). (C) Mitochondrial fitness test of pDCs stimulated with pRNA for 6 h in the presence or absence of 5 μM BPTES. Data represents mean ± SEM of three independent experiments. (D–F) Data was collected within same experiments as C, but is shown separately for better understanding. Data represents mean ± SEM of three independent experiments. *p < 0.05; **p < 0.01 (Student's t-test). (G) Flow cytometry histograms of 2-NBDG stained pDCs. Blue represents unstimulated control and red represents pRNA-stimulated cells pDC for 6 h. (H) IFN-α levels on protein level were measured in the supernatant of the pDCs stimulated for 6 h. Data represents mean ± SEM of three independent experiments **p < 0.01; ***p < 0.001 (Student's t-test). (I) Percentage mean flouresence intensity of maturation markers (CD80 and PD-L1) in pDCs stimulated for 6 h. Data represents mean ± SEM of three independent experiments. *p < 0.05; **p < 0.01; ***p < 0.001 (Student's t-test).
Figure 3
Figure 3
Autophagy provides glutamine for pDC activation. (A) Fluorescence intensity of autophagosomal marker CYTO-ID in pDC stimulated with pRNA for 6 h ***p < 0.001 (Student's t-test). (B) Glutamine concentration measured by a coupled glutaminase, glutamate dehydrogenase assay with correction for glutamate concentration. Data represents mean ± SEM of experiments from six donors. *p < 0.05; **p < 0.01 (Student's t-test). (C) Mitochondrial fitness test of pDCs stimulated with pRNA for 6 h in the presence or absence of 25 μM 3-MA. Data represents mean ± SEM of three independent experiments. (D) Data was collected within same experiments as (C) but is shown separately for better understanding. Data represents mean ± SEM of three independent experiments. **p < 0.01; ***p < 0.001 (Student's t-test). (E) IFN-α levels on protein level were measured in the supernatant of the pDCs stimulated for 6 h. Data represents mean ± SEM of three independent experiments. **p < 0.01; ***p < 0.001 (Student's t-test). (F) Percentage mean flouresence intensity of maturation markers (CD80 and PD-L1) in pDCs stimulated for 6 h. Data represents mean ± SEM of three independent experiments. *p < 0.05; **p < 0.01 (Student's t-test).
Figure 4
Figure 4
pRNA-stimulation alters mitochondrial morphology in CD1c+ mDC to induce glycolysis. (A) Heatmap showing expression of significantly changed genes which regulate glycolysis in CD1c+ mDC upon pRNA-stimulation for 6 h. Red color indicates increased expression while blue color shows decreased expression. (B) Mitochondrial fitness test of CD1c+ mDC stimulated with pRNA for 6 h in the presence or absence of 5 μM S3 or 1 μM Mdivi-1. Data represents mean ± SEM of three independent experiments. (C–F) Data was collected within same experiments as (B), but is shown separately for better understanding. Data represents mean ± SEM of three independent experiments. *p < 0.05; **p < 0.01; ***p < 0.001 (Student's t-test). (G) Flow cytometry histograms of 2-NBDG stained CD1c+ mDC cells. (H) Percentage mean fluorescence intensity of cells stained with 2-NBDG. Data represents mean ± SEM of four independent experiments *p < 0.05 (Student's t-test). (I) TNF-α levels on protein level were measured in the supernatant of the stimulated CD1c+ mDC cells stimulated for 6 h in the presence or absence of 5 μM S3 or 1 μM Mdivi-1. Data represents mean ± SEM of three independent experiments. **p < 0.01 (Student's t-test). (J) Percentage mean fluorescence intensity of maturation markers (CD80 and PD-L1) in CD1c+ mDC cells stimulated for 6 h in the presence or absence of 5 μM S3 or 1 μM Mdivi-1. Data represents mean ± SEM of three independent experiments. *p < 0.05; **p < 0.01 (Student's t-test).
Figure 5
Figure 5
pRNA-stimulation triggers BNIP3-dependent mitophagy in CD1c+ mDC. (A) Heatmap showing expression of significantly changed genes which regulate autophagy in CD1c+ mDC upon pRNA-stimulation for 6 h. Red color indicates increased expression while blue color shows decreased expression. (B) Fluorescence intensity of autophagosomal marker CYTO-ID in pDC stimulated with pRNA for 6 h ***p < 0.001 (Student's t-test). (C) Percentage mean flouresence intensity of CD1c+ mDC cells stained with MitoTracker Red stimulated with pRNA for 6 h. Data represents mean ± SEM of three independent experiments. *p < 0.05 (Student's t-test). (D) Flow cytometry histograms of BNIP3 in CD1c+ mDC cells in the presence or absence of 2 μM niclosamide or 10 μM olomoucine for 6 h. (E) Percentage mean fluorescence intensity of CD1c+ mDC cells stained with MitoTracker Green stimulated with pRNA for 6 h in the presence or absence of 2 μM niclosamide or 10 μM olomoucine or 25 μM 3-MA. Data represents mean ± SEM of three independent experiments **p < 0.01; ***p < 0.001 (Student's t-test). (F) Mitophagy flux in CD1c+ mDC stimulated with pRNA for 6 h. Data represents mean ± SEM of three independent experiments **p < 0.01; ***p < 0.001 (Student's t-test).
Figure 6
Figure 6
Mitophagy is indispensable for induction of glycolysis and activation of CD1c+ mDC (A) Mitochondrial fitness test of CD1c+ mDC stimulated with pRNA for 6 h in the presence or absence of 10 μM olomoucine or 25 μM 3-MA. Data represents mean ± SEM of three independent experiments. (B) Data was collected within same experiments as (A) but is shown separately for better understanding. Data represents mean ± SEM of three independent experiments. *p < 0.05; **p < 0.01 (Student's t-test). (C) Flow cytometry histograms of 2-NBDG stained CD1c+ mDCs stimulated with pRNA pDC for 6 h. (D) AMPKα1 mRNA levels were analyzed after 6 h of pRNA stimulation by (qPCR) and normalized to β-actin expression by using the 2ΔΔCT method. Data represents Mean±SEM of three independent experiments **p < 0.01; ***p < 0.001 (Student's t-test). (E) TNF-α levels on protein level were measured in the supernatant of the CD1c+ mDC stimulated for 6 h. Data represents mean ± SEM of three independent experiments **p < 0.01 (Student's t-test). (F) Percentage mean flouresence intensity of maturation markers (CD80 and PD-L1) in CD1c+ mDC cells stimulated for 6 h in the presence or absence of 10 μM olomoucine or 25 μM 3-MA. Data represents mean ± SEM of three independent experiments *p < 0.05 (Student's t-test). (G) Proposed model of human DC-subsets activation via TLR7/8 agonist (CD1c+ mDC) TLR-stimulation reduces mitochondrial content, OXPHOS activity and induces glycolysis in CD1c+ mDC. TLR-stimulation in CD1c+ mDCs results in depolarized mitochondrial membrane potential (Δψ) and triggers BNIP3-dependent mitophagy which is required for induction of glycolysis and activation of CD1c+ mDC (pDC) TLR-stimulation increases OXPHOS and mitochondrial content as result of increased protein levels of Mfn2 and PGC1α in pDC. Moreover, TLR-stimulation in pDC increases intracellular glutamine in an autophagy-dependent manner. TLR-induced glutaminolysis fuels increases OXPHOS in pDCs which are indispensable for pDC activation.

Similar articles

Cited by

References

    1. Schreibelt G, Bol KF, Westdorp H, Wimmers F, Aarntzen EH, Duiveman-de Boer T, et al. . Effective clinical responses in metastatic melanoma patients after vaccination with primary myeloid dendritic cells. Clin Cancer Res. (2016) 22:2155–66. 10.1158/1078-0432.CCR-15-2205 - DOI - PubMed
    1. Tel J, Lambeck AJ, Cruz LJ, Tacken PJ, de Vries IJ, Figdor CG. Human plasmacytoid dendritic cells phagocytose, process, and present exogenous particulate antigen. J Immunol. (2010) 184:4276–83. 10.4049/jimmunol.0903286 - DOI - PubMed
    1. Liu YJ. Dendritic cell subsets and lineages, and their functions in innate and adaptive immunity. Cell (2001) 106:259–62. 10.1016/S0092-8674(01)00456-1 - DOI - PubMed
    1. Merad M, Sathe P, Helft J, Miller J, Mortha A. The dendritic cell lineage: ontogeny and function of dendritic cells and their subsets in the steady state and the inflamed setting. Annu Rev Immunol. (2013) 31:563–604. 10.1146/annurev-immunol-020711-074950 - DOI - PMC - PubMed
    1. Hemont C, Neel A, Heslan M, Braudeau C, Josien R. Human blood mDC subsets exhibit distinct TLR repertoire and responsiveness. J Leukoc Biol. (2013) 93:599–609. 10.1189/jlb.0912452 - DOI - PubMed

Publication types

MeSH terms