

Drought and Phytophthora Are Associated With the Decline of Oak Species in Southern Italy
- PMID: 30455713
- PMCID: PMC6230577
- DOI: 10.3389/fpls.2018.01595
Drought and Phytophthora Are Associated With the Decline of Oak Species in Southern Italy
Abstract
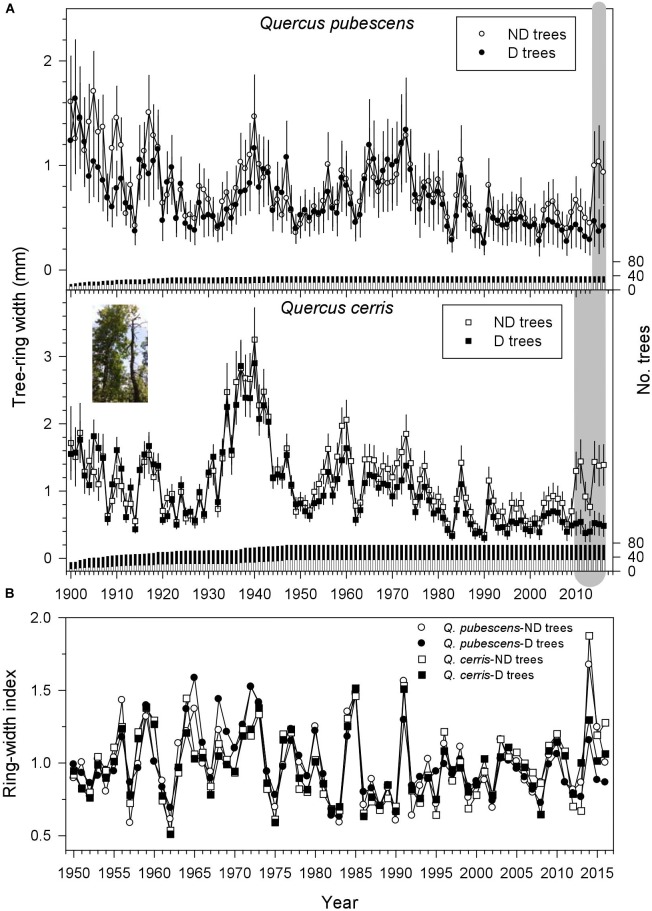
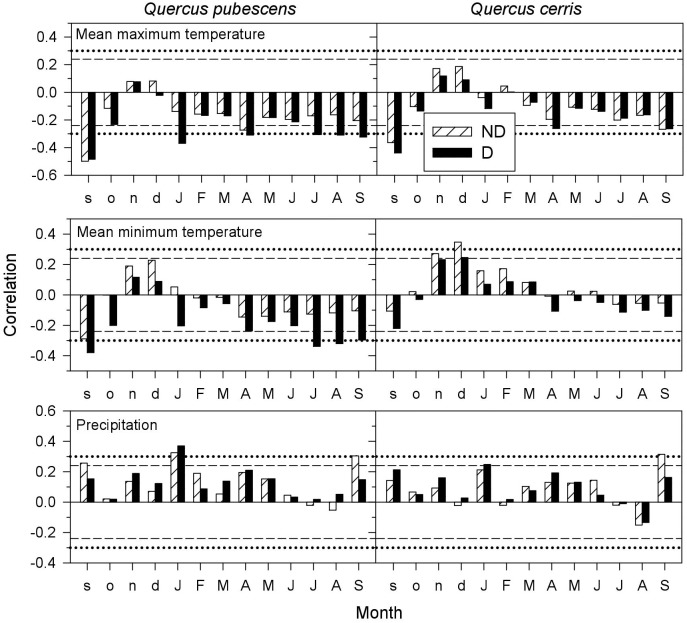
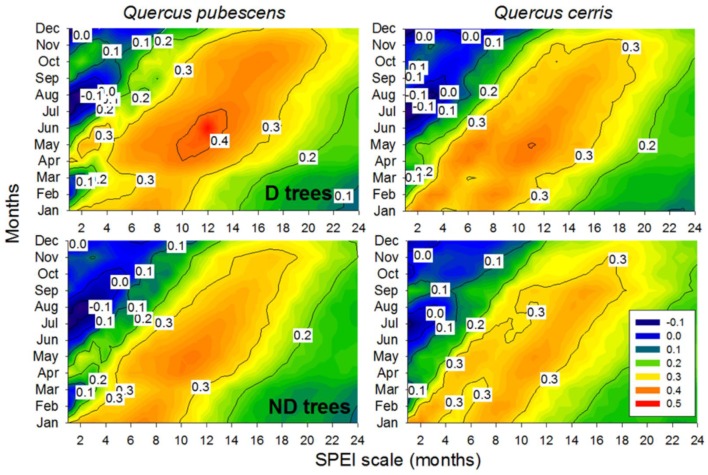
Forest decline induced by climate change is a global phenomenon that affects many tree species, mainly in drought-prone areas as the Mediterranean region. In southern Italy, several oak species have shown decline symptoms and elevated mortality since the 2000s due to drought stress. However, it remains to be answered whether decline occurred alone or whether a pathogen was also involved. To this aim, we compared two coexisting oak species in a forest located in southern Italy which are assumed to be less (Quercus cerris) and more tolerant to drought (Quercus pubescens). We sampled fifteen couples of neighboring declining (D) and non-declining (ND) trees of both species. Wood cores were taken from all trees to perform dendrochronological analyses to detect the decline onset and link it to potential climatic drivers. Carbon isotope ratios (d13C) were analyzed in wood of the two vigor classes to compare their water-use efficiency. Phytophthora presence was also assessed in soil samples from ten D-ND couples of trees per species. The oak species most affected by drought-induced decline in terms of leaf shedding and mortality was Q. cerris, i.e., the least tolerant to drought. In both species, the D trees showed a reduced growth rate compared with ND trees from 2000 onward when drought and warming intensified. Q. pubescens showed higher growth sensitivity to precipitation, temperature and drought than Q. cerris. This sensitivity to climate was magnified in D trees whose growth decreased in response to warm and dry conditions during the prior winter and the late summer. The Q. pubescens D trees were more efficient in their water use than ND trees before the growth divergence between D and ND trees amplified. In the studied area, Phytophthora quercina was isolated from 40% of the sampled trees, and tended to be more frequent amongst ND than amongst D trees. Our data suggests that droughts and warm summer conditions triggered oak decline. The high prevalence of P. quercina in the studied area warrants further study as a potential predisposing factor.
Keywords: Phytophthora species; Quercus cerris; Quercus pubescens; carbon isotopes; dendroecology; drought stress; forest dieback; water-use efficiency.
Figures

References
-
- Alla A. Q., Camarero J. J. (2012). Contrasting responses of radial growth and wood anatomy to climate in a Mediterranean ring-porous oak: implications for its future persistence or why the variance matters more than the mean. Eur. J. For. Res. 131 1537–1550. 10.1007/s10342-012-0621-x - DOI
-
- Amorini E., Biocca M., Manetti M. C., Motta E. (1996). A dendroecological study in a declining oak coppice stand. Ann. Sci. For. 53 731–742. 10.1051/forest:19960249 - DOI
-
- Andersson M., Milberg P., Bergman K.-O. (2011). Low pre-death growth rates of oak (Quercus robur L.)–Is oak death a long-term process induced by dry years? Ann. For. Sci. 68 159–168. 10.1007/s13595-011-0017-y - DOI
-
- Balci Y., Halmschlager E. (2003). Incidence of Phytophthora species in oak forests in Austria and their possible involvement in oak decline. For. Pathol. 33 157–174. 10.1046/j.1439-0329.2003.00318.x - DOI
LinkOut - more resources
Full Text Sources