

Protein Supplementation Throughout 10 Weeks of Progressive Run Training Is Not Beneficial for Time Trial Improvement
- PMID: 30456213
- PMCID: PMC6230989
- DOI: 10.3389/fnut.2018.00097
Protein Supplementation Throughout 10 Weeks of Progressive Run Training Is Not Beneficial for Time Trial Improvement
Abstract
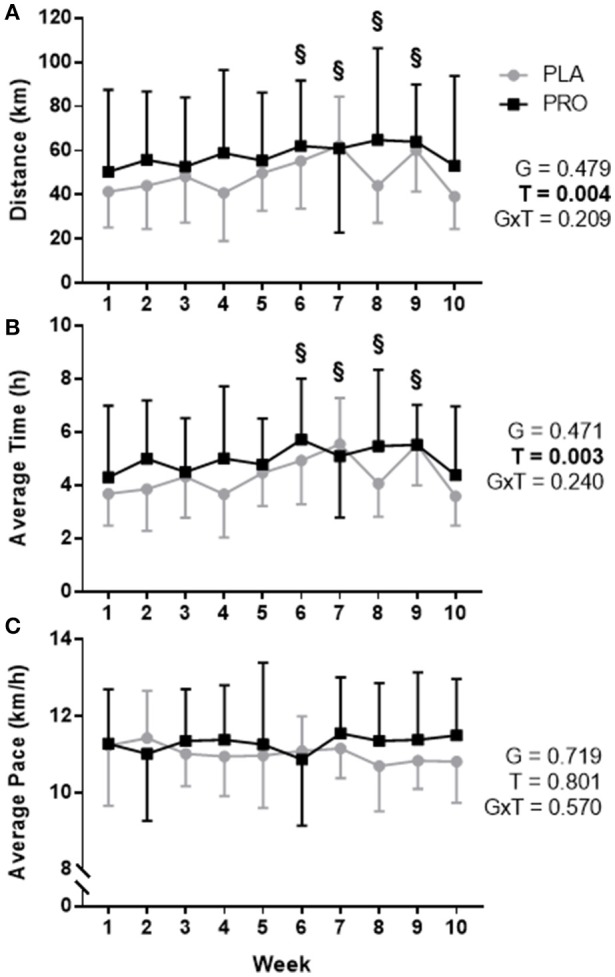
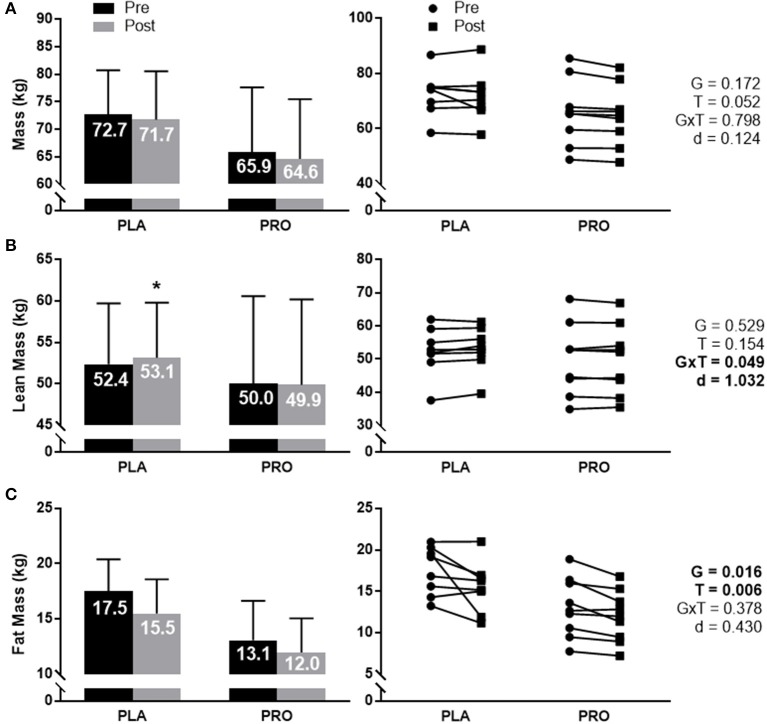
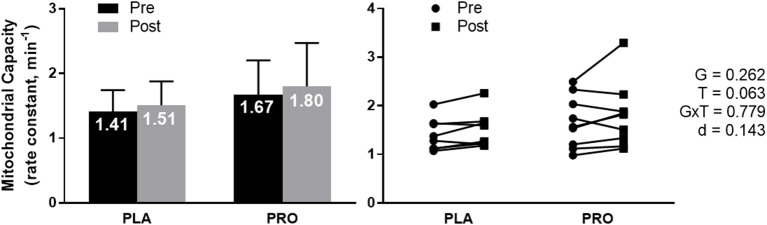
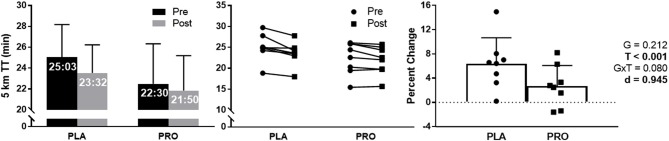
Introduction: Protein supplementation is proposed to promote recovery and adaptation following endurance exercise. While prior literature demonstrates improved performance when supplementing protein during or following endurance exercise, chronic supplementation research is limited. Methods: Runners (VO2peak = 53.6 ± 8.9 ml/kg/min) were counter-balanced into a placebo group (PLA; n = 8) or protein group (PRO; n = 9) based on sex and VO2peak, and underwent 10 weeks of progressive endurance training. Prior to training, body composition, blood cell differentials, non-invasive mitochondrial capacity using near-infrared spectroscopy, and a 5 km treadmill time trial (TT) were evaluated. Progressive training then commenced (5-10% increase in weekly volume with a recovery week following 3 weeks of training) whereby PRO supplemented with 25 g of whey protein following workouts and prior to sleep (additional 50 g daily). PLA supplemented similarly with a < 1 g sugar pill per day. Following training, participants were reanalyzed for the aforementioned tests. Results: VO2peak and initial 5 km TT were not significantly different between groups. PRO consumed significantly more dietary protein throughout the training period (PRO = 132 g/d or 2.1 g/kg/day; PLA = 84 g/d or 1.2 g/kg/day). Running volume increased significantly over time, but was not significantly different between groups throughout training. Blood measures were unaltered with training or supplementation. Mitochondrial capacity trended toward improving over time (time p = 0.063) with no difference between groups. PLA increased lean mass 0.7 kg (p < 0.05) while PRO experienced infinitesimal change (-0.1 kg, interaction p = 0.049). PLA improved 5 km TT performance 6.4% (1 min 31 s), while PRO improved only 2.7% (40 s) (interaction p = 0.080). Conclusion: This is the first evidence to suggest long-term protein supplementation during progressive run training is not beneficial for runners.
Keywords: 5 km time trial; NIRS; endurance; lean body mass; mitochondrial capacity; run training; running; whey protein.
Figures
Similar articles
-
Whey Protein Isolate Supplementation While Endurance Training Does Not Alter Cycling Performance or Immune Responses at Rest or After Exercise.Front Nutr. 2019 Mar 1;6:19. doi: 10.3389/fnut.2019.00019. eCollection 2019. Front Nutr. 2019. PMID: 30881958 Free PMC article.
-
Protein Supplementation Does Not Augment Adaptations to Endurance Exercise Training.Med Sci Sports Exerc. 2019 Oct;51(10):2041-2049. doi: 10.1249/MSS.0000000000002028. Med Sci Sports Exerc. 2019. PMID: 31525168 Free PMC article. Clinical Trial.
-
Effect of whey protein hydrolysate on performance and recovery of top-class orienteering runners.Int J Sport Nutr Exerc Metab. 2015 Apr;25(2):97-109. doi: 10.1123/ijsnem.2014-0083. Epub 2014 Jul 14. Int J Sport Nutr Exerc Metab. 2015. PMID: 25029703 Clinical Trial.
-
L-arginine does not improve biochemical and hormonal response in trained runners after 4 weeks of supplementation.Nutr Res. 2014 Jan;34(1):31-9. doi: 10.1016/j.nutres.2013.10.006. Epub 2013 Oct 18. Nutr Res. 2014. PMID: 24418244 Clinical Trial.
-
Effects of Whey, Soy or Leucine Supplementation with 12 Weeks of Resistance Training on Strength, Body Composition, and Skeletal Muscle and Adipose Tissue Histological Attributes in College-Aged Males.Nutrients. 2017 Sep 4;9(9):972. doi: 10.3390/nu9090972. Nutrients. 2017. PMID: 28869573 Free PMC article. Clinical Trial.
Cited by
-
The Effects of Dietary Protein Supplementation on Acute Changes in Muscle Protein Synthesis and Longer-Term Changes in Muscle Mass, Strength, and Aerobic Capacity in Response to Concurrent Resistance and Endurance Exercise in Healthy Adults: A Systematic Review.Sports Med. 2022 Jun;52(6):1295-1328. doi: 10.1007/s40279-021-01620-9. Epub 2022 Feb 3. Sports Med. 2022. PMID: 35113389
-
Effects of 12-Week Multivitamin and Omega-3 Supplementation on Micronutrient Levels and Red Blood Cell Fatty Acids in Pre-menopausal Women.Front Nutr. 2021 Jul 13;8:610382. doi: 10.3389/fnut.2021.610382. eCollection 2021. Front Nutr. 2021. PMID: 34327207 Free PMC article.
-
Protein Supplementation in Sport: Source, Timing, and Intended Benefits.Curr Nutr Rep. 2019 Dec;8(4):382-396. doi: 10.1007/s13668-019-00293-1. Curr Nutr Rep. 2019. PMID: 31713177 Review.
-
A time course for markers of protein synthesis and degradation with hindlimb unloading and the accompanying anabolic resistance to refeeding.J Appl Physiol (1985). 2020 Jul 1;129(1):36-46. doi: 10.1152/japplphysiol.00155.2020. Epub 2020 May 14. J Appl Physiol (1985). 2020. PMID: 32407240 Free PMC article.
-
Effects of 16 weeks of two different high-protein diets with either resistance or concurrent training on body composition, muscular strength and performance, and markers of liver and kidney function in resistance-trained males.J Int Soc Sports Nutr. 2023 Dec;20(1):2236053. doi: 10.1080/15502783.2023.2236053. J Int Soc Sports Nutr. 2023. PMID: 37516903 Free PMC article.
References
LinkOut - more resources
Full Text Sources