. 2018 Nov 9:4:36.
doi: 10.1038/s41523-018-0091-5. eCollection 2018.

mTORC1 is a key mediator of RON-dependent breast cancer metastasis with therapeutic potential

Affiliations

mTORC1 is a key mediator of RON-dependent breast cancer metastasis with therapeutic potential

Najme Faham et al. NPJ Breast Cancer. .

Abstract

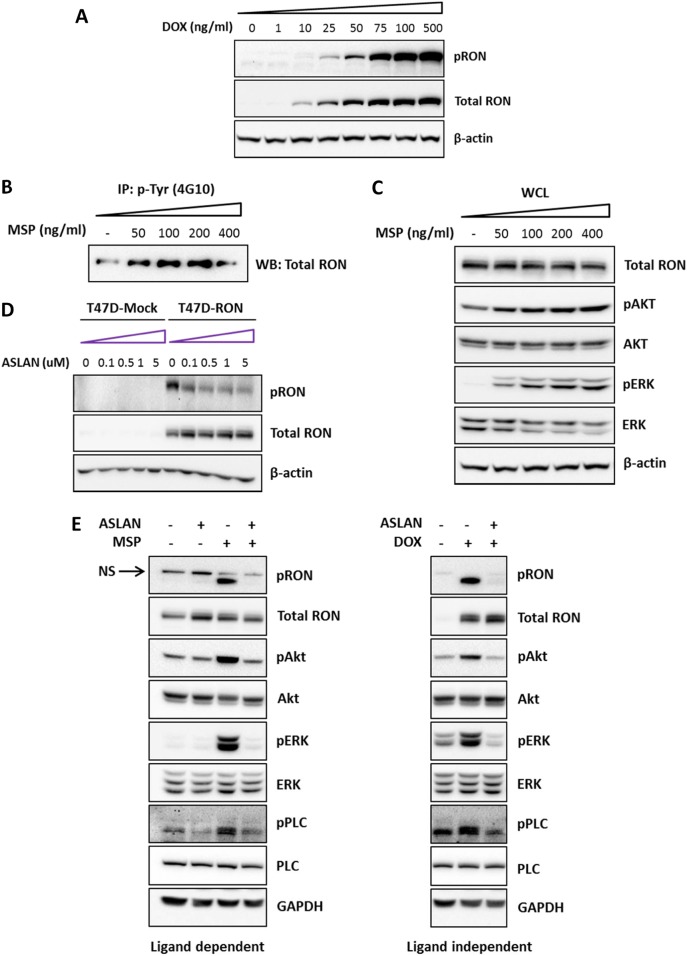
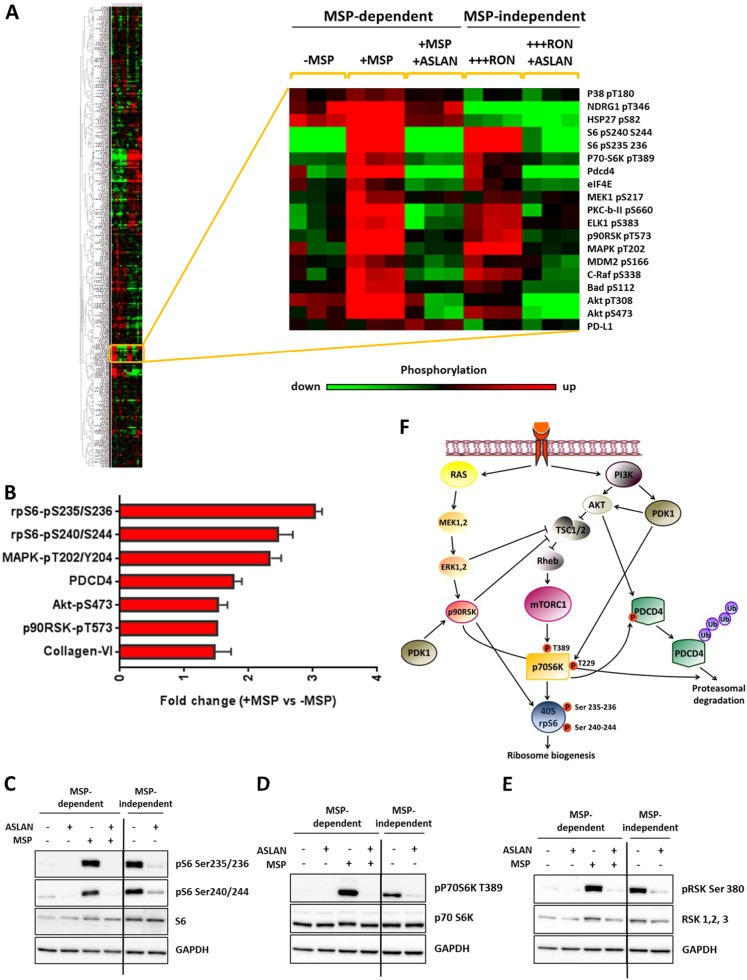
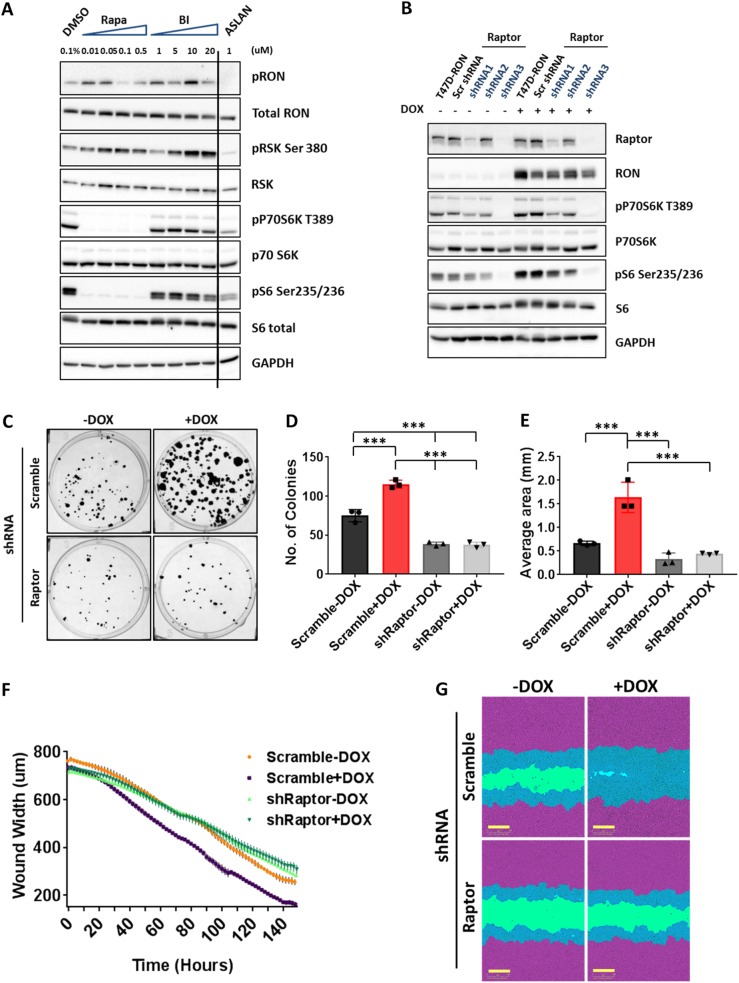
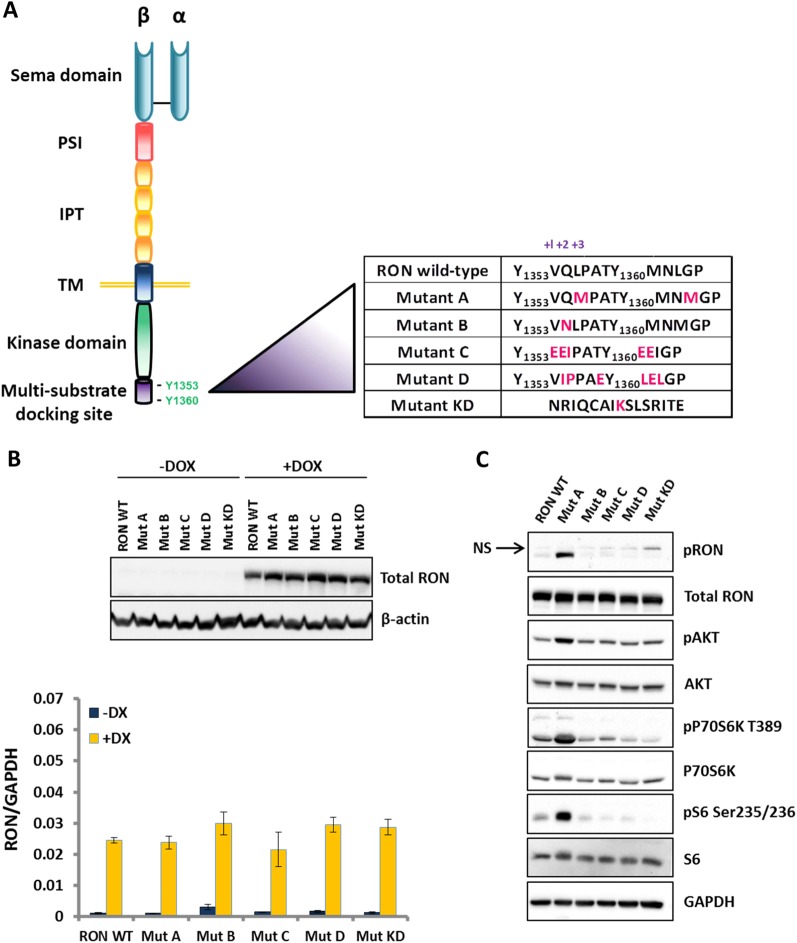
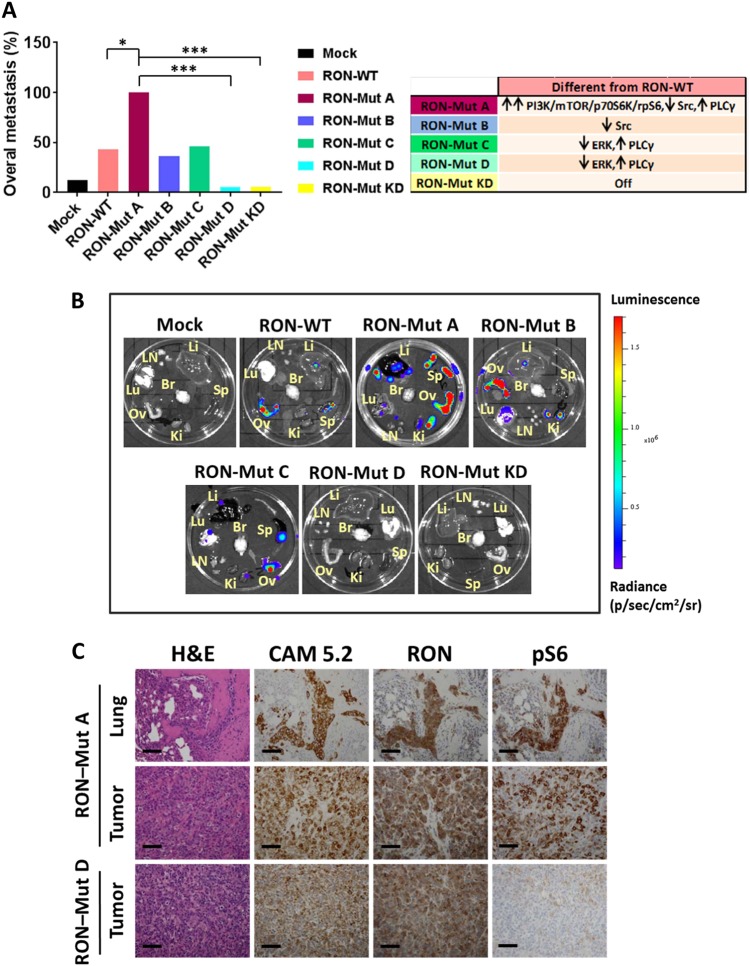
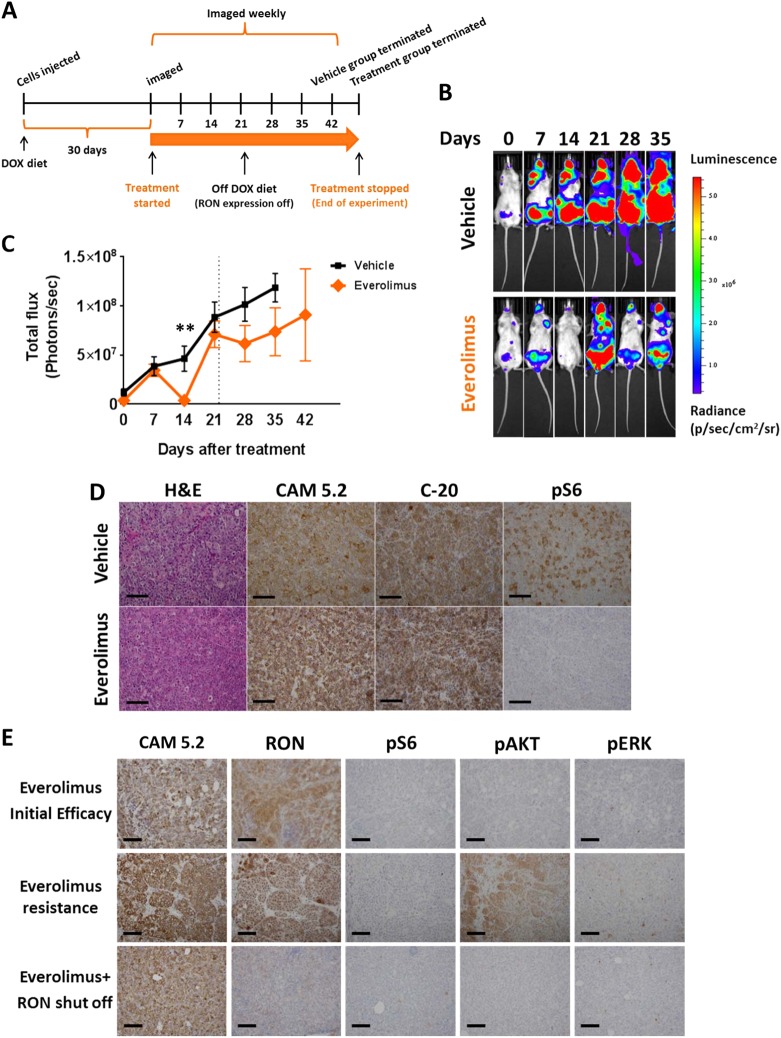
Metastasis is the biggest challenge in treating breast cancer, and it kills >40,000 breast cancer patients annually in the US. Aberrant expression of the RON receptor tyrosine kinase in breast tumors correlates with poor prognosis and has been shown to promote metastasis. However, the molecular mechanisms that govern how RON promotes metastasis, and how to block it, are still largely unknown. We sought to determine critical effectors of RON using a combination of mutational and pharmacologic strategies. High-throughput proteomic analysis of breast cancer cells upon activation of RON showed robust phosphorylation of ribosomal protein S6. Further analysis revealed that RON strongly signals through mTORC1/p70S6K, which is mediated predominantly by the PI3K pathway. A targeted mutation approach to modulate RON signaling validated the importance of PI3K/mTORC1 pathway for spontaneous metastasis in vivo. Finally, inhibition of mTORC1 with an FDA-approved drug, everolimus, resulted in transient shrinkage of established RON-dependent metastases, and combined blockade of mTORC1 and RON delayed progression. These studies have identified a key downstream mediator of RON-dependent metastasis in breast cancer cells and revealed that inhibition of mTORC1, or combined inhibition of mTORC1 and RON, may be effective for treatment of metastatic breast cancers with elevated expression of RON.


Conflict of interest statement

The authors declare no competing interests.

Figures

Fig. 1
Fig. 1
Tet-inducible expression of RON in T47D cells allows dissection of ligand-dependent and ligand-independent signaling. a Titration of RON expression by doxycycline in T47D cells. T47D-RON cells were treated with increasing concentrations of doxycycline for 48 h. Robust ligand-independent activation of RON is detected at higher concentrations of doxycycline, as reflected by increased pRON. b Dose-response stimulation of RON with MSP. T47D-RON cells were treated with doxycycline (100 ng/ml) for 48 h, and cultured in serum-starved media for 24 h. Cells were then stimulated with increasing concentrations of MSP for 15 min. Lysates were immune-precipitated with anti-4G10 phospho-tyrosine antibody, and subjected to Western blot analysis. c Whole cell lysates (WCL) of the same samples were analyzed for pAKT and pERK as readouts for activation of PI3K and MAPK pathways. β-actin was used as loading control. d Western blot shows the efficacy of a small molecule RON inhibitor, ASLAN002, at various concentrations on decreasing ligand-independent RON phosphorylation. Mock-infected T47D cells were used as a negative control. e Effect of ASLAN002 on two types of RON activation: MSP-dependent vs MSP-independent. T47D-RON cells were treated with low-level doxycycline (50 ng/ml) for 48 h. Cells were then serum starved for 24 h and treated with either RON inhibitor (ASLAN002, 1 μM) alone for 4 h, or RON inhibitor followed by MSP stimulation for 30 min. Cell lysates were tested for inhibition of RON and downstream signaling pathways (left panel). For ligand-independent RON activation, T47D-RON cells were treated with high dose of doxycycline (500 ng/ml) for 48 h in normal medium. Cells were then treated with RON inhibitor ASLAN002 (1 μM) for 4 h and analyzed for downstream signaling activity (right panel). GAPDH was used as loading control. Note that the left and right panels are from the same gel, separated for clarity. See also Supplementary Figure S1 and S2. NS non-specific band
Fig. 2
Fig. 2
RPPA analysis of T47D-RON cells shows robust phosphorylation of rpS6 in response to RON activation. a Clustered heatmap of expression of 305 proteins is shown for T47D-RON cells in MSP-dependent and -independent conditions and with or without the RON inhibitor ASLAN002. For MSP-dependent analysis, T47D-RON cells were treated with a low level of doxycycline (50 ng/ml) for 48 h, serum-starved for 24 h, and stimulated with MSP (100 ng/ml) for 30 min. For MSP-independent analysis, T47D-RON cells were treated with a high level of doxycycline (500 ng/ml) for 48 h ± RON inhibitor (ASLAN002) for 4 h. Lysates from three biological replicates for each group were sent for RPPA analysis. A cluster of proteins that are particularly RON sensitive are enlarged on the right. A second group of proteins differentially present in the “MSP-dependent” vs “MSP-independent” conditions was not affected by the presence of MSP or RON inhibitor, was enriched in proliferation and cell-cycle regulation genes, and was likely due to differences in serum levels between the conditions. These proteins are shown in Supplementary Figure 18. b Graph shows candidates whose phosphorylation or expression changed >1.5 fold in response to MSP. ce Validation of RPPA results by Western blot analysis. RON activation, whether through MSP stimulation or RON overexpression, causes strong phosphorylation of rpS6 (both serines), p70S6K, and RSK, which can be reversed by RON inhibition using ASLAN002. GAPDH was used as loading control. Line indicates the separation between lanes on the same Western blots. f Schematic diagram showing differentially phosphorylated proteins upon RON activation in the context of the cellular signaling network
Fig. 3
Fig. 3
Signaling through mTORC1 is required for RON-mediated colony formation and migration in T47D-RON cells. a Representative Western blots for analysis of potential kinases upstream of rpS6 using specific inhibitors of pan-RSK (BI-D1870), mTORC1 (Rapamycin), and RON (ASLAN002). Treatment of T47D-RON cells in ligand-independent conditions with various doses of the inhibitors for 4 h shows almost complete inhibition of phospho-rpS6 by rapamycin, which also showed inhibition of p70S6K activity. See also Supplementary Figure S4A for signaling analysis using specific inhibitors of p70S6K. b Effect of Raptor knockdown on phosphorylation of rpS6 in T47D-RON cells. Cell lysates derived from T47D-RON cells stably expressing three different shRNA against Raptor or control shRNA (scramble), in the absence and presence of 500 ng/ml doxycycline, were subjected to immunoblotting. ce Effect of mTORC1 knockdown on colony formation of T47D-RON cells. T47D-RON cells infected with scramble or Raptor shRNA construct # 3 (see panel b) were seeded at a very low density in the presence and absence of doxycycline and were allowed to form colonies, followed by crystal violet staining. Representative images are shown in panel c, whereas number and average area per colony are shown in panels d and e. Error bars indicate SD, n = 3. *P < 0.05, **P < 0.005, ***P < 0.0005 (one-way ANOVA, multiple comparisons). f, g Wound healing assays were performed to assess the effect of mTORC1 knockdown on the migration of T47D-RON cells. Doxycycline-treated (500 ng/ml) and untreated T47D-RON-shRaptor and T47D-RON-sh-Scramble cells were seeded at high density the day before wounding. The rate of wound closure in each group over the course of treatment is shown in panel f. Representative images at day 6 are shown in panel g. The initial wound in each group is shown in blue/green; migrating cells from the initial wound are shown in blue. Scale bars represent 300 μm. Data are shown as mean ± SEM, n = 7
Fig. 4
Fig. 4
Inducible expression of different RON mutants in T47D cells and analysis of downstream PI3K/mTORC1 signaling. a Schematic presentation of RON kinase structure is shown in the left panel. Mutations that were introduced to RON are shown in the right panel. Mutated residues are highlighted in pink. b Inducible expression of RON mutants in T47D cells at the protein (upper panel) and mRNA level (lower panel). T47D cells transduced with different RON mutants in a Tet-inducible lentiviral plasmid were treated with 500 ng/ml doxycycline for 48 h, and analyzed by Western blot. Equal level of RON expression is apparent among the mutants, which is comparable to RON wild type (WT). Graph shows qRT-PCR analysis of T47D cells expressing RON mutants in the presence and absence of doxycycline (500 ng/ml) for 48 h with primers specific to RON. GAPDH was used as the internal control. c Signaling analysis of the PI3K/mTORC1 pathway in T47D cells expressing RON WT and mutants. T47D-RON WT and mutants were treated with 100 ng/ml doxycycline for 48 h, followed by serum starvation for 24 h. Western blot shows robust activation of AKT, P70S6K, and rpS6, as readouts for activation of PI3K and mTORC1 kinase pathways, in Mutant A compared to the other mutants. GAPDH was used as the internal control. See also Supplementary Figure S8 for signaling analysis of mutants, and Supplementary Figure S9 for the detailed signaling analysis of RON-Mut A in the context of MSP-dependent and -independent RON activation. Line indicates the separation between lanes on the same Western blots. PSI plexin–semaphorin–integrin, IPT immunoglobulin–plexin–transcription, TM transmembrane
Fig. 5
Fig. 5
RON mutants show differential spontaneous metastatic potential in vivo. a Graph shows quantification of overall spontaneous metastasis in NOD/SCID mice following transplantation of T47D cells expressing different RON mutants. *P < 0.05, ***P < 0.0005 (Chi-square analysis, Fisher’s exact test). The table on the right summarizes differential activation of signaling pathways in different RON mutants compared to the RON-WT based on in vitro biochemical characterization. b Representative bioluminescence ex-vivo images of different organs from NOD/SCID mice bearing tumors from RON mutants. T47D-Luc-RON WT and mutants were orthotopically injected (5 × 106 cells) into NOD/SCID mice. Tumors were harvested when they reached approximately 1300 mm3, and different organs were analyzed for metastasis by IVIS imaging. (See Supplementary Table S2 for animal numbers, tumor size and tissue tropism of metastasis in each group.) c Representative IHC staining for metastatic RON-Mut A and non-metastatic RON-Mut D. Staining for H&E, human-specific pan-cytokeratin CAM5.2, RON and pS6 (Ser 235/236) is shown for metastatic lung and primary tumor of RON-Mut A, and primary tumor of RON-Mut D. Scale bars represent 100 μm. See also Supplementary Figures S8 and S9. Li liver, Lu lung, Sp spleen, Ov ovary, Ki kidney, Br brain, LN lymph nodes
Fig. 6
Fig. 6
Effect of mTORC1 inhibition on established metastasis induced by T47D-RON cells. a Experimental scheme for established metastasis induced by T47D-RON cells and treatment with mTORC1 inhibitor, everolimus. T47D-RON cells were tail vein injected to NSG mice and mice were put on Doxy diet (50 ppm) to induce expression of RON. Treatment with everolimus or vehicle started at day 30 following cell injection, when metastatic lesions were detectable with in vivo IVIS imaging. Once mice developed recurrence of metastasis due to everolimus resistance, RON expression was blocked by removing doxy diet, and mice continued to be followed. b Representative IVIS images of mice over the course of treatment with everolimus or vehicle and with or without active RON expression, controlled by doxy diet. Mice were treated with everolimus (5 mg/kg) five times a week (5 days on, 2 days off), and were imaged weekly. c Graph showing quantification of metastasis in the everolimus (n = 11) vs vehicle-treated group (n = 12). Dashed line indicates the time when doxy diet was stopped to block RON expression. Data are shown as mean ± SEM, **P < 0.005 (unpaired t-test). d Representative images showing H&E, CAM5.2, RON, and pS6 (Ser 235/236) staining for metastatic lesions in the ovaries of mice treated with everolimus vs vehicle. e Status of pAKT and pERK as readouts for activation of PI3K and MAPK pathways, respectively, in metastatic lesions of ovaries through different stages of treatment with everolimus. Scale bars represent 100 μm. See also Supplementary Figure S15 and S16

References

    1. Wang MH, Yao HP, Zhou YQ. Oncogenesis of RON receptor tyrosine kinase: a molecular target for malignant epithelial cancers. Acta Pharmacol. Sin. 2006;27:641–650. doi: 10.1111/j.1745-7254.2006.00361.x. - DOI - PubMed
    1. Welm AL, et al. The macrophage-stimulating protein pathway promotes metastasis in a mouse model for breast cancer and predicts poor prognosis in humans. Proc. Natl. Acad. Sci. U.S.A. 2007;104:7570–7575. doi: 10.1073/pnas.0702095104. - DOI - PMC - PubMed
    1. Wang MH, Wang D, Chen YQ. Oncogenic and invasive potentials of human macrophage-stimulating protein receptor, the RON receptor tyrosine kinase. Carcinogenesis. 2003;24:1291–1300. doi: 10.1093/carcin/bgg089. - DOI - PubMed
    1. Yao HP, Zhou YQ, Zhang R, Wang MH. MSP-RON signalling in cancer: pathogenesis and therapeutic potential. Nat. Rev. Cancer. 2013;13:466–481. doi: 10.1038/nrc3545. - DOI - PubMed
    1. Thomas RM, et al. The RON receptor tyrosine kinase mediates oncogenic phenotypes in pancreatic cancer cells and is increasingly expressed during pancreatic cancer progression. Cancer Res. 2007;67:6075–6082. doi: 10.1158/0008-5472.CAN-06-4128. - DOI - PubMed