. 2018 Jun 19;1(3):e201800029.
doi: 10.26508/lsa.201800029. eCollection 2018 Jun.

Chronic platelet-derived growth factor receptor signaling exerts control over initiation of protein translation in glioma

Affiliations

Chronic platelet-derived growth factor receptor signaling exerts control over initiation of protein translation in glioma

Shuang Zhou et al. Life Sci Alliance. .

Abstract

Activation of the platelet-derived growth factor receptors (PDGFRs) gives rise to some of the most important signaling pathways that regulate mammalian cellular growth, survival, proliferation, and differentiation and their misregulation is common in a variety of diseases. Herein, we present a comprehensive and detailed map of PDGFR signaling pathways assembled from literature and integrate this map in a bioinformatics protocol designed to extract meaningful information from large-scale quantitative proteomics mass spectrometry data. We demonstrate the usefulness of this approach using a new genetically engineered mouse model of PDGFRα-driven glioma. We discovered that acute PDGFRα stimulation differs considerably from chronic receptor activation in the regulation of protein translation initiation. Transient stimulation activates several key components of the translation initiation machinery, whereas the clinically relevant chronic activity of PDGFRα is associated with a significant shutdown of translational members. Our work defines a step-by-step approach to extract biologically relevant insights from global unbiased phospho-protein datasets to uncover targets for therapeutic assessment.


Conflict of interest statement

The authors declare that they have no conflict of interest.

Figures

Figure 1.
Figure 1.. Activity flow of PDGFR signaling pathways.
Activity flow diagram of broad PDGFR signaling. Components and reactions that are central to PDGFR signaling were extracted from the more comprehensive maps (Figs 2 and S1) to produce a reduced complexity map highlighting the flow of activation and inhibition of signaling members. The resulting downstream activities of the core components have significant roles in controlling diverse biological responses. Arrows in the diagram represent the flow of reaction with positive (red) and negative feedback (blue) loops represented by bold lines. Direct downstream molecules uniquely regulated by PDGFRα and PDGFRβ receptors are indicated in blue and orange, respectively. Symbols are identical to those used in Figs 2 and S1 legends. The high-resolution PDF is available in the Supplementary Information.
Figure 2.
Figure 2.. A comprehensive molecular interaction map of PDGFRαα signaling network.
Detailed graphical representation of PDGFRαα signaling events. The map was created with CellDesigner version 4.4 (http://www.celldesigner.org). Included are a total number of 615 species and 448 reactions extracted from 390 publications (Supplementary Information). PMIDs are included for individual reactions, which enables a direct link to the relevant literature. The information for all the species, compartments, and reactions can be viewed using the SBML version of the map. The symbols adopted to build the map are illustrated in the legend shown in the left bottom. Red-colored items are unique molecules present in PDGFRαα network only and absent from the PDGFRββ comprehensive map (Fig S1). The SBML and PDF files of the PDGFRαα network are available in the Supplementary Information.
Figure S1.
Figure S1.. PDGFRββ comprehensive map.
Detailed graphical representation of PDGFRββ signaling events. The map was created with CellDesigner version 4.4 (http://www.celldesigner.org). Included are a total number of 614 species and 448 reactions extracted from 390 publications (Supplementary Information). PMIDs for individual reactions are included providing a direct link to the relevant literature. The information for all the species, compartments, and reactions can be viewed using the SBML version of the map. The symbols adopted to build the map are illustrated in the legend shown in Fig 2. Red-colored items are unique molecules present in PDGFRββ network only and absent from the PDGFRαα comprehensive map (Fig 2). The SBML and PDF files of the PDGFRββ network are available in the Supplementary Information.
Figure 3.
Figure 3.. Conditional expression and activation of PDGFRα in the brain of adult mice produces glioblastoma.
(A) Schematic representation of the Cre–Lox conditional PDGFRα transgene knocked-in the 3′ UTR of the Col1α1 locus. The transcriptional activity of the CAG promoter is prohibited by the presence of a floxed stop cassette (LSL). Expression of PDGFRα is achieved by intracranial stereotactic injections of a Cre recombinase–expressing lentivirus. The virus also contains a DOX-inducible PDGF-A ligand. DOX administration induces expression of PDGF-A and chronic receptor kinase activation. (B) Representative photomicrograph of an H&E-stained formalin-fixed paraformaldehyde embedded section of a PDGF-A;PDGFRα;p53−/− brain tumor. Scale bar, 1 mm. (C) Tumor-free survival (Kaplan–Meier) analysis of cohorts of mice of the indicated genotypes fed a DOX diet of 250 mg/kg. *P < 0.0001 log-rank (Mantel–Cox) test. (D) PDGF-A;PDGFRα;p53−/− tumors have histopathological features of glioblastoma. Representative photomicrographs of formalin-fixed paraformaldehyde embedded tumor sections stained with H&E and immunohistochemical detection of PDGFRα, glial fibrillary acidic protein (GFAP), NeuN, and Ki-67. Scale bars: top row—H&E and PDGFRα 62.5 μm; middle row—GFAP 125 μm, and NeuN 250 μm; and bottom row—H&E and Ki67 62.5 μm. T, tumor; N, normal brain; GFAP, glial fibrillary acidic protein.
Figure S2.
Figure S2.. PDGFRα GBM primary cultures demonstrate titratable and temporal DOX-inducible expression of hPDGF-A and receptor activation.
The GBM primary cell culture (P-021) was established as described in the Materials and Methods section. (A) Cells were starved overnight in 0.1% FBS and treated with the indicated concentrations of DOX for 48 h or stimulated with exogenous recombinant PDGF-A (25 ng/ml) for 15 min. The relative amount of ligand present in these primary cultures was measured by qRT-PCR quantitation of hPDGF-A mRNA. Data are average of biological triplicate and error bars represent SD. (B) Cells were stimulated with 10 μg/ml of DOX for the indicated times, and PDGF-A mRNA expression was measured by qRT-PCR. (C) Quantitative Western blot analysis of P-021 cultures incubated with indicated concentrations of DOX for 48 h or 25 ng/ml recombinant PDGF-AA for 15 min in serum-deficient media and cell lysates probed for pTyr849 PDGFRα autophosphorylation site and total PDGFRα and control β-tubulin. Lower panel shows quantitation of Western blot (upper panel). Data are average of biological triplicate and error bars represent SD. (D) Quantitative Westerns blot analysis for temporal activation of PDGFRα activation upon acute or chronic stimulation. P-021 cells were incubated with 10 μg/mlL of DOX for the indicated times or 25 ng/ml recombinant PDGF-AA for 15 min in serum-deficient media, and cell lysates were probed and quantitated as in (C). Data represent the mean ± SD of triplicate experiments. The statistical differences were determined using paired t test. *P < 0.05, **P < 0.01, and ***P < 0.001. Source data are available for this figure.
Figure S3.
Figure S3.. Distribution of phosphosites and PDGFRα activity in primary cultures.
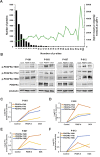
(A) The distribution of the number of phosphorylation sites per protein along with the average size of proteins (amino acid numbers) for the 5,767 phosphosites from the PDGFRα MS dataset. (B–F) Quantitative Westerns blot analysis of PDGFRα autophosphorylation tyrosine residues for four primary cultures of PDGFRα-driven GBMs. Cells were treated with 10 μg/ml doxycycline for 48 h or 25 ng/ml of recombinant PDGF-AA for 15 min in serum-deficient media. Source data are available for this figure.
Figure 4.
Figure 4.. Phospho-proteomic analysis of acutely and chronically stimulated PDGFRα signaling.
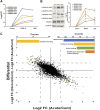
(A) Log2 fold change (FC) of PDGFRα autophosphorylation in MS data. (B) Quantitative Western blot analysis for PDGFRα autophosphorylation. (C) Analysis for differential log2FC on phosphorylation upon acute or chronic stimulation of PDGFRα. On the left and right top are the potential most differentially up- (left) and down- regulated (right) signaling functionalities upon chronic versus acute stimulation of PDGFRα identified by GO term enrichment analysis. Only the categories with P-value < 0.05 are displayed. False discovery rate (FDR) < 0.05. Source data are available for this figure.
Figure S4.
Figure S4.. Most phosphosites in databases are not annotated.
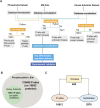
(A) Overview of the strategy used to merge our PDGFRα MS database with PhosphoSitePlus database to extract biologically meaningful information. (B) Overlap between the Phosphorylation_site_dataset with Kinase_Substrate_Dataset. (C) Components of the Kinase_Substrate_Dataset.
Figure S5.
Figure S5.. Integration of the PDGFRα MS dataset into phospho-databases.
(A) The number of phosphorylation sites that overlaps between our PDGFRα MS database and Phosphosite_Plus database is substantial. Most phosphosites in our PDGFRα MS database were observed in the Phosphorylation_Site dataset, except for 558 sites. (B) The Phosphosite_Plus Kinase_Substrate_Dataset comprises 408 kinases phosphorylating 10,812 residues on 2,978 proteins. Merging this dataset to our PDGFRα MS database, we reconciled 150 kinases that phosphorylate 346 residues on 241 proteins. (C) The number of phosphorylation sites per protein for the matched set.
Figure 5.
Figure 5.. Visualization of differential changes between chronic versus acute PDGFRα stimulation.
(A) Cytoscape output of kinase–substrate network visualization of acute and chronic stimulation of PDGFRα. Source data were obtained by extracting kinase–substrate pairs from the PDGFRα MS data based on the Kinase_Substrate_Dataset. Phosphorylation sites were classified according to their molecular functions and assigned color codes that are consistent with those in Fig 2. The color of the edges represents the quantitative log2FC values from the MS data of stimulated to control unstimulated. (B) Close-up view of the most inhibited molecules and corresponding kinases in the category of “RNA binding and translation.” The Cytoscape format file of the network visualization is available in the Supplementary Information.
Figure 6.
Figure 6.. PDGFRα activity reduces phosphorylation of critical members of the translational initiation complex.
(A) Log2FC of the key members of the translational initiation complexes in acute and chronic PDGFRα stimulation. (B) Western blots of the phosphorylation sites shown in (A) from biological replicates (N = 3). (C) Quantification of the Western blotting (B). (D) Western blots for RSK and S6K phosphorylation upon acute or chronic PDGFRα stimulation. (E) Quantification of the Western blotting analyses in (D). (F) Human GBMs expressing high levels of PDGF-A have reduced levels of phosphorylation of several members of the translational machinery when compared with GBMs with low levels of PDGF-A. Data represent the mean ± SD of triplicate experiments. The statistical differences were determined using paired t test. *P < 0.05 and **P < 0.01. Source data are available for this figure.
Figure S6.
Figure S6.. Regulation of key translation initiation proteins in PDGFRα primary cultures.
Western blots for the indicated key phosphorylation sites in proteins integral to translation initiation upon acute or chronic PDGFRα stimulation in GBM cells. Source data are available for this figure.
Figure S7.
Figure S7.. Model of translational regulation by PDGFRα.
In comparison with acute stimulation of PDGFRα receptor, chronic stimulation results in decreased phosphorylation of RSK1/2 and S6K1/2, which subsequently impairs the phosphorylation of S6 ribosome protein and associated ribosome biogenesis and 5′ TOP mRNA translation. On the other hand, the phosphorylation of 4EBP1 and PDCD4 are suppressed, which subsequently limited the components of the eIF4F complex (eIF4E and eIF4A) from joining into the complex. In addition, the phosphorylation of the translation initiation factor eIF4B is also decreased. These changes result in a suppressed CAP-dependent translation initiation in cells with chronic stimulated PDGFRα signaling compared with acute stimulated ones.
Figure 7.
Figure 7.. Chronic PDGFRα activation reduces sensitivity of PDGFRα-positive GBM cells to translational inhibitor–induced suppression on cell viability.
(A–C) Cell viability of PDGFRα GBM primary cell culture with the treatment of 4EGI-1, AZD8055, and LY2584702, respectively, under control or chronic PDGFRα stimulation. (D–F) Cell viability of EGFR GBM primary cell culture with the treatment of 4EGI-1, AZD8055, and LY2584702, respectively, under control or chronic PDGFRα stimulation. Cells were treated with the indicated translational inhibitors for 48 h in serum-deficient media, and the cell viability was assessed using the CellTiter-Fluor Cell Viability Assay. Data represent the mean ± SD of triplicate experiments. The statistical differences were determined using paired t test. *P < 0.05.

References

    1. Acquaviva J, Jun HJ, Lessard J, Ruiz R, Zhu H, Donovan M, Woolfenden S,Boskovitz A, Raval A, Bronson RT, et al. (2011) Chronic activation of wild-type epidermal growth factor receptor and loss of Cdkn2a cause mouse glioblastoma formation. Cancer Res 71: 7198–7206. 10.1158/0008-5472.can-11-1514 - DOI - PMC - PubMed
    1. Beausoleil SA, Villen J, Gerber SA, Rush J, Gygi SP (2006) A probability-based approach for high-throughput protein phosphorylation analysis and site localization. Nat Biotechnol 24: 1285–1292. 10.1038/nbt1240 - DOI - PubMed
    1. Bhat M, Robichaud N, Hulea L, Sonenberg N, Pelletier J, Topisirovic I (2015) Targeting the translation machinery in cancer. Nat Rev Drug Discov 14: 261–278. 10.1038/nrd4505 - DOI - PubMed
    1. Brennan CW, Verhaak RG, McKenna A, Campos B, Noushmehr H, Salama SR, Zheng S, Chakravarty D, Sanborn JZ, Berman SH, et al. (2013) The somatic genomic landscape of glioblastoma. Cell 155: 462–477. 10.1016/j.cell.2013.09.034 - DOI - PMC - PubMed
    1. Calzone L, Gelay A, Zinovyev A, Radvanyi F, Barillot E (2008) A comprehensive modular map of molecular interactions in RB/E2F pathway. Mol Syst Biol 4: 173 10.1038/msb.2008.7 - DOI - PMC - PubMed

LinkOut - more resources