. 2018 Jul 3;1(4):e201800113.
doi: 10.26508/lsa.201800113. eCollection 2018 Aug.

Dynamic m6A methylation facilitates mRNA triaging to stress granules

Affiliations

Dynamic m6A methylation facilitates mRNA triaging to stress granules

Maximilian Anders et al. Life Sci Alliance. .

Abstract

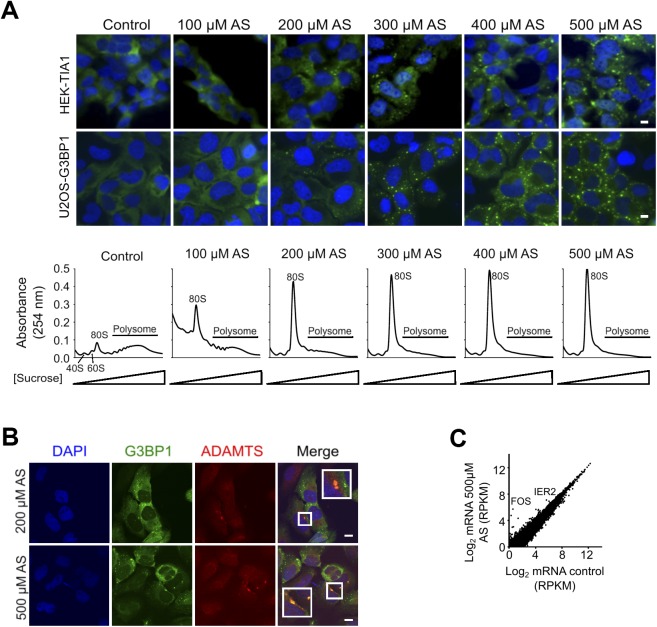
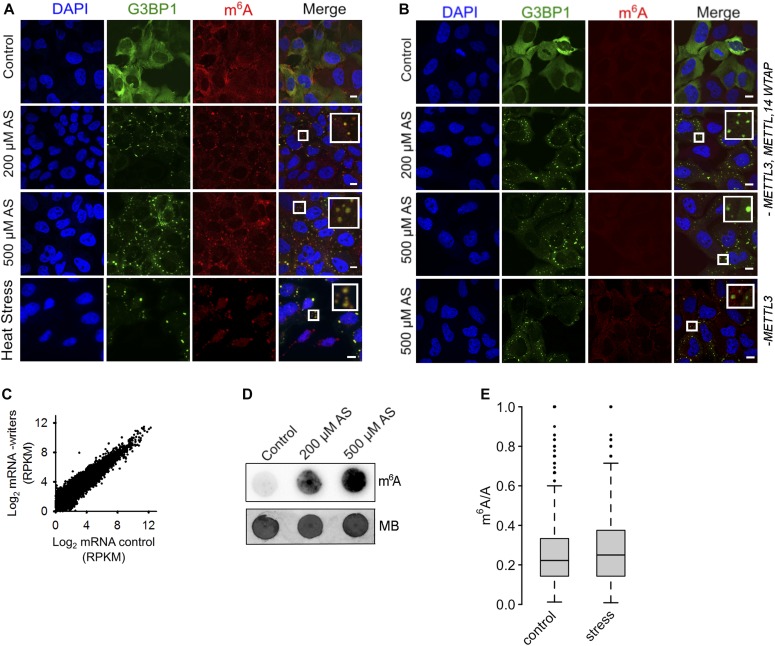
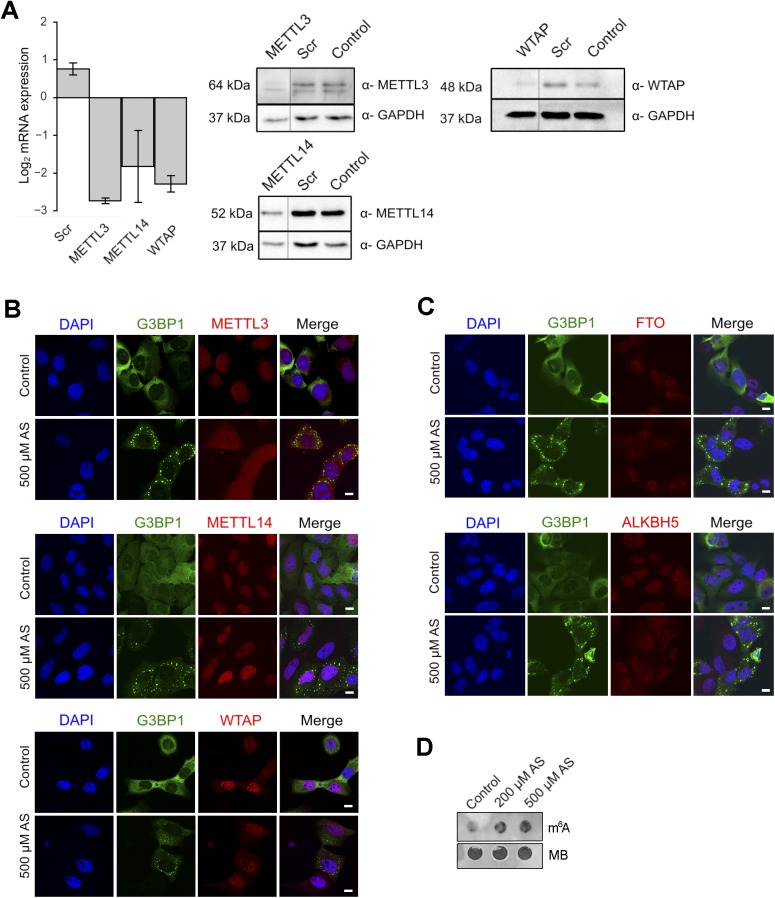
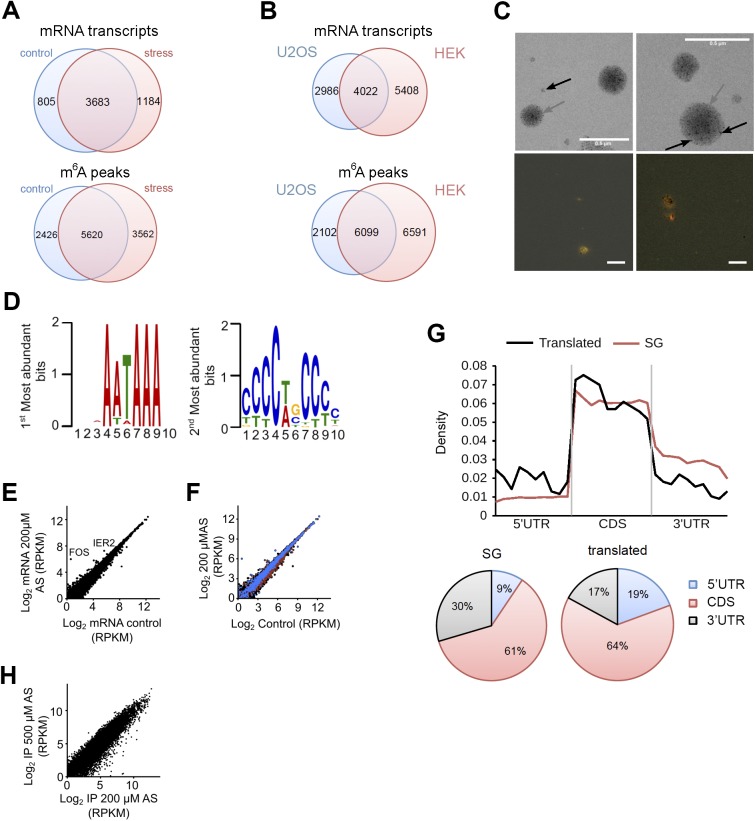
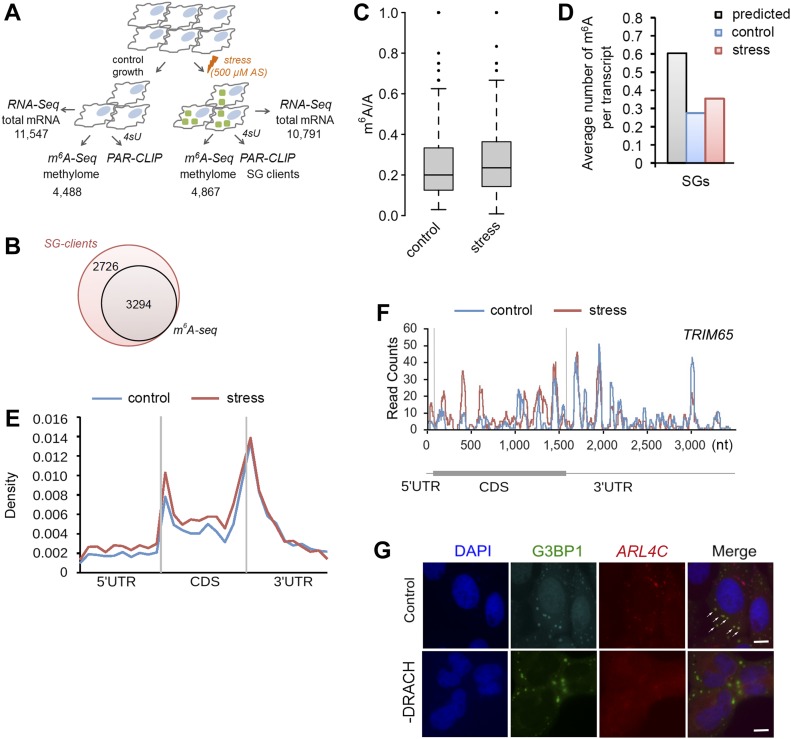
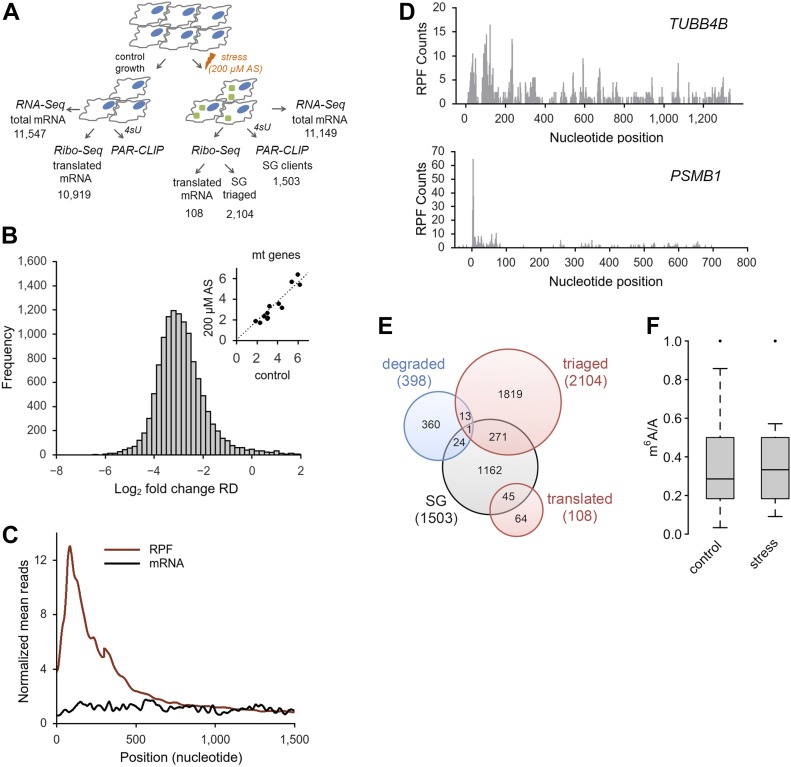
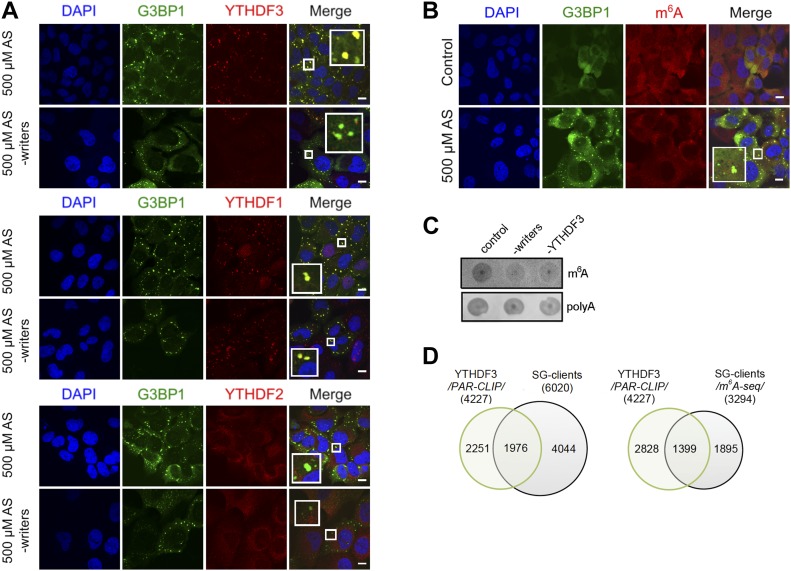
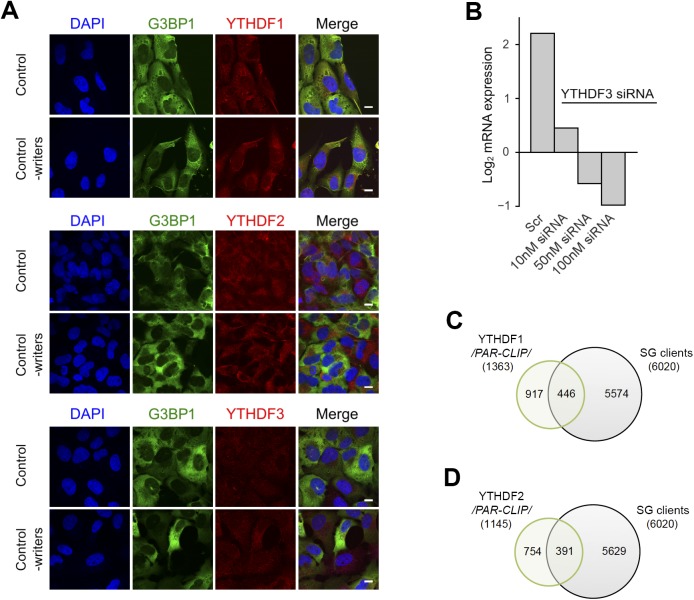
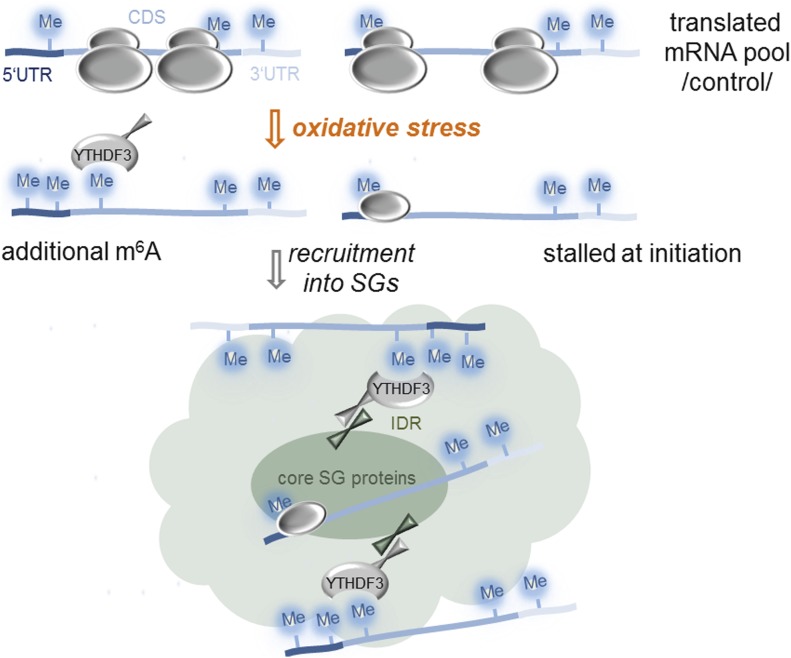
Reversible post-transcriptional modifications on messenger RNA emerge as prevalent phenomena in RNA metabolism. The most abundant among them is N6-methyladenosine (m6A) which is pivotal for RNA metabolism and function; its role in stress response remains elusive. We have discovered that in response to oxidative stress, transcripts are additionally m6A modified in their 5' vicinity. Distinct from that of the translationally active mRNAs, this methylation pattern provides a selective mechanism for triaging mRNAs from the translatable pool to stress-induced stress granules. These stress-induced newly methylated sites are selectively recognized by the YTH domain family 3 (YTHDF3) "reader" protein, thereby revealing a new role for YTHDF3 in shaping the selectivity of stress response. Our findings describe a previously unappreciated function for RNA m6A modification in oxidative-stress response and expand the breadth of physiological roles of m6A.


Conflict of interest statement

The authors declare that they have no conflict of interest.

Figures

Figure S1.
Figure S1.. Exposure to stress and SGs formation.
(A) SGs form in a concentration-depended manner in U2OS-G3BP1 and HEK-TIA1 cells following exposure to different concentrations of AS for 30 min (upper fluorescent images). TIA1 was visualized with FLAG antibodies (green), G3BP1 was visualized through its fluorescent GFP tag (green), and nuclei were counterstained with DAPI (blue). Control denotes untreated cells. Scale bar, 10 μm. Polysome profiles of HEK-TIA1 cells exposed to different AS concentrations (lower panel). 80S designates an assembled ribosome and 40S and 60S denote the ribosomal subunits. (B) mRNAs are sequestered in SGs. In situ hybridization (FISH) with combined probe for ADAMTS1, ADAMTS3, ADAMTS8, and ADAMTS15 transcripts (all also detected as m6A modified in the m6A-Seq) in U2OS-G3BP1 exposed for 30 min to AS. Scale bar, 10 μm. (C) Comparison between total mRNA from control HEK-TIA1 cells or exposed to 500 μM AS determined from RNA-Seq. Genes with significantly increased expression under stress are designated. R2 = 0.978, Pearson correlation coefficient. Source data are available for this figure.
Figure 1.
Figure 1.. m6A signal increases in response to oxidative stress and accumulates in SGs.
(A) U2OS-G3BP1 cells grown under permissive conditions (control), exposed to mild (200 μM AS) or harsh (500 μM AS) oxidative stress for 30 min, or to heat for 2 h at 42°C and immunostained with anti-m6A antibody. SGs (hyperfluorescent loci) were visualized through G3BP1–GFP (green), nuclei were counterstained with DAPI (blue). Scale bar, 10 μm. (B) Combined siRNA knockdown of the “writer” complex (METTL3, METTL14, and WTAP) or METTL3 alone (lowest row) in U2OS-G3BP1 cells. METTL3, METTL14, or WTAP were silenced to maximally 70%, resulting in some residual m6A immunostaining (Fig S2A). Scale bar, 10 μM. (C) Comparison of the expression of total mRNA in control growth and following siRNA-mediated knockdown of the “writer” complex (-writers) in HEK-TIA1 cells determined by RNA-Seq. R2 = 0.928, Pearson correlation coefficient. (D) Total RNA isolated from the same amount of U2OS-G3BP1 cells grown at permissive (control) conditions or exposed to various AS concentrations and detected with m6A antibody or methylene blue. (E) Box-plot of m6A sites (from the m6A-Seq) detected across all mRNAs of untreated cells (control) or exposed to stress (500 μM AS) and presented as a ratio of the total m6A sites (e.g., predicted DRACH motifs designated as A in the ratio m6A/A). P = 2.8 × 10⁻⁶ control versus stress, Mann–Whitney test. Source data are available for this figure.
Figure S2.
Figure S2.. Cellular localization of the “writers” and “erasers” in U2OS-G3BP1 cells.
(A) qRT–PCR following combined siRNA knockdown of the “writer complex” (METTL3, METTL14, and WTAP) for 48 h. The levels of each writer mRNA were normalized to the expression of β-actin mRNA. Data are means ± SD (n = 2). Scr denotes scrambled siRNA and accounts for unspecific effects. Representative Western blots (n = 2) to verify the decrease in the expression of each of the proteins in the writer complex using specific antibodies. GAPDH serves as loading control. (B) Localization of METTL3, METTL14, and WTAP under permissive growth and upon stress exposure (500 μM AS, 30 min). G3BP1 detected through its fluorescent GFP tag is used to monitor SG formation under stress. Scale bar, 10 μm. (C) Nuclear localization of FTO (upper panel) and ALKH5 (bottom panel) “erasers” in both control growth and following treatment with 500 μM AS for 30 min. G3BP1 detected through its fluorescent GFP tag is used to monitor SG formation under stress. Scale bar, 10 μm. (D) Total RNA isolated from equal amount of HEK-TIA1 cells grown at permissive (control) conditions or exposed to various AS concentrations and detected with m6A antibody or methylene blue (MB). Source data are available for this figure.
Figure S3.
Figure S3.. Analysis of the deep-sequencing data.
(A) Venn diagram of mRNAs containing at least one m6A modification (upper diagram) and m6A peaks detected in mRNAs (lower diagram) identified in HEK-TIA1 (HEK) cells under control growth and at 500 μM AS stress. (B) Venn diagram of mRNAs containing at least one m6A modification (upper diagram) and m6A peaks detected in mRNAs (lower diagram) identified in HEK-TIA1 (HEK) cells in this study compared with those in U2OS cells (Xiang et al, 2017). (C) Transmission electron microscopy image of isolated SGs (gray arrow) subjected to PAR-CLIP (upper images). Black arrow indicates magnetic beads (appear as light, non-transparent black dots) used to isolate SGs. FISH on isolated SGs using fluorescently labeled oligo-dT primers recognizing the polyA tails of mRNAs (red). The yellow/orange color denotes colocalization of polyA-mRNA and G3BP1-GFP (green) signal. Scale bar, 0.5 μM. (D) The two most abundant motifs among the SG mRNA clients revealed by MEME motif search. These motifs score for various RNA-binding proteins and not only for TIA1 (Munteanu et al, 2018 Preprint). (E). Comparison between total mRNA from control HEK-TIA1 cells or exposed to 200 μM AS determined by RNA-Seq. R2 = 0.992, Pearson correlation coefficient. (F) Identified SG clients span a large expression range. Total mRNAs, black; mRNAs in SGs, blue; and mRNAs generating RPFs at 200 μM AS, red. (G) Distribution of the predicted DRACH motifs (upper plot) or depicted as fractions (lower pie charts) in different transcript segments of the SG clients and translated genes. Transcript regions were binned for comparable lengths. CDS are the longest and exhibit the highest fraction of m6A motifs. Genes translated under moderate stress exposure (200 μM AS) contain more DRACH motifs in the 5′ UTRs compared with the 5′ UTRs of the SG mRNA clients, P = 1.4 × 10⁻³, Mann–Whitney test. (H) Correlation of the SG transcripts detected at 200 and 500 μM AS in the PAR-CLIP of two merged biological replicates. R2 = 0.883, Pearson correlation coefficient. Source data are available for this figure.
Figure 2.
Figure 2.. Site-specific methylation of SG mRNAs in response to oxidative stress.
(A) Overview of the experimental setup. Numbers denote confidently identified mRNAs in each deep-sequencing approach. (B) Overlap of the SG transcripts from the PAR-CLIP and m6A-Seq data sets. (C) Box-plot of m6A sites (from the m6A-Seq) detected across SG transcripts of untreated HEK-TIA1 cells (control) or exposed to stress (500 μM AS) and presented as a ratio of the total m6A sites (e.g., predicted DRACH motifs designated as A in the ratio m6A/A). P = 5.1 × 10⁻⁴ control versus stress, Mann–Whitney test. (D) Average number of m6A-modified DRACH motifs detected in the SG mRNAs following stress exposure to 500 μM AS (stress) compared with their methylation level under control growth. P = 1.49 × 10⁻⁵ control versus stress, Mann–Whitney test. For comparison, the average number of all putative DRACH motifs (predicted) per transcript is also included. (E) Metagene profiles of m6A distribution (from the m6A-Seq) along different transcript regions of SG mRNAs from untreated (control) or cells exposed to 500 μM AS (stress). P = 1.4 × 10⁻³ for 5′ UTRs and P = 1.6 × 10⁻² for 5′ vicinity of the CDSs; Mann–Whitney test between stress versus control. Transcript regions were binned for comparable lengths. (F) An example of stress-induced m6A modification in the SG transcript TRIM65. (G) Deletion of the methylation sites in the 5′ vicinity of ARL4C mRNA hinders its localization into SGs. U2OS-G3BP1 cells expressing ARL4C-CFP with unchanged sequence (control) or deleted DRACH motifs (-DRACH) exposed to 500 μM AS. The colocalization of the wild-type ARL4C-CFP mRNA with SGs is designated by white arrows. ARL4C-CFP mRNA was visualized by in situ hybridization (FISH). SGs (hyperfluorescent loci) were visualized through G3BP1–GFP (green), and nuclei were counterstained with DAPI (blue). 58 of 70 cells (83%) showed loss of colocalization by deleted DRACH motifs. Scale bar, 10 μm. Source data are available for this figure.
Figure 3.
Figure 3.. Oxidative stress globally impairs translation.
(A) Overview of the experimental setup at mild stress (200 μM AS). Numbers denote confidently identified transcripts in each deep-sequencing approach. (B) Log-changes of the RD values between control and exposed to 200 μM AS HEK-TIA1 cells. Inset, RD values of the mitochondrially encoded genes which remain unchanged and are used as baseline for normalization of RD values of the nuclearly encoded genes. (C) Cumulative metagene profile of the read density as a function of position for both RPF (from Ribo-Seq) and mRNAs (from RNA-Seq) upon exposure to 200 μM AS. The expressed genes were individually normalized, aligned at the start codon, and averaged with equal weight. (D) Representative examples of a genuinely translated transcript (TUBB4B) and a transcript with stalled translation (PSMB1) at 200 μM AS. The first nucleotide of the start codon is designated as zero. (E) Venn diagram of the distribution of various transcript groups detected at 200 μM AS. SG, detected in the PAR-CLIP, degraded, identified in the RNA-Seq, red circles, mRNAs with RPFs in the Ribo-Seq. (F) Box-plot of m6A sites (from the m6A-Seq) detected across the actively translated 108 transcripts in control growth or upon stress exposure and presented as a ratio of the total m6A sites (e.g., predicted DRACH motifs designated as A in the ratio m6A/A). P = 0.97 control versus stress, Mann–Whitney test. Source data are available for this figure.
Figure 4.
Figure 4.. YDHDF3 colocalizes with m6A-modified mRNA into SGs.
(A) Cellular localization of YTHDF1, YTHDF2, and YTHDF3 in U2OS-G3BP1 cells exposed to oxidative stress (500 μM AS) alone or combined with knockdown (-writers) of the writer complex (METTL3, METTL14, and WTAP). Scale bar, 10 μM. (B) siRNA knockdown of YTHDF3 in U2OS-G3BP1 cells abrogated colocalization of m6A-modified RNA within the SGs. (C) Total RNA of SGs isolated from U2OS-G3BP1 with siRNA knockdown of the writer complex (-writers) or YTHDF3 (-YTHDF3), and control cells exposed to 500 μM AS and detected with m6A antibody or fluorescently labeled oligo-dT primers recognizing the polyA tails of mRNAs. (D) Common clients between the YTHDF3 PAR-CLIP target genes (4,227) and total SG clients (6,020 transcripts) and the methylated SG clients detected with high confidence in m6A-Seq (3,294 transcripts). P = 1.07 × 10−155 (for PAR-CLIP, left) and P = 3.78 × 10−214 (for m6A-Seq, right), hypergeometric test.
Figure S4.
Figure S4.. Localization and clients of the YTHDF readers.
(A) Cytoplasmic localization of YTHDF1, YTHDF2, and YTHDF3 in control, unstressed cells and by silenced “writers” (METTL3, METTL14, and WTAP). The “readers” were detected with Alexa568-conjugated secondary antibody (red). Scale bar, 10 μm. (B) qRT–PCR following siRNA knockdown of YTHDF3 for 48 h in U2OS-G3BP1 cells. The YTHDF3 expression was normalized to the expression of β-actin mRNA. Scr denotes scrambled siRNA and accounts for unspecific effects. (C) mRNA clients of YTHDF1 identified by PAR-CLIP in Wang et al (2015) and compared with the SG transcripts identified in this study. P = 0.006, hypergeometric test. (D) mRNA clients of YTHDF2 identified by PAR-CLIP in Wang et al (2014) and compared with the SG transcripts identified in this study. P = 3.9 × 10⁻⁴, hypergeometric test. Source data are available for this figure.
Figure 5.
Figure 5.. Proposed model of mRNA triaging into SGs.
mRNAs associate with SGs either by stress-induced methylation in an YTHDF3-dependent manner (left) or by stress-induced stalling at initiation (right).

References

    1. Alarcon CR, Goodarzi H, Lee H, Liu X, Tavazoie S, Tavazoie SF (2015a) HNRNPA2B1 is a mediator of m(6)A-dependent nuclear RNA processing events. Cell 162: 1299–1308. 10.1016/j.cell.2015.08.011 - DOI - PMC - PubMed
    1. Alarcon CR, Lee H, Goodarzi H, Halberg N, Tavazoie SF (2015b) N6-methyladenosine marks primary microRNAs for processing. Nature 519: 482–485. 10.1038/nature14281 - DOI - PMC - PubMed
    1. Andreev DE, O'Connor PB, Fahey C, Kenny EM, Terenin IM, Dmitriev SE, Cormican P, Morris DW, Shatsky IN, Baranov PV (2015) Translation of 5′ leaders is pervasive in genes resistant to eIF2 repression. Elife 4: e03971 10.7554/elife.03971 - DOI - PMC - PubMed
    1. Buchan JR, Parker R (2009) Eukaryotic stress granules: The ins and outs of translation. Mol Cell 36: 932–941. 10.1016/j.molcel.2009.11.020 - DOI - PMC - PubMed
    1. Cekaite L, Peng Q, Reiner A, Shahzidi S, Tveito S, Furre IE, Hovig E (2007) Mapping of oxidative stress responses of human tumor cells following photodynamic therapy using hexaminolevulinate. BMC Genomics 8: 273 10.1186/1471-2164-8-273 - DOI - PMC - PubMed

LinkOut - more resources