. 2018 Dec;29(12):1352-1363.
doi: 10.1089/hum.2018.048. Epub 2018 Nov 19.

Synergistic Antitumor Effect on Bladder Cancer by Rational Combination of Programmed Cell Death 1 Blockade and CRISPR-Cas9-Mediated Long Non-Coding RNA Urothelial Carcinoma Associated 1 Knockout

Affiliations

Synergistic Antitumor Effect on Bladder Cancer by Rational Combination of Programmed Cell Death 1 Blockade and CRISPR-Cas9-Mediated Long Non-Coding RNA Urothelial Carcinoma Associated 1 Knockout

Shuai Zhen et al. Hum Gene Ther. 2018 Dec.

Abstract

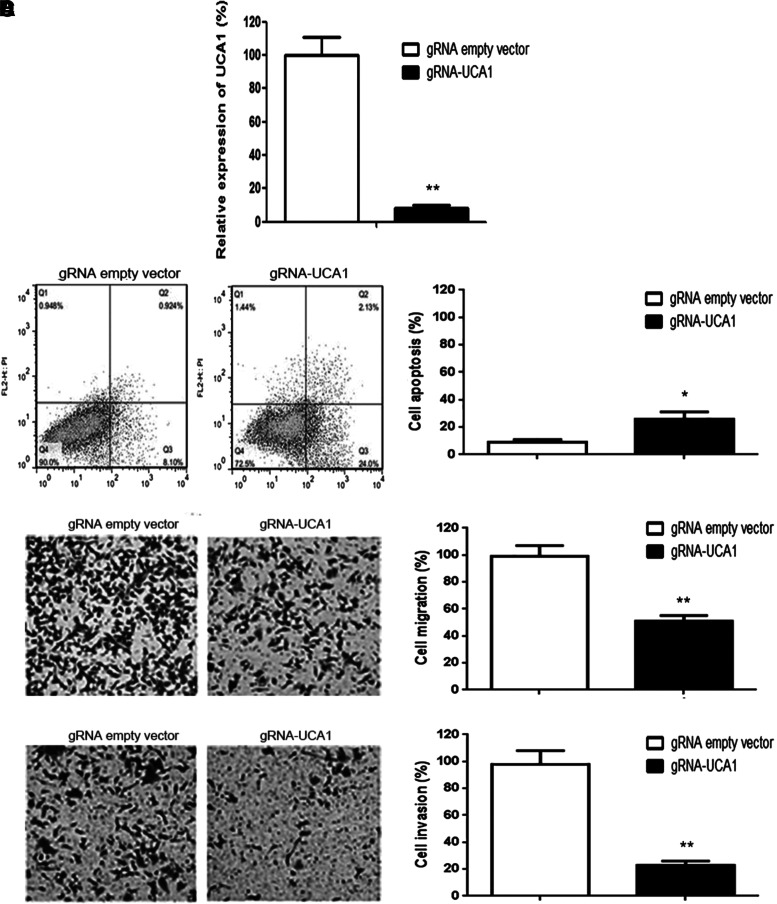
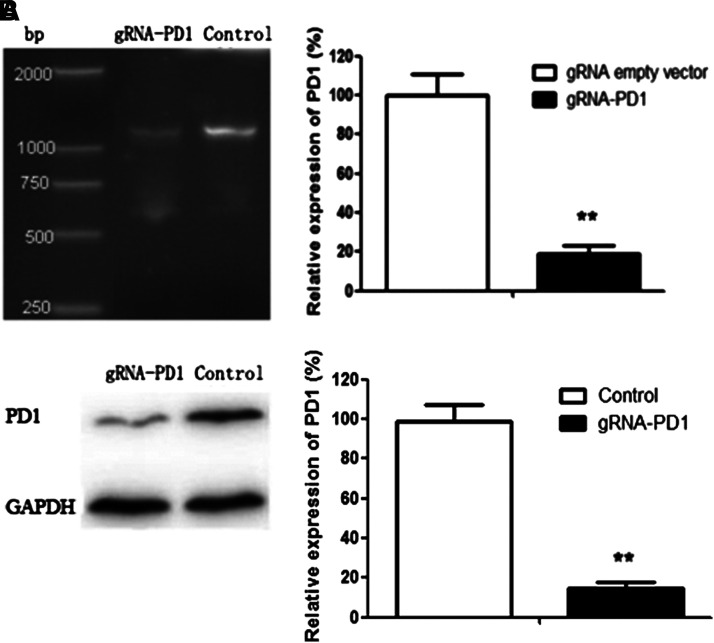
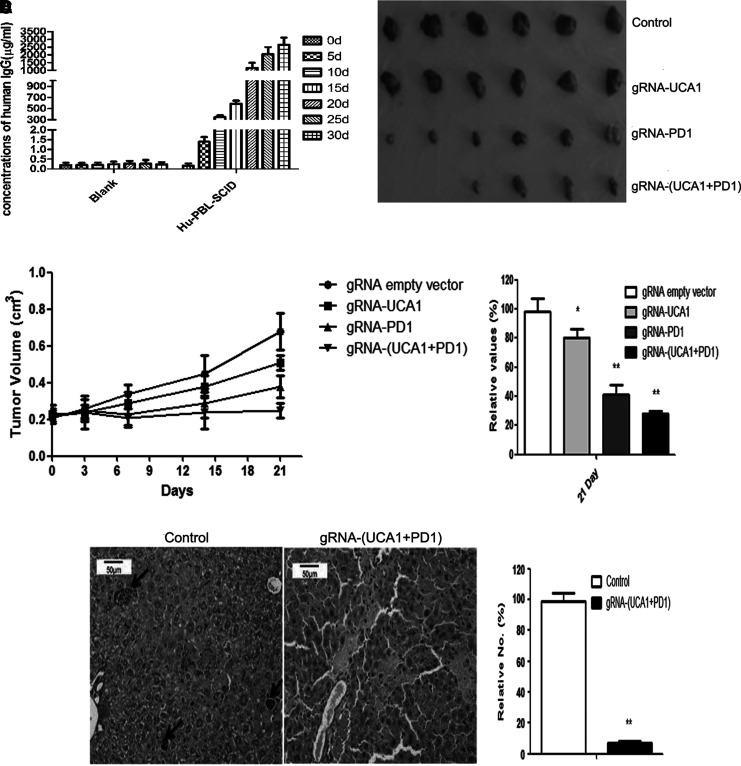
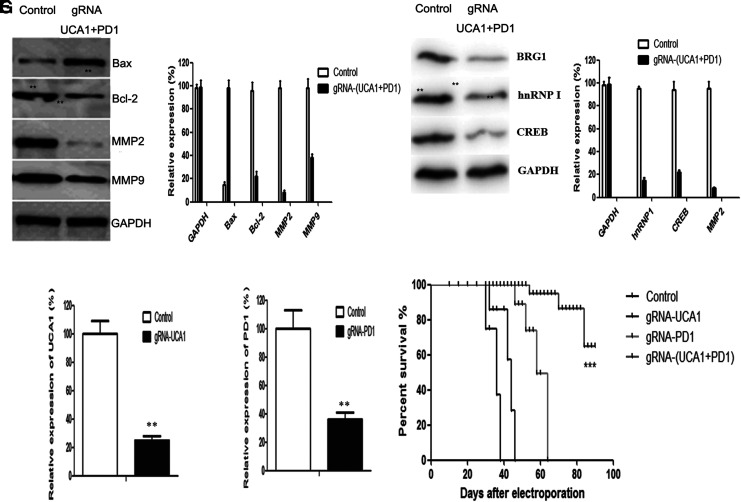
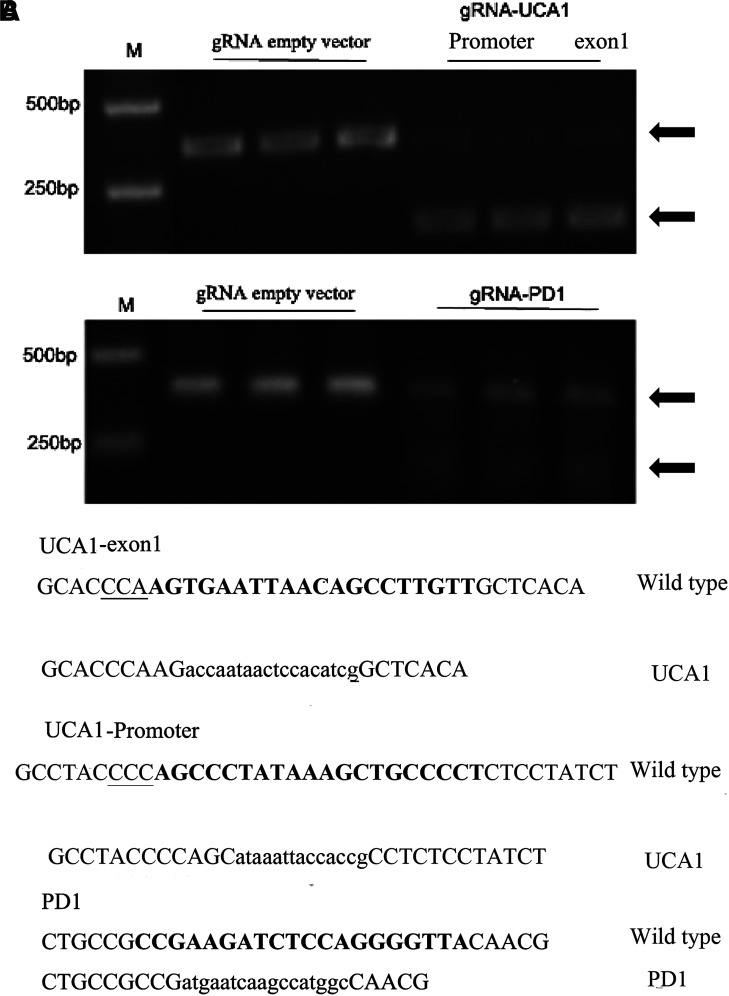
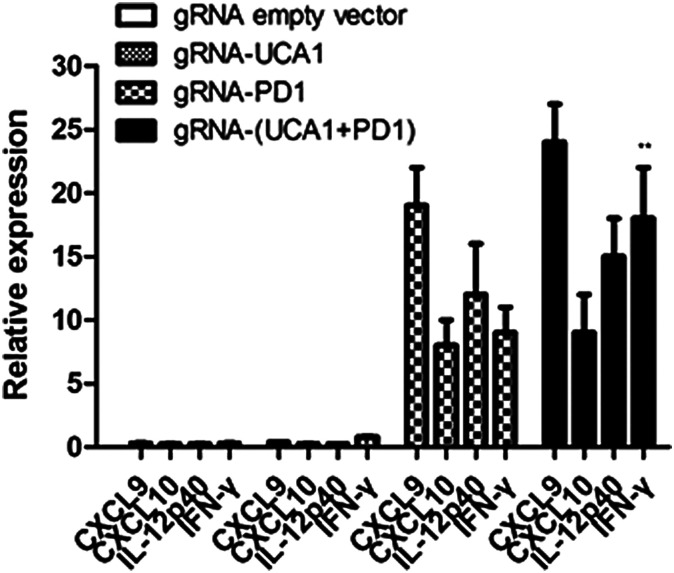
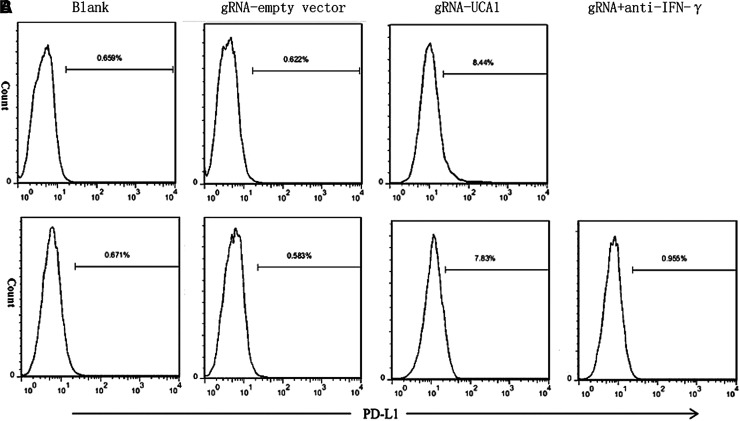
Targeted therapy produces objective responses in bladder cancer patients, although the responses can be short. Meanwhile, response rates to immune therapy are lower, but the effects are more durable. Based on these findings, it was hypothesized that urothelial carcinoma associated 1 (UCA1)-targeted therapy could synergize with programmed cell death 1 (PD-1) blockade to enhance antitumor activity. To test this hypothesis, the effects of CRISPR-Cas9 targeting of UCA1 and PD-1 were assessed in vitro and in vivo. It was found that gRNA/cas9-targeted UCA1 induced apoptosis of 5637 bladder cancer cells, whereas PD-1 gene knockout could be achieved by electroporation of gRNA/cas9 targeting PD-1, as detected by polymerase chain reaction. In 5637 cell-xenografted humanized SCID mice, stimulation with CRISPR-Cas9 systems, immune phenotypes, and cytokine expression of human dendritic cells (DCs) was detected by flow cytometry, and polymerase chain reaction, respectively. The results of these assays suggested that the gRNA/cas9 treatment upregulated expression of CD80, CD83, and CD86 and significantly increased interleukin (IL)-6, IL-12, and IL-23 and tumor necrosis factor alpha mRNA levels. Co-administration of anti-PD-1 and anti-UCA1 treatment suppressed tumor growth and markedly improved survival of 5637 xenografted mice. Additionally, the combination treatment increased interferon gamma production by T cells that subsequently enhanced the expression of Th1-associated immune-stimulating genes to reduce transcription of regulatory/suppressive immune genes and reshape the tumor microenvironment from an immunosuppressive to a stimulatory state. Finally, anti-UCA1 treatment was shown to induce interferon gamma-dependent programmed cell death ligand 1 expression within 5637 xenograft tumors in vivo. Together, these results demonstrate potent synergistic effects of a combination therapy using LncRNA UCA1-targeted therapy and immune checkpoint blockade of PD-1, thus supporting the translational potential of this combination strategy for clinical treatment of bladder cancer.

Keywords: LncRNA; PD-1; checkpoint blockade; combination therapy; targeted therapy.


Figures

Figure 1.
Figure 1.
Effect of CRISPR-Cas9-mediated knockdown of urothelial carcinoma associated 1 (UCA1) expression. (A) Repression of UCA1 expression by CRISPR-Cas9. CRISPR-Cas9 plasmids were transfected into 5637 cells, which were collected 48 h after transfection. The level of UCA1 expression was measured by quantitative real-time polymerase chain reaction (PCR; control: gRNA empty vector). (B) Cells having UCA1 knockdown exhibited a marked increase in apoptosis. (C and D) In vitro migration and invasion of cells transfected with CRISPR-Cas9-UCA1 plasmids was reduced in Transwell assays (200 × magnification). Data shown are the mean ± standard deviation (SD) based on three independent experiments. *p < 0.05; **p < 0.01.
Figure 2.
Figure 2.
Knockdown of programmed cell death 1 (PD-1) gene expression following transfection of 5637 cells with CRISPR-Cas9. PD-1 expression was determined by (A) PCR and (B) Western blot. Data shown are the mean ± SD based on three independent experiments. **p < 0.01.
Figure 3.
Figure 3.
Antitumor activity of gRNA/cas9 on 5637 xenografts in a hul-mouse xenograft model. A total of 1 × 106 5637 cells were injected subcutaneously into the left flanks of mice. When the tumor volumes reached∼200 mm3, the mice were randomly divided into four groups. To observe antitumor effects, gRNA/cas9 was administered by electroporation. (A) Total human immunoglobulin G (IgG) detected in serum using enzyme-linked immunosorbent assay. (B) Tumors were removed, photographed, and weighed. (C) Tumor volumes measured at the indicated time points after treatment. (D) Liver tissues removed on day 21 post treatment for additional analyses. Histopathologic changes of liver tissues assayed by hematoxylin and eosin staining showed liver metastasis (arrow). (E) MMP2, MMP9, Bcl-2, BRG1, hnRNP I, and CREB expression as determined by Western blot. (F) Total RNA isolated from tumor tissues and dendritic cells (DCs) and used to detect UCA1 and PD-1 expression by RT-PCR. (G) Survival after treatment. Data shown are the mean ± SD based on three independent experiments. *p < 0.05; **p< 0.01.
Figure 3.
Figure 3.
Antitumor activity of gRNA/cas9 on 5637 xenografts in a hul-mouse xenograft model. A total of 1 × 106 5637 cells were injected subcutaneously into the left flanks of mice. When the tumor volumes reached∼200 mm3, the mice were randomly divided into four groups. To observe antitumor effects, gRNA/cas9 was administered by electroporation. (A) Total human immunoglobulin G (IgG) detected in serum using enzyme-linked immunosorbent assay. (B) Tumors were removed, photographed, and weighed. (C) Tumor volumes measured at the indicated time points after treatment. (D) Liver tissues removed on day 21 post treatment for additional analyses. Histopathologic changes of liver tissues assayed by hematoxylin and eosin staining showed liver metastasis (arrow). (E) MMP2, MMP9, Bcl-2, BRG1, hnRNP I, and CREB expression as determined by Western blot. (F) Total RNA isolated from tumor tissues and dendritic cells (DCs) and used to detect UCA1 and PD-1 expression by RT-PCR. (G) Survival after treatment. Data shown are the mean ± SD based on three independent experiments. *p < 0.05; **p< 0.01.
Figure 4.
Figure 4.
Targeted disruption of sequences in vivo. (A) A T7 endonuclease 1 (T7E1) assay was conducted on UCA1/PD-1 DNA isolated from mice. Each lane represents DNA obtained from an individual animal. The T7 endonuclease 1 (T7E1) assay was conducted using DNA isolated from DCs transfected with gRNA empty vector, CRISPR-Cas9-UCA1, or PD-1 plasmids. M = DNA marker. The arrows indicate the larger intact PCR product (UCA1: 373 bp; PD-1: 381 bp) and a smaller digested fragment (UCA1: 122 bp; PD-1: 112 bp). The measured target disruption is indicated below as a percentage. (B) Sequencing analysis of the CRISPR-Cas target site. The UCA1/PD-1 DNA target sequence is indicated in bold, and the adjacent protospacer motif sequence is highlighted as underlined text. The deletion and insertions are highlighted by lower-case letters. The wild-type sequence is shown on the top. Sequence alterations include both insertions and deletions.
Figure 5.
Figure 5.
Immune activation of human mononuclear cell-derived DCs in vivo. DCs were collected and stained with fluorescein isothiocyanate (FITC)-conjugated anti-CD80 antibody, phycoerythrin (PE)-conjugated anti-CD83 antibody, and allophycocyanin (APC)-conjugated anti-CD86 antibody, and the immune phenotypes were analyzed by FACS. (A) The percentage of CD80-, CD83-, or CD86-positive cells. (B) Cytokine expression as detected by real-time PCR at 48 h after stimulation. Data shown are the mean ± SD based on three independent experiments. **p < 0.01.
Figure 6.
Figure 6.
Expression profiling of immune-associated genes in tumors from treated mice. Mice were inoculated intraperitoneally (i.p.) with 1 × 106 5637 cells. RNA was extracted from the excised tumors 21 days after injection and used for analysis of immune-associated gene expression by real-time PCR. Data shown are the mean ± SD based on three independent experiments. **p < 0.01.
Figure 7.
Figure 7.
In vivo anti-UCA1 treatment induced programmed cell death ligand 1 (PD-L1) expression within 5637 tumors. Mice were inoculated i.p. with 1 × 106 5637 cells and treated with gRNA empty vector or anti-UCA1-gRNA. Tumor cells harvested from the treated mice were stained with APC-conjugated anti-PD-L1 or isotype control antibody to evaluate PD-L1 expression by flow cytometry. (A) In vitro cultured 5637 tumor cells were treated with peritoneal lavage fluid (20%, v/v) prepared from control or anti-UCA1 treated mice for 24 h, and PD-L1 expression was then analyzed by flow cytometry. (B) In some experiments, 5637 tumor cells treated with peritoneal lavage fluid from anti-UCA1 treated mice were cultured in the presence of isotype or α-IFN-γ neutralizing antibody. Untreated 5637 cells were included as a control. Data are representative of two independent experiments.

Similar articles

Cited by

References

    1. Siegel R, Ma J, Zou Z, et al. Cancer statistics. CA Cancer J Clin 2014;64:9–29. - PubMed
    1. Oing C, Rink M, Oechsle K, et al. Second line chemotherapy for advanced and metastatic urothelial carcinoma: vinflunine and beyond—a comprehensive review of the current literature. J Urol 2016;195:254–263. - PubMed
    1. Shah JB, McConkey DJ, Dinney CP. New strategies in muscle-invasive bladder cancer: on the road to personalized medicine. Clin Cancer Res 2011;17:2608–2612. - PubMed
    1. McConkey D, Choi W, Dinney C, et al. New insights into subtypes of invasive bladder cancer: considerations of the clinician. Eur Urol 2014;66:609–610. - PubMed
    1. Carosella ED, Ploussard G, LeMaoult J, et al. A systematic review of immunotherapy in urologic cancer: evolving roles for targeting of CTLA-4, PD-1/PD-L1, and HLA-G. Eur Urol 2015;68:267–279. - PubMed

Publication types

MeSH terms

LinkOut - more resources