Review
. 2019 Jan;290(1):9-22.
doi: 10.1148/radiol.2018181349. Epub 2018 Nov 20.

Imaging of Cancer Immunotherapy: Current Approaches and Future Directions

Affiliations
Review

Imaging of Cancer Immunotherapy: Current Approaches and Future Directions

Mizuki Nishino et al. Radiology. 2019 Jan.

Abstract

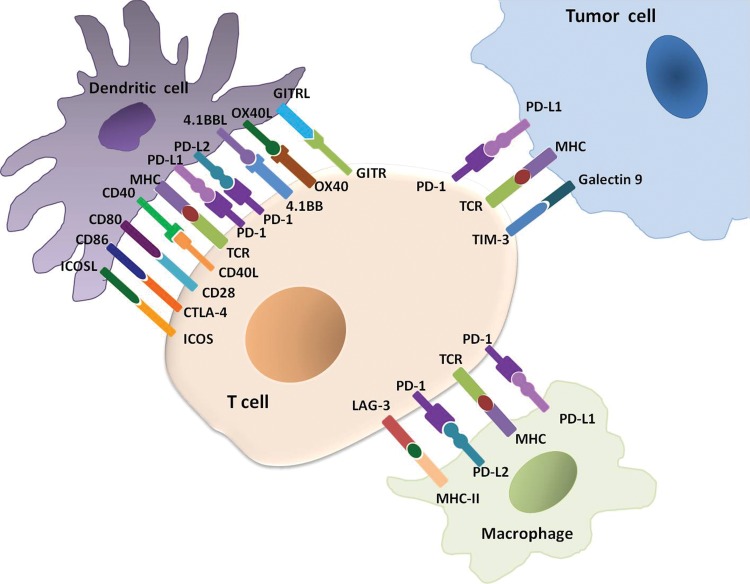
Cancer immunotherapy using immune-checkpoint inhibitors has emerged as an effective treatment option for a variety of advanced cancers in the past decade. Because of the distinct mechanisms of immunotherapy that activate the host immunity to treat cancers, unconventional immune-related phenomena are encountered in terms of tumor response and progression, as well as drug toxicity. Imaging plays an important role in objectively characterizing immune-related tumor responses and progression and in detecting and monitoring immune-related adverse events. Moreover, emerging data suggest a promise for molecular imaging that can visualize the specific target molecules involved in immune-checkpoint pathways. In this article, the background and current status of cancer immunotherapy are summarized, and the current methods for imaging evaluations of immune-related responses and toxicities are reviewed along with their limitations and pitfalls. Emerging approaches with molecular imaging are also discussed as a future direction to address unmet needs.


Figures

Figure 1:
Figure 1:
Immune-checkpoint molecules between tumor cells and immune cells in the tumor microenvironment. A number of inhibitory receptors and ligands are expressed on T cells, dendritic cells, macrophages, and tumor cells in the tumor microenvironment and serve as critical mediators of immune suppression by tumors. These receptor-ligand pairs, such as programmed cell death ligand 1 (PD-1)/programmed cell death protein ligand 1 (PD-L1) in the T cell and tumor cell interaction, are called “immune checkpoint” molecules. The blockade of these checkpoints using immune-checkpoint inhibitors such as PD1/PD-L1 inhibitors and cytotoxic T-lymphocyte antigen 4 (CTLA-4) inhibitors have emerged as successful treatment options for a variety of advanced cancers. (Modified from references and .) GITR = glucocorticoid-induced tumor necrosis factor receptor-related protein, GITRL = GITR ligand, ICOS = inducible T-cell co-stimulator, ICOSL = ICOS ligand, LAG = lymphocyte activation gene, MHC = major histocompatibility complex, TCR = T-cell receptor, TIM = T-cell immunoglobulin and mucin domain.
Figure 2a:
Figure 2a:
Pseudoprogression with initial increase in tumor burden followed by subsequent tumor shrinkage due to immune-related response in a 66-year-old woman with metastatic melanoma treated with nivolumab and ipilimumab. (a) Baseline contrast material–enhanced axial CT image obtained before therapy shows a metastatic nodule (arrow) in the left upper medial thigh measuring 4 cm in the longest diameter. (b) Follow-up axial CT image at 3 months of therapy shows an increase in the lesion, which now measures 5 cm (arrow), indicating progressive disease according to the Response Evaluation Criteria in Solid Tumors, or RECIST. (c) Further follow-up axial CT image at 6 months of therapy shows a decrease in size of the lesion, which now measures 2.5 cm (arrow), representing immune-related tumor response.
Figure 2b:
Figure 2b:
Pseudoprogression with initial increase in tumor burden followed by subsequent tumor shrinkage due to immune-related response in a 66-year-old woman with metastatic melanoma treated with nivolumab and ipilimumab. (a) Baseline contrast material–enhanced axial CT image obtained before therapy shows a metastatic nodule (arrow) in the left upper medial thigh measuring 4 cm in the longest diameter. (b) Follow-up axial CT image at 3 months of therapy shows an increase in the lesion, which now measures 5 cm (arrow), indicating progressive disease according to the Response Evaluation Criteria in Solid Tumors, or RECIST. (c) Further follow-up axial CT image at 6 months of therapy shows a decrease in size of the lesion, which now measures 2.5 cm (arrow), representing immune-related tumor response.
Figure 2c:
Figure 2c:
Pseudoprogression with initial increase in tumor burden followed by subsequent tumor shrinkage due to immune-related response in a 66-year-old woman with metastatic melanoma treated with nivolumab and ipilimumab. (a) Baseline contrast material–enhanced axial CT image obtained before therapy shows a metastatic nodule (arrow) in the left upper medial thigh measuring 4 cm in the longest diameter. (b) Follow-up axial CT image at 3 months of therapy shows an increase in the lesion, which now measures 5 cm (arrow), indicating progressive disease according to the Response Evaluation Criteria in Solid Tumors, or RECIST. (c) Further follow-up axial CT image at 6 months of therapy shows a decrease in size of the lesion, which now measures 2.5 cm (arrow), representing immune-related tumor response.
Figure 3a:
Figure 3a:
Pseudoprogression with appearance of a new lesion followed by subsequent immune-related response in a 66-year-old woman with metastatic melanoma treated with nivolumab and ipilimumab. Compared with (a) a baseline axial CT image obtained prior to the initiation of therapy, (b) a follow-up axial CT image obtained after 3 months of therapy shows a new subcutaneous lesion (arrow), indicating progressive disease according to the Response Evaluation Criteria in Solid Tumors, or RECIST; however, (c) a further follow-up axial CT image obtained after 6 months of therapy shows shrinkage of the new lesion (arrow), representing immune-related response. Note that another lesion in the deep subcutaneous tissue (*) increased at 3-month follow-up, followed by subsequent shrinkage of the lesion, also indicating immune-related response after initial increase in tumor burden.
Figure 3b:
Figure 3b:
Pseudoprogression with appearance of a new lesion followed by subsequent immune-related response in a 66-year-old woman with metastatic melanoma treated with nivolumab and ipilimumab. Compared with (a) a baseline axial CT image obtained prior to the initiation of therapy, (b) a follow-up axial CT image obtained after 3 months of therapy shows a new subcutaneous lesion (arrow), indicating progressive disease according to the Response Evaluation Criteria in Solid Tumors, or RECIST; however, (c) a further follow-up axial CT image obtained after 6 months of therapy shows shrinkage of the new lesion (arrow), representing immune-related response. Note that another lesion in the deep subcutaneous tissue (*) increased at 3-month follow-up, followed by subsequent shrinkage of the lesion, also indicating immune-related response after initial increase in tumor burden.
Figure 3c:
Figure 3c:
Pseudoprogression with appearance of a new lesion followed by subsequent immune-related response in a 66-year-old woman with metastatic melanoma treated with nivolumab and ipilimumab. Compared with (a) a baseline axial CT image obtained prior to the initiation of therapy, (b) a follow-up axial CT image obtained after 3 months of therapy shows a new subcutaneous lesion (arrow), indicating progressive disease according to the Response Evaluation Criteria in Solid Tumors, or RECIST; however, (c) a further follow-up axial CT image obtained after 6 months of therapy shows shrinkage of the new lesion (arrow), representing immune-related response. Note that another lesion in the deep subcutaneous tissue (*) increased at 3-month follow-up, followed by subsequent shrinkage of the lesion, also indicating immune-related response after initial increase in tumor burden.
Figure 4:
Figure 4:
Axial chest CT images show pseudoprogression followed by subsequent tumor reduction noted after confirmation of progressive disease on consecutive images obtained over the course of several months in a 63-year-old woman with lung adenocarcinoma treated with nivolumab who experienced pseudoprogression. Comparing subsequent findings to, A, the baseline, the patient experienced tumor burden increase at, B, 1.4 months of therapy, meeting the criteria for progressive disease, which was confirmed on, C, a serial CT scan at 5.0 months of therapy. Subsequently, tumor regression was noted at, D, 8.8 months of therapy. (Reprinted, with permission, from reference 34).
Figure 5:
Figure 5:
Immune-related hypophysitis in a 56-year-old woman with metastatic melanoma receiving ipilimumab and nivolumab and with headaches at presentation. Coronal MR image after 8 weeks of ipilimumab and nivolumab therapy shows an enlarged pituitary gland (*) and infundibular thickening (arrow), representing immune-related hypophysitis. The symptom and findings resolved after corticosteroid therapy.
Figure 6:
Figure 6:
Axial chest CT images show the spectrum of radiographic patterns of immune-checkpoint inhibitor–related pneumonitis, which includes, A, the cryptogenic organizing pneumonia (COP) pattern, B, the nonspecific interstitial pneumonia (NSIP) pattern, C, the hypersensitivity pneumonitis (HP) pattern, and, D, the acute interstitial pneumonia (AIP)/acute respiratory distress syndrome (ARDS) pattern. A, The COP pattern is characterized by multifocal bilateral parenchymal consolidations with peripheral and lower lung distribution, with ground-glass opacities (GGOs) and reticular opacities (arrows). B, The NSIP pattern demonstrates GGOs and reticular opacities predominantly in a peripheral and lower lung distribution (arrows). * = Lung tumor burden. C, The HP pattern demonstrates diffuse GGOs and centrilobular nodularities, with scattered areas of air trapping. D, The AIP/ARDS pattern is characterized by diffuse or multifocal GGOs or consolidations, along with lung volume loss and traction bronchiectasis. (Reprinted, with permission, from reference 66).
Figure 7:
Figure 7:
Axial chest CT scans show programmed cell death protein 1 (PD-1) inhibitor–related pneumonitis in a patient with advanced non–small cell lung cancer treated with nivolumab. A, B, CT scans at 8 weeks of nivolumab therapy show new ground-glass opacities (GGOs), reticular opacities, and consolidation in the lower lobes predominantly on the left, with a peripheral and lower distribution, radiographically representing a cryptogenic organizing pneumonia (COP) pattern (arrows). C, D, On CT scans obtained at 15 weeks of therapy, the findings have substantially increased and involve all lobes, with multifocal areas of GGO, reticular opacities, and consolidation (arrows), as well as centrilobular nodularity and traction bronchiectasis in a predominantly peripheral distribution, demonstrating the overall features of a COP pattern. E, F, Further follow-up CT scans obtained after 4 weeks of prednisone treatment show a marked decrease in the CT findings with residual GGOs, demonstrating a “reversed halo” sign with central GGO surrounded by dense air-space consolidation of a crescentic shape (arrows in F). G, H, CT scans obtained 4 weeks after the completion of prednisone treatment show development of dense consolidations with GGOs and reticular opacities (arrows) in peripheral and multifocal distributions, involving both upper and lower lobes, again demonstrating the COP pattern noted during the first episode of PD-1 pneumonitis. Given the similarity of the radiographic and clinical manifestations to those of the first episode, the patient restarted prednisone for treatment of a “pneumonitis flare.” I, J, Follow-up CT scans obtained 2 weeks after starting the second course of prednisone therapy show decrease of consolidation and GGOs (arrows), indicating improving pneumonitis in response to corticosteroid therapy. (Reprinted, with permission, from reference .).
Figure 8a:
Figure 8a:
Sarcoid-like lymphadenopathy in an asymptomatic 81-year-old man with metastatic melanoma treated with ipilimumab. (Reprinted, with permission, from reference .) (a) Coronal reformatted contrast-enhanced chest CT scan obtained 4.9 months after the initiation of ipilimumab therapy shows new bilateral symmetric mediastinal and hilar lymphadenopathy (arrows) resembling sarcoidosis. (b) Axial CT image of the lungs shows bilateral irregular and nodular parenchymal opacities with upper- and middle-lung predominance (arrows) and peribronchovascular involvement, which falls in the spectrum of lung parenchymal manifestations of pulmonary sarcoidosis.
Figure 8b:
Figure 8b:
Sarcoid-like lymphadenopathy in an asymptomatic 81-year-old man with metastatic melanoma treated with ipilimumab. (Reprinted, with permission, from reference .) (a) Coronal reformatted contrast-enhanced chest CT scan obtained 4.9 months after the initiation of ipilimumab therapy shows new bilateral symmetric mediastinal and hilar lymphadenopathy (arrows) resembling sarcoidosis. (b) Axial CT image of the lungs shows bilateral irregular and nodular parenchymal opacities with upper- and middle-lung predominance (arrows) and peribronchovascular involvement, which falls in the spectrum of lung parenchymal manifestations of pulmonary sarcoidosis.
Figure 9:
Figure 9:
Colitis with a diffuse colitis pattern in a 64-year-old man with advanced melanoma treated with ipilimumab and with diarrhea at presentation. Coronal reformatted contrast-enhanced CT image of the abdomen obtained 2.6 months after the initiation of ipilimumab treatment shows a new finding of a fluid-filled dilated colon (*), with mucosal hyperemia indicating diffuse colitis. Colonoscopic biopsy confirmed colonic inflammation with mucosal injury consistent with ipilimumab-associated colitis. The patient was treated with oral steroids followed by intravenous infliximab, leading to resolution of the findings at the follow-up study performed 1.8 months after onset. (Reprinted, with permission, from reference .).
Figure 10:
Figure 10:
Immune-checkpoint inhibitor-related hepatitis in a patient with metastatic melanoma treated with ipilimumab and with markedly elevated liver function test levels at presentation. Coronal CT scan obtained after 2.7 months of ipilimumab therapy shows new periportal edema (black arrows), new periportal lymphadenopathy (white arrows), and hepatomegaly with trace perihepatic free fluid, demonstrating ipilimumab-related hepatitis.

References

    1. Allison JP, Krummel MF. The yin and yang of T cell costimulation. Science 1995;270(5238):932–933. - PubMed
    1. Hodi FS, Mihm MC, Soiffer RJ, et al. . Biologic activity of cytotoxic T lymphocyte-associated antigen 4 antibody blockade in previously vaccinated metastatic melanoma and ovarian carcinoma patients. Proc Natl Acad Sci U S A 2003;100(8):4712–4717. - PMC - PubMed
    1. Hodi FS, Oble DA, Drappatz J, et al. . CTLA-4 blockade with ipilimumab induces significant clinical benefit in a female with melanoma metastases to the CNS. Nat Clin Pract Oncol 2008;5(9):557–561. - PubMed
    1. Nishino M, Ramaiya NH, Hatabu H, Hodi FS. Monitoring immune-checkpoint blockade: response evaluation and biomarker development. Nat Rev Clin Oncol 2017;14(11):655–668. - PMC - PubMed
    1. Ott PA, Hodi FS, Robert C. CTLA-4 and PD-1/PD-L1 blockade: new immunotherapeutic modalities with durable clinical benefit in melanoma patients. Clin Cancer Res 2013;19(19):5300–5309. - PubMed

Publication types