. 2018 Dec;24(12):2270-2283.
doi: 10.3201/eid2412.171860.

Comparison of 2016-17 and Previous Epizootics of Highly Pathogenic Avian Influenza H5 Guangdong Lineage in Europe

Comparison of 2016-17 and Previous Epizootics of Highly Pathogenic Avian Influenza H5 Guangdong Lineage in Europe

Pablo Alarcon et al. Emerg Infect Dis. 2018 Dec.

Abstract

We analyzed the highly pathogenic avian influenza (HPAI) H5 epizootic of 2016-17 in Europe by epidemiologic and genetic characteristics and compared it with 2 previous epizootics caused by the same H5 Guangdong lineage. The 2016-17 epizootic was the largest in Europe by number of countries and farms affected and greatest diversity of wild birds infected. We observed significant differences among the 3 epizootics regarding region affected, epidemic curve, seasonality, and outbreak duration, making it difficult to predict future HPAI epizootics. However, we know that in 2005-06 and 2016-17 the initial peak of wild bird detections preceded the peak of poultry outbreaks within Europe. Phylogenetic analysis of 2016-17 viruses indicates 2 main pathways into Europe. Our findings highlight the need for global surveillance of viral changes to inform disease preparedness, detection, and control.

Keywords: Europe; H5N8; HPAI; epidemiology; epizootic; genetic analyses; highly pathogenic avian influenza; influenza; zoonoses.


Figures

Figure 1
Figure 1
Morbidity (A) and mortality (B) rates as percentages of populations reported in infected poultry farms during 3 highly pathogenic avian influenza epizootics in Europe, 2005–06, 2014–15, and 2016–17. Years given are epidemiologic years (October through September of the next year). Diamonds with error bars indicate means and 95% CIs. Asterisks indicate farms with unique poultry species used for analysis; dagger indicates large majority of data from backyard farms reported in Romania.
Figure 2
Figure 2
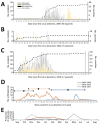
Epidemic curve of 3 HPAI H5 virus epizootics in Europe: A) 2005–06 H5N1; B) 2014–15 H5N8; C) 2016–17 H5N8. Years given are epidemiologic years (October through September of the next year). Dashed lines indicate number of countries reporting an HPAI infection since the beginning of the epizootic; vertical line in panel C indicates data collected through July 31, 2017. D) Weekly average number of poultry outbreaks for each epizootic. Horizontal lines indicate mean the day at which half of the poultry outbreaks have occurred (diamonds); error bars indicate 1 SD. E) Number of poultry outbreaks for each month for the 3 epizootics. HPAI, highly pathogenic avian influenza.
Figure 3
Figure 3
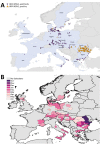
Geographic and temporal spread of the 2005–06 HPAI H5N1 epizootic. A) Location of each incident reported. Blue shading indicates countries where cases were reported. B) Month of first report of an HPAI H5N1 incident. Years given are epidemiologic years (October through September of the next year). HPAI, highly pathogenic avian influenza.
Figure 4
Figure 4
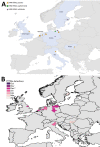
Geographic and temporal spread of the 2014–15 HPAI H5N8 epizootic. A) Location of each incident reported. Blue shading indicates countries where cases were reported. B) Month of first report of an HPAI H5N8 incident. Years given are epidemiologic years (October through September of the next year). HPAI, highly pathogenic avian influenza.
Figure 5
Figure 5
Geographic and temporal spread of the 2016–17 HPAI H5N8 epizootic. A) Location of each incident reported. Blue shading indicates countries where cases were reported. B) Month of first report of an HPAI H5N8 incident. Years given are epidemiologic years (October through September of the next year). HPAI, highly pathogenic avian influenza.
Figure 6
Figure 6
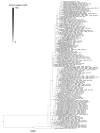
Maximum-likelihood tree from viral sequences of the 2016–17 highly pathogenic avian influenza H5 epizootic in Europe. Circles represent node support values, filled according to approximate likelihood ratio test values 0–100. Light gray boxes indicate distinct clades with support >50 with isolates from Europe; dark gray boxes indicate clades with <50 or unresolved. Scale bar indicates nucleotide substitutions per site. An expanded figure showing trees for all 3 epizootic years is available online (https://wwwnc.cdc.gov/EID/article/24/12/17-1860-F6.htm).

References

    1. Sims LD, Brown IH. Multi-continental panzootic of H5 highly pathogenic avian influenza (1996–2015). In: Swayne DE, editor. Animal influenza, 2nd ed. New York: Wiley & Sons; 2016.
    1. Global Consortium for H5N8 and Related Influenza Viruses. Role for migratory wild birds in the global spread of avian influenza H5N8. Science. 2016;354:213–7. 10.1126/science.aaf8852 - DOI - PMC - PubMed
    1. Hesterberg U, Harris K, Stroud D, Guberti V, Busani L, Pittman M, et al. Avian influenza surveillance in wild birds in the European Union in 2006. Influenza Other Respi Viruses. 2009;3:1–14. 10.1111/j.1750-2659.2008.00058.x - DOI - PMC - PubMed
    1. European Union Reference Laboratory For Avian Influenza. Annual report on surveillance for avian influenza in poultry and in wild birds in member states of the European Union in 2015. 2016. [cited 2018 Sep 28]. https://ec.europa.eu/food/sites/food/files/ad_control-measures_ai_surv-r...
    1. European Union Occupational Health and Safety Information Service. Commission decision 2010/367/EU of 25 June 2010 on the implementation by Member States of surveillance programmes for avian influenza in poultry and wild birds. Official Journal of the European Union. 2010;166:22–32.

Publication types

MeSH terms