. 2019 Feb 1;129(2):616-630.
doi: 10.1172/JCI122216. Epub 2019 Jan 7.

Peptide-based PET quantifies target engagement of PD-L1 therapeutics

Affiliations

Peptide-based PET quantifies target engagement of PD-L1 therapeutics

Dhiraj Kumar et al. J Clin Invest. .

Abstract

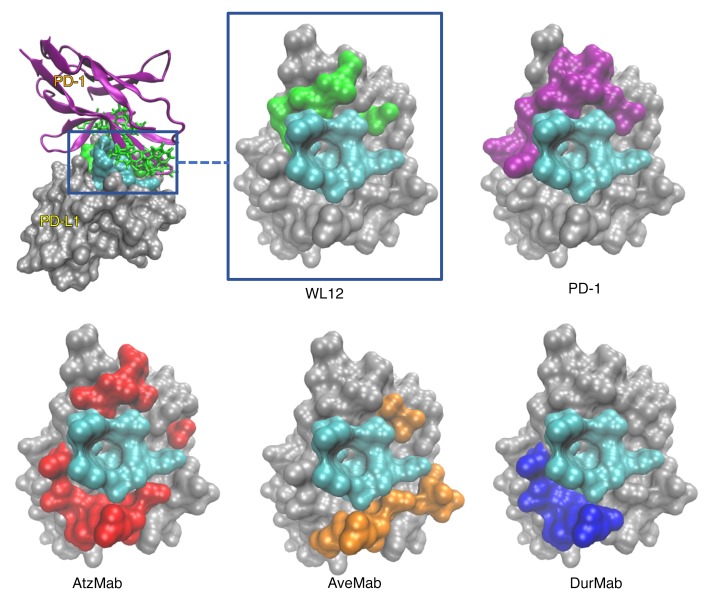
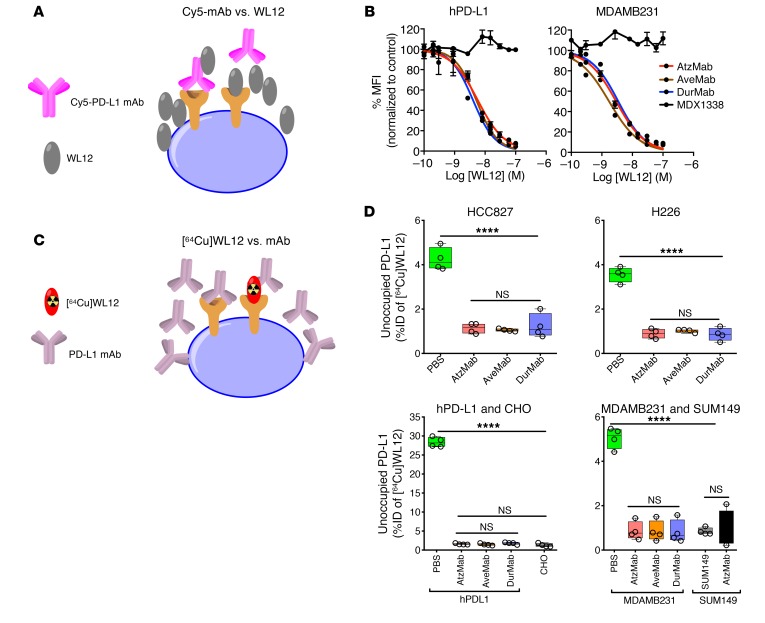
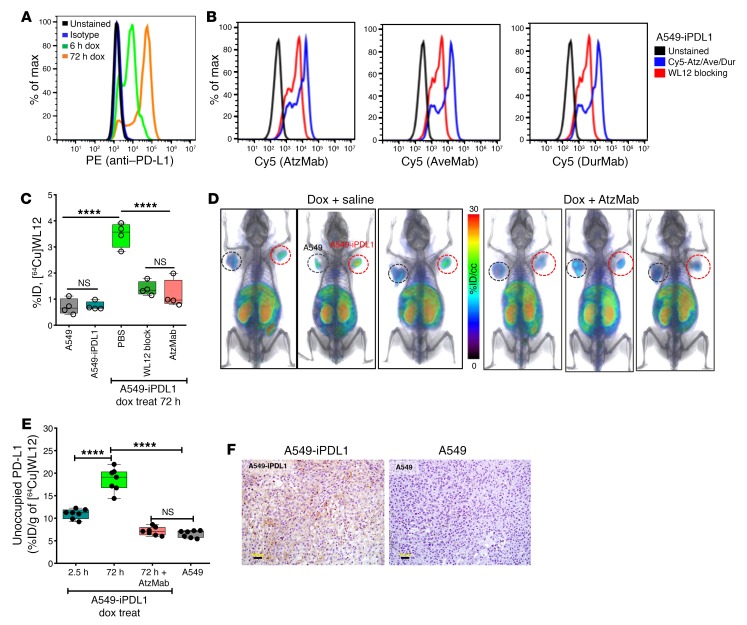
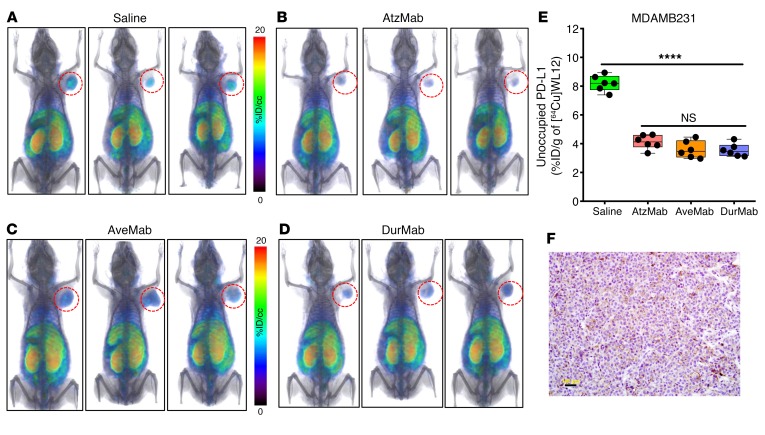
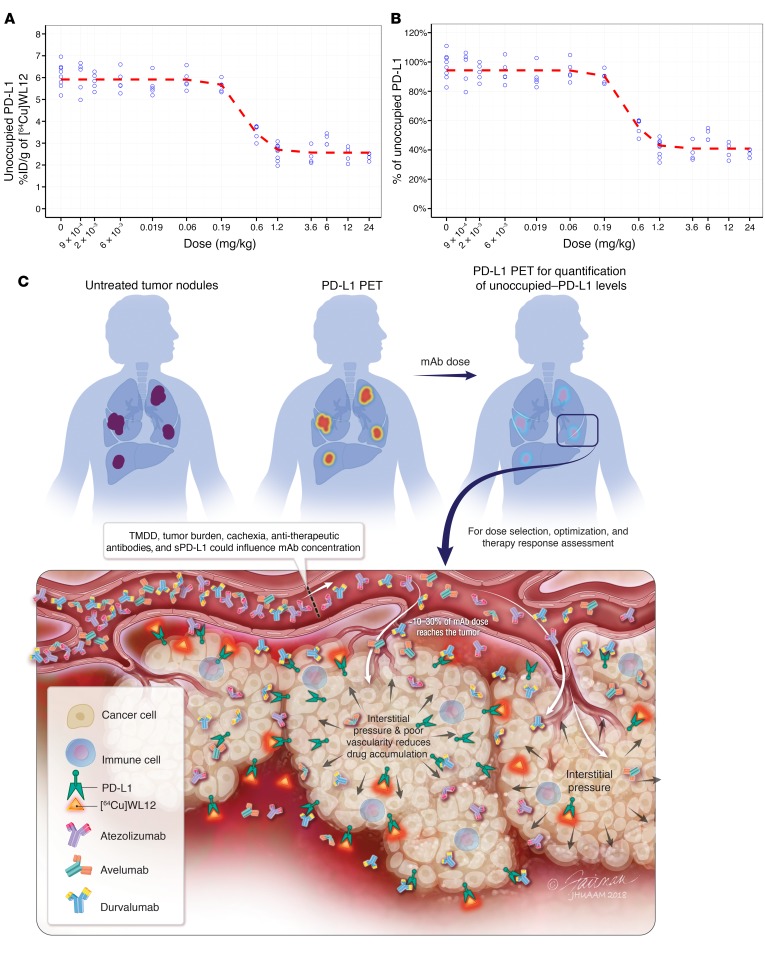
Immune checkpoint therapies have shown tremendous promise in cancer therapy. However, tools to assess their target engagement, and hence the ability to predict their efficacy, have been lacking. Here, we show that target engagement and tumor-residence kinetics of antibody therapeutics targeting programmed death ligand-1 (PD-L1) can be quantified noninvasively. In computational docking studies, we observed that PD-L1-targeted monoclonal antibodies (atezolizumab, avelumab, and durvalumab) and a high-affinity PD-L1-binding peptide, WL12, have common interaction sites on PD-L1. Using the peptide radiotracer [64Cu]WL12 in vivo, we employed positron emission tomography (PET) imaging and biodistribution studies in multiple xenograft models and demonstrated that variable PD-L1 expression and its saturation by atezolizumab, avelumab, and durvalumab can be quantified independently of biophysical properties and pharmacokinetics of antibodies. Next, we used [64Cu]WL12 to evaluate the impact of time and dose on the unoccupied fraction of tumor PD-L1 during treatment. These quantitative measures enabled, by mathematical modeling, prediction of antibody doses needed to achieve therapeutically effective occupancy (defined as >90%). Thus, we show that peptide-based PET is a promising tool for optimizing dose and therapeutic regimens employing PD-L1 checkpoint antibodies, and can be used for improving therapeutic efficacy.

Keywords: Cancer immunotherapy; Diagnostic imaging; Oncology; Pharmacology; Therapeutics.


Conflict of interest statement

Conflict of interest: DK, SC, WGL, MGP, and SN are co-inventors on a pending US patent (PCT/US2017/068025) covering [64Cu]WL12 and as such are entitled to a portion of any licensing fees and royalties generated by this technology. This arrangement has been reviewed and approved by Johns Hopkins University in accordance with its conflict-of-interest policies. DK, SC, WGL, SN, JTP, CMR, and MGP are inventors on patent applications not related to this work. CMR serves on the Scientific Advisory Board of Harpoon Therapeutics, and has consulted on oncology drug development for AbbVie, Amgen, Ascentage, BMS, Celgene, Daiichi Sankyo, Genentech, Loxo, and Pharmamar. Under a licensing agreement between EMJ, Aduro Biotech Inc., and Johns Hopkins University, the University is entitled to milestone payments and royalties on sales of certain cancer vaccine products. EMJ serves on the Scientific Advisory Board of Genocea, Adaptive Biotech, DragonFly, and CSTONE and received grants from Aduro Biotech, Amgen, BMS, Hertix, and Corvus.

Figures

Figure 1
Figure 1. WL12 binding interface on PD-L1 overlaps with PD-1 and PD-L1 therapeutics.
(A) WL12 binding mode to PD-L1 (green and cyan) overlaps those of PD-1 (purple and cyan), AtzMab (red and cyan), AveMab (orange and cyan), and DurMab (blue and cyan). Noninteracting residues are shown in gray. The variety of contacts encompassing the shared binding region (cyan) illustrate the diverse binding mechanisms of different therapeutic antibodies.
Figure 2
Figure 2. WL12 inhibits interaction between PD-1 and PD-L1 therapeutics in vitro.
(A) Schematic representation of the assay. (B) WL12 inhibits Cy5-conjugated AtzMab, AveMab, and DurMab binding to PD-L1, as demonstrated through competitive inhibition and corresponding IC50 values. Mean fluorescence intensities (MFIs) were determined by flow cytometry. (C) Schematic representation of the assay. (D) [64Cu]WL12 binding to PD-L1–positive HCC827, H226, hPD-L1, and MDAMB231 cells is inhibited in the presence of 60 nM AtzMab, AveMab, and DurMab, compared with PBS control. [64Cu]WL12 binding in PD-L1–negative CHO and SUM149 cells is also shown. ****P < 0.0001; NS, not significant, by 1-way ANOVA and Dunnett’s multiple comparisons test in D.
Figure 3
Figure 3. PD-L1 engagement by anti–PD-L1 mAbs is quantified at the tumor using [64Cu]WL12 in xenografts with variable PD-L1 expression.
(AH) Reduced uptake of [64Cu]WL12 in H226 (A and B), HCC827 (C and D), and contralateral hPD-L1 and PD-L1–negative CHO (hPD-L1/CHO) (G and H) xenografts in mice treated with 20 mg/kg AtzMab 24 hours prior to radiotracer injection, compared with saline-treated controls. Whole-body, volume-rendered [64Cu]WL12 PET-CT images (A, D, and G) and ex vivo biodistribution (B, E, and H) at 2 hours after [64Cu]WL12 injection (n = 8–12/group). (C, F, and I) IHC staining for PD-L1 is shown from the corresponding tumor. Scale bars: 100 μm. Box-and-whisker graphs showing minimum to maximum and all data points, with the horizontal line representing the median. ****P < 0.0001; ***P < 0.001; NS, not significant, by unpaired Student’s t test in B, E, and H.
Figure 4
Figure 4. Dynamic changes in tumor PD-L1 expression and its engagement by AtzMab detected using [64Cu]WL12.
(A) Flow cytometry histogram showing increased PD-L1 cell surface expression in A549-iPDL1 cells treated with doxycycline for 6 hours and 72 hours. (B) WL12 inhibits (5 nM) binding of Cy5-conjugated AtzMab, AveMab, and DurMab (2 nM) to A549-iPDL1 cells treated with doxycycline for 72 hours. (C) [64Cu]WL12 binding to A549-iPDL1 cells (72-hour doxycycline) is significantly reduced in the presence of 60 nM AtzMab, compared with controls. (D and E) [64Cu]WL12 uptake in A549-iPDL1 xenografts is significantly lower in mice receiving intravenous AtzMab 24 hours prior to radiotracer injection, compared with saline controls and similar to parent A549 xenografts. Volume-rendered whole-body PET-CT images (D), and ex vivo quantification (E) at 2 hours after [64Cu]WL12 injection (n = 10/group). (F) IHC staining for PD-L1 of the corresponding tumors. Scale bars: 100 μm. Box-and-whisker graphs showing minimum to maximum and all data points, with the horizontal line representing the median. ****P < 0.0001; NS, not significant, by 1-way ANOVA and Sidak’s multiple comparisons test in C and E.
Figure 5
Figure 5. Tumor PD-L1 engagement by 3 distinct PD-L1 therapeutic antibodies quantified using [64Cu]WL12.
(AE) [64Cu]WL12 uptake in MDAMB231 xenografts is significantly reduced in mice receiving AtzMab (20 mg/kg), AveMab (10 mg/kg), or DurMab (10 mg/kg), 24 hours prior to radiotracer injection. Whole-body volume-rendered [64Cu]WL12 PET-CT images of saline- (A), AtzMab- (B), AveMab- (C), and DurMab-treated (D) mice, and ex vivo biodistribution (E) at 2 hours after [64Cu]WL12 injection (n = 6–9/group). (F) IHC staining for PD-L1 in the corresponding tumor. Scale bars: 100 μm. Box-and-whisker graphs showing minimum to maximum and all data points, with the horizontal line representing the median. ****P < 0.0001; NS, not significant, by 1-way ANOVA and Dunnett’s multiple comparisons test in E.
Figure 6
Figure 6. Effect of dose and time on the unoccupied fraction of tumor PD-L1 following treatment with AtzMab quantified using [64Cu]WL12.
(A and B) Dose-exposure relationship depicting the decrease in unoccupied PD-L1, in MDAMB231 tumors in mice, with increase in AtzMab dose (mg/kg). (A) Whole-body [64Cu]WL12 PET-CT images of MDAMB231 tumor–bearing mice receiving 0.06, 0.6, and 3.2 mg/kg AtzMab. (B) Ex vivo quantification of [64Cu]WL12 uptake in tumors of mice treated with escalating doses of AtzMab (0.06, 0.6, and 10 mg/kg). AtzMab was injected 24 hours prior to radiotracer injection. (C and D) AtzMab dose effect on tumor PD-L1 occupancy over time depicting an increase in unoccupied PD-L1 with 0.6 or 1 mg/kg dose of AtzMab, but not with 10 or 20 mg/kg AtzMab dose, recapitulating the nonlinear kinetics of mAb. Whole-body volume-rendered [64Cu]WL12 PET-CT images (C) and ex vivo biodistribution (D) at 2 hours after [64Cu]WL12 injection (n = 6–9/group). Box-and-whisker graphs showing minimum to maximum and all data points, with the horizontal line representing the median. *P < 0.05, ****P < 0.0001; NS, not significant, by unpaired Student’s t test in D.
Figure 7
Figure 7. Effect of dose and time on tumor PD-L1 occupancy by AtzMab quantified using [64Cu]WL12.
(A and B) Dose-exposure relationship depicting the decrease in unoccupied PD-L1, in MDAMB231 tumors in mice, with increase in AtzMab dose (mg/kg). Ex vivo quantification of [64Cu]WL12 uptake at 2 hours in tumors of mice treated with escalating doses of AtzMab (0.0009 to 24 mg/kg) (n = 3–9/group). AtzMab was injected 24 hours prior to radiotracer injection (A). Percentage of unoccupied PD-L1 was calculated relative to the median unoccupied PD-L1 measured at 0 mg/kg (B). Blue open dots: measured unoccupied PD-L1 for each dose level in mice. Red dashed line: mean model-predicted dose-response relationship. (C) Schematic of PD-L1 PET for PD-L1 therapeutic development and evaluation. sPD-L1, soluble PD-L1; TMDD, target-mediated drug disposition.

References

    1. Arrowsmith J. Trial watch: Phase II failures: 2008-2010. Nat Rev Drug Discov. 2011;10(5):328–329. - PubMed
    1. Arrowsmith J, Miller P. Trial watch: phase II and phase III attrition rates 2011-2012. Nat Rev Drug Discov. 2013;12(8):569. doi: 10.1038/nrd4090. - DOI - PubMed
    1. Morgan P, et al. Can the flow of medicines be improved? Fundamental pharmacokinetic and pharmacological principles toward improving Phase II survival. Drug Discov Today. 2012;17(9–10):419–424. - PubMed
    1. Jesudason CD, DuBois S, Johnson M, Barth VN, Need AB. In vivo receptor occupancy in rodents by LC-MS/MS. In: Sittampalam GS, et al, eds. Assay Guidance Manual. Bethesda,MD: Eli Lilly & Company and the National Center for Advancing Translational Sciences; 2004. - PubMed
    1. Martinez Molina D, et al. Monitoring drug target engagement in cells and tissues using the cellular thermal shift assay. Science. 2013;341(6141):84–87. doi: 10.1126/science.1233606. - DOI - PubMed

Publication types

MeSH terms