

Deep learning for chest radiograph diagnosis: A retrospective comparison of the CheXNeXt algorithm to practicing radiologists
- PMID: 30457988
- PMCID: PMC6245676
- DOI: 10.1371/journal.pmed.1002686
Deep learning for chest radiograph diagnosis: A retrospective comparison of the CheXNeXt algorithm to practicing radiologists
Abstract
Background: Chest radiograph interpretation is critical for the detection of thoracic diseases, including tuberculosis and lung cancer, which affect millions of people worldwide each year. This time-consuming task typically requires expert radiologists to read the images, leading to fatigue-based diagnostic error and lack of diagnostic expertise in areas of the world where radiologists are not available. Recently, deep learning approaches have been able to achieve expert-level performance in medical image interpretation tasks, powered by large network architectures and fueled by the emergence of large labeled datasets. The purpose of this study is to investigate the performance of a deep learning algorithm on the detection of pathologies in chest radiographs compared with practicing radiologists.
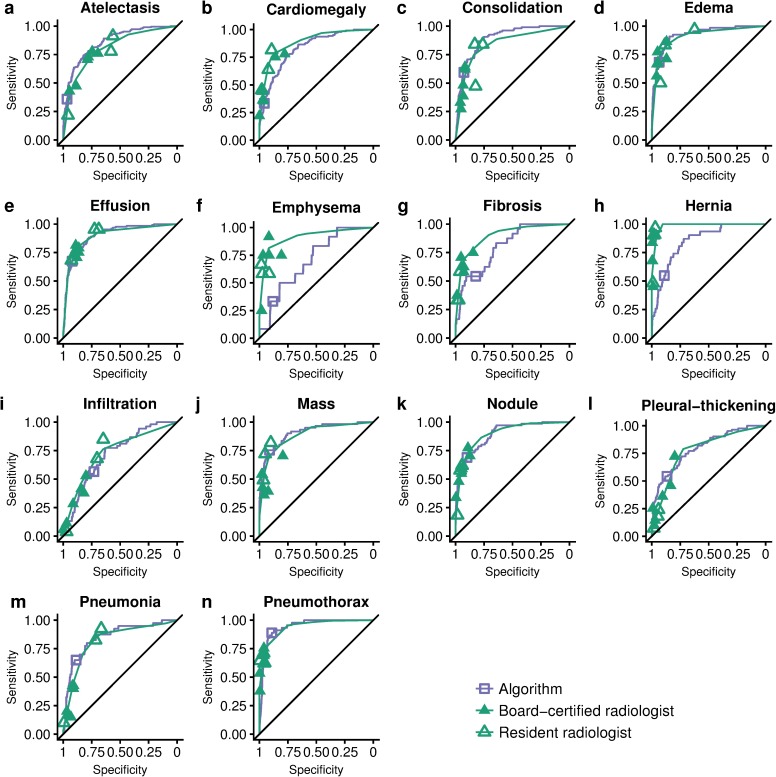
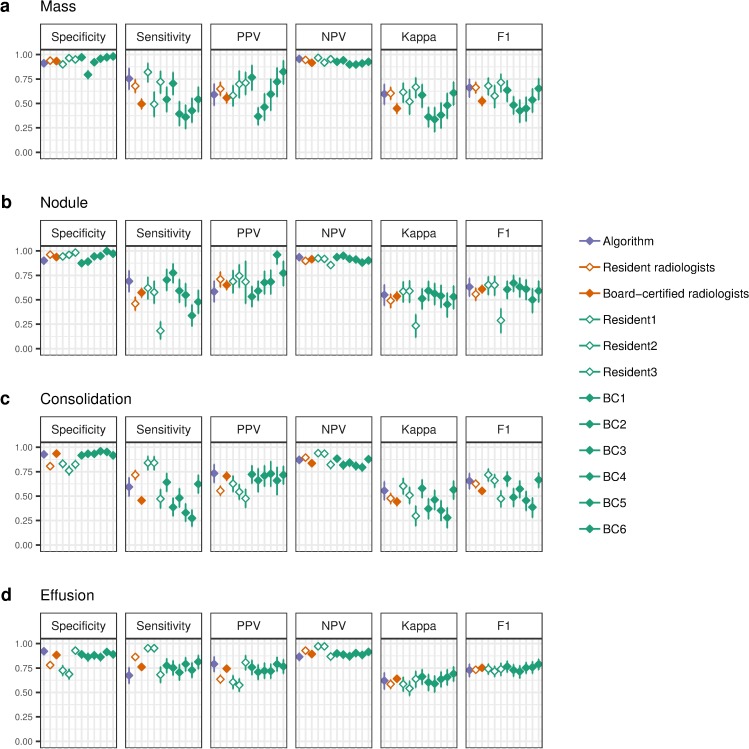
Methods and findings: We developed CheXNeXt, a convolutional neural network to concurrently detect the presence of 14 different pathologies, including pneumonia, pleural effusion, pulmonary masses, and nodules in frontal-view chest radiographs. CheXNeXt was trained and internally validated on the ChestX-ray8 dataset, with a held-out validation set consisting of 420 images, sampled to contain at least 50 cases of each of the original pathology labels. On this validation set, the majority vote of a panel of 3 board-certified cardiothoracic specialist radiologists served as reference standard. We compared CheXNeXt's discriminative performance on the validation set to the performance of 9 radiologists using the area under the receiver operating characteristic curve (AUC). The radiologists included 6 board-certified radiologists (average experience 12 years, range 4-28 years) and 3 senior radiology residents, from 3 academic institutions. We found that CheXNeXt achieved radiologist-level performance on 11 pathologies and did not achieve radiologist-level performance on 3 pathologies. The radiologists achieved statistically significantly higher AUC performance on cardiomegaly, emphysema, and hiatal hernia, with AUCs of 0.888 (95% confidence interval [CI] 0.863-0.910), 0.911 (95% CI 0.866-0.947), and 0.985 (95% CI 0.974-0.991), respectively, whereas CheXNeXt's AUCs were 0.831 (95% CI 0.790-0.870), 0.704 (95% CI 0.567-0.833), and 0.851 (95% CI 0.785-0.909), respectively. CheXNeXt performed better than radiologists in detecting atelectasis, with an AUC of 0.862 (95% CI 0.825-0.895), statistically significantly higher than radiologists' AUC of 0.808 (95% CI 0.777-0.838); there were no statistically significant differences in AUCs for the other 10 pathologies. The average time to interpret the 420 images in the validation set was substantially longer for the radiologists (240 minutes) than for CheXNeXt (1.5 minutes). The main limitations of our study are that neither CheXNeXt nor the radiologists were permitted to use patient history or review prior examinations and that evaluation was limited to a dataset from a single institution.
Conclusions: In this study, we developed and validated a deep learning algorithm that classified clinically important abnormalities in chest radiographs at a performance level comparable to practicing radiologists. Once tested prospectively in clinical settings, the algorithm could have the potential to expand patient access to chest radiograph diagnostics.
Conflict of interest statement
I have read the journal's policy and the authors of this manuscript have the following competing interests: CPL holds shares in whiterabbit.ai and Nines.ai, is on the Advisory Board of Nuance Communications and on the Board of Directors for the Radiological Society of North America, and has other research support from Philips, GE Healthcare, and Philips Healthcare. MPL holds shares in and serves on the Advisory Board for Nines.ai. None of these organizations have a financial interest in the results of this study.
Figures
References
-
- Raoof S, Feigin D, Sung A, Raoof S, Irugulpati L, Rosenow EC. Interpretation of plain chest roentgenogram. Chest. 2012. February;141(2):545–58. 10.1378/chest.10-1302 - DOI - PubMed
-
- Mathers CD, Loncar D. Projections of Global Mortality and Burden of Disease from 2002 to 2030. PLOS Med. 2006. November 28;3(11):e442 10.1371/journal.pmed.0030442 - DOI - PMC - PubMed
-
- Gulshan V, Peng L, Coram M, C. Stumpe M, Wu D, Narayanaswamy A, et al. Development and Validation of a Deep Learning Algorithm for Detection of Diabetic Retinopathy in Retinal Fundus Photographs. JAMA. 2016. November 29;316. - PubMed
-
- Esteva A, Kuprel B, Novoa RA, Ko J, Swetter SM, Blau HM, et al. Dermatologist-level classification of skin cancer with deep neural networks. Nature. 2017. February;542(7639):115–8. 10.1038/nature21056 - DOI - PMC - PubMed
-
- Ehteshami Bejnordi B, Veta M, Johannes van Diest P, van Ginneken B, Karssemeijer N, Litjens G, et al. Diagnostic Assessment of Deep Learning Algorithms for Detection of Lymph Node Metastases in Women With Breast Cancer. JAMA. 2017. 12;318(22):2199–210. 10.1001/jama.2017.14585 - DOI - PMC - PubMed
Publication types
MeSH terms
Grants and funding
LinkOut - more resources
Full Text Sources
Other Literature Sources
Medical
