

Predicting the risk of emergency admission with machine learning: Development and validation using linked electronic health records
- PMID: 30458006
- PMCID: PMC6245681
- DOI: 10.1371/journal.pmed.1002695
Predicting the risk of emergency admission with machine learning: Development and validation using linked electronic health records
Abstract
Background: Emergency admissions are a major source of healthcare spending. We aimed to derive, validate, and compare conventional and machine learning models for prediction of the first emergency admission. Machine learning methods are capable of capturing complex interactions that are likely to be present when predicting less specific outcomes, such as this one.
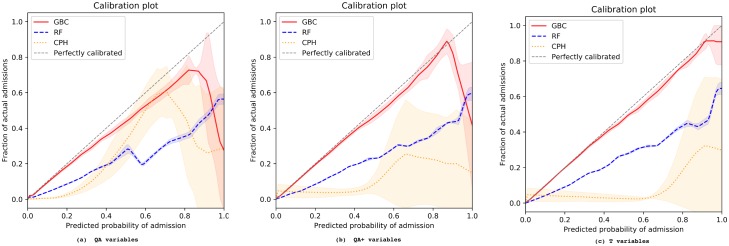
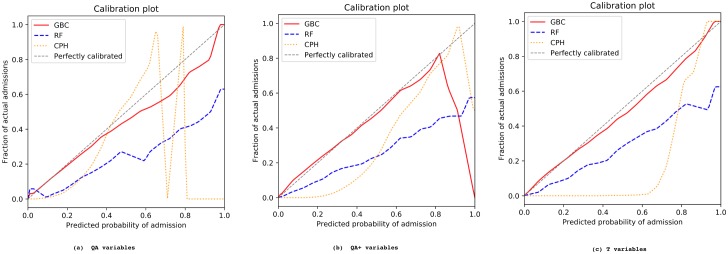
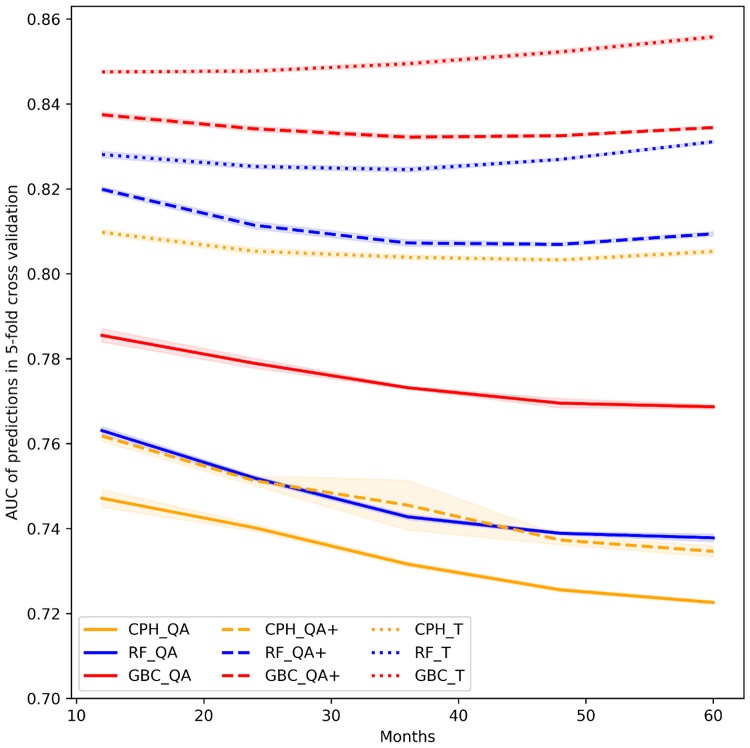
Methods and findings: We used longitudinal data from linked electronic health records of 4.6 million patients aged 18-100 years from 389 practices across England between 1985 to 2015. The population was divided into a derivation cohort (80%, 3.75 million patients from 300 general practices) and a validation cohort (20%, 0.88 million patients from 89 general practices) from geographically distinct regions with different risk levels. We first replicated a previously reported Cox proportional hazards (CPH) model for prediction of the risk of the first emergency admission up to 24 months after baseline. This reference model was then compared with 2 machine learning models, random forest (RF) and gradient boosting classifier (GBC). The initial set of predictors for all models included 43 variables, including patient demographics, lifestyle factors, laboratory tests, currently prescribed medications, selected morbidities, and previous emergency admissions. We then added 13 more variables (marital status, prior general practice visits, and 11 additional morbidities), and also enriched all variables by incorporating temporal information whenever possible (e.g., time since first diagnosis). We also varied the prediction windows to 12, 36, 48, and 60 months after baseline and compared model performances. For internal validation, we used 5-fold cross-validation. When the initial set of variables was used, GBC outperformed RF and CPH, with an area under the receiver operating characteristic curve (AUC) of 0.779 (95% CI 0.777, 0.781), compared to 0.752 (95% CI 0.751, 0.753) and 0.740 (95% CI 0.739, 0.741), respectively. In external validation, we observed an AUC of 0.796, 0.736, and 0.736 for GBC, RF, and CPH, respectively. The addition of temporal information improved AUC across all models. In internal validation, the AUC rose to 0.848 (95% CI 0.847, 0.849), 0.825 (95% CI 0.824, 0.826), and 0.805 (95% CI 0.804, 0.806) for GBC, RF, and CPH, respectively, while the AUC in external validation rose to 0.826, 0.810, and 0.788, respectively. This enhancement also resulted in robust predictions for longer time horizons, with AUC values remaining at similar levels across all models. Overall, compared to the baseline reference CPH model, the final GBC model showed a 10.8% higher AUC (0.848 compared to 0.740) for prediction of risk of emergency admission within 24 months. GBC also showed the best calibration throughout the risk spectrum. Despite the wide range of variables included in models, our study was still limited by the number of variables included; inclusion of more variables could have further improved model performances.
Conclusions: The use of machine learning and addition of temporal information led to substantially improved discrimination and calibration for predicting the risk of emergency admission. Model performance remained stable across a range of prediction time windows and when externally validated. These findings support the potential of incorporating machine learning models into electronic health records to inform care and service planning.
Conflict of interest statement
I have read the journal’s policy and the authors of this manuscript have the following competing interests: JT receives funding for DPhil provided by Rhodes Trust and Clarendon Fund, is Chair on board of CHASE (incorporated association), travel grant from European Society of Hypertension, British Research Council training grant, Special Consultant for Bendelta. KR receives a stipend as a specialty consulting editor for PLOS Medicine and serves on the journal’s editorial board.
Figures
References
-
- Aramide G, Shona K, Keith B, Teresa B. Identify the risk to hospital admission in UK—systematic review of literature. Life (Jaipur). 2016;2(2):20–34.
-
- Kansagara D, Englander H, Salanitro A, Kagen D, Theobald C, Freeman M, et al. Risk prediction models for hospital readmission: a systematic review. JAMA. 2011;306(15):1688–98. 10.1001/jama.2011.1515 - DOI - PMC - PubMed
-
- NHS England. A&E attendances and emergency admissions 2017–18. London: NHS England; 2018 [cited 2018 Jan 12]. https://www.england.nhs.uk/statistics/statistical-work-areas/ae-waiting-....
-
- Lyon D, Lancaster GA, Taylor S, Dowrick C, Chellaswamy H. Predicting the likelihood of emergency admission to hospital of older people: development and validation of the Emergency Admission Risk Likelihood Index (EARLI). Fam Pract. 2007;24(2):158–67. 10.1093/fampra/cml069 - DOI - PubMed
-
- Bottle A. Identifying patients at high risk of emergency hospital admissions: a logistic regression analysis. J R Soc Med. 2006;99(8):406–14. 10.1258/jrsm.99.8.406 - DOI - PMC - PubMed
Publication types
MeSH terms
LinkOut - more resources
Full Text Sources
Other Literature Sources
Medical
Research Materials
