. 2018 Nov 19;47(4):409-424.e9.
doi: 10.1016/j.devcel.2018.10.026.

Oxidative Stress in Cells with Extra Centrosomes Drives Non-Cell-Autonomous Invasion

Affiliations

Oxidative Stress in Cells with Extra Centrosomes Drives Non-Cell-Autonomous Invasion

Teresa Arnandis et al. Dev Cell. .

Abstract

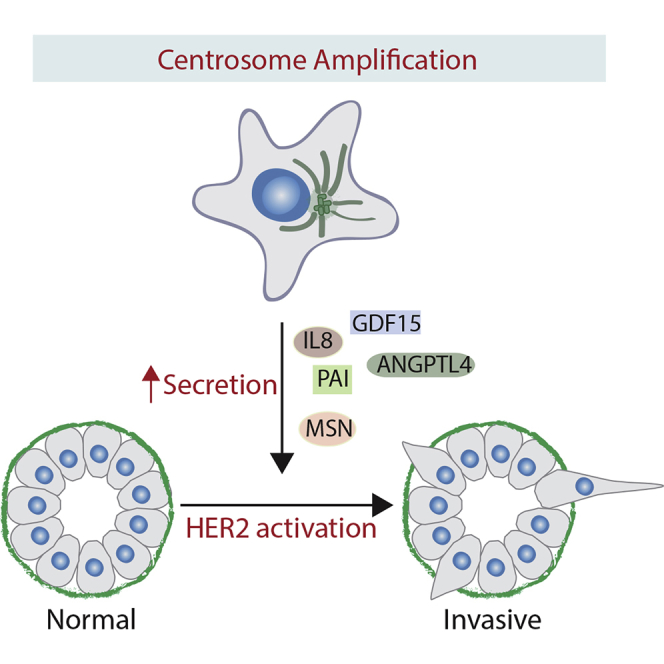
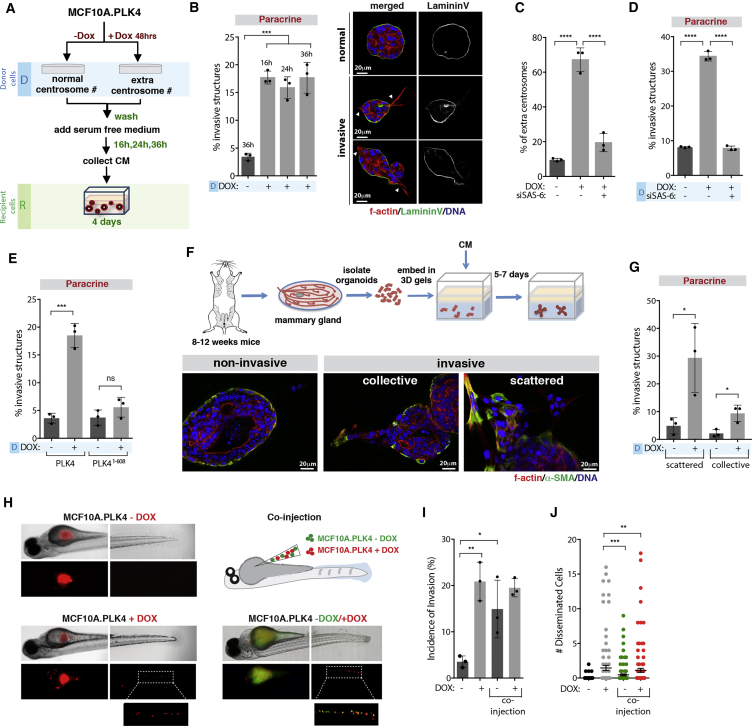
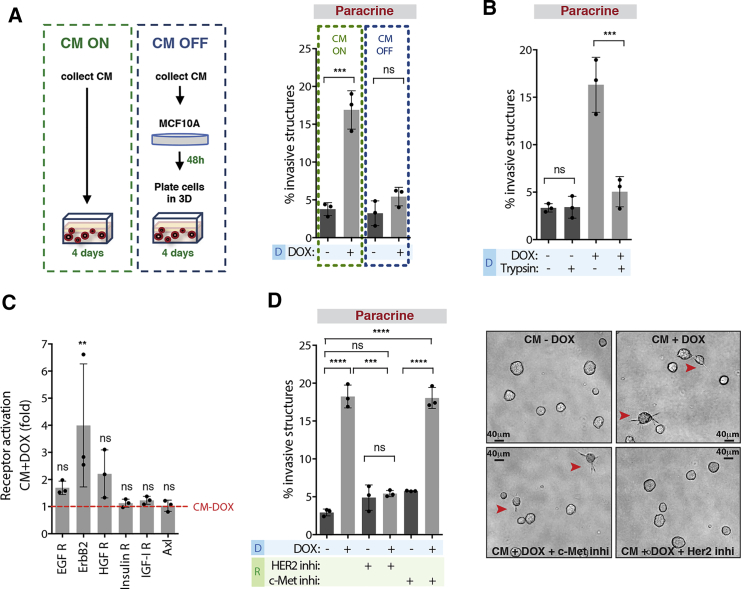
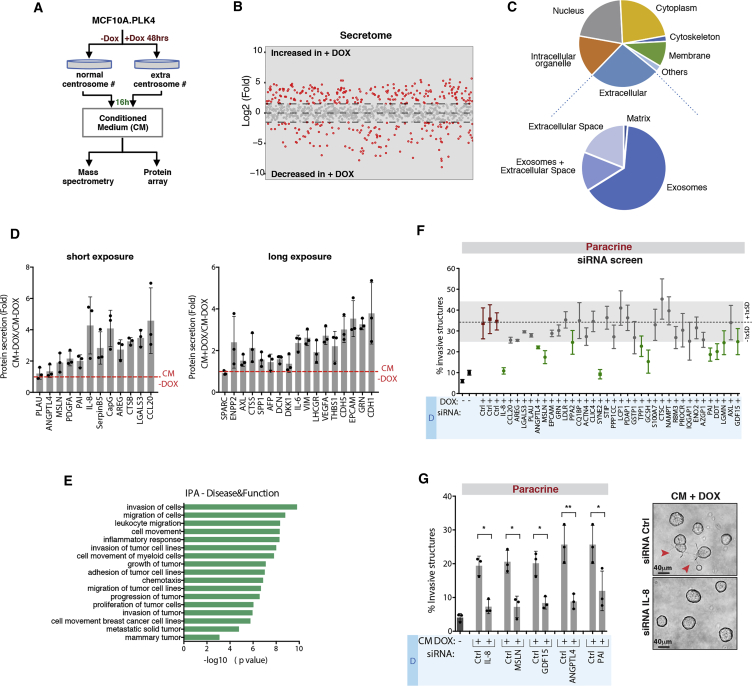
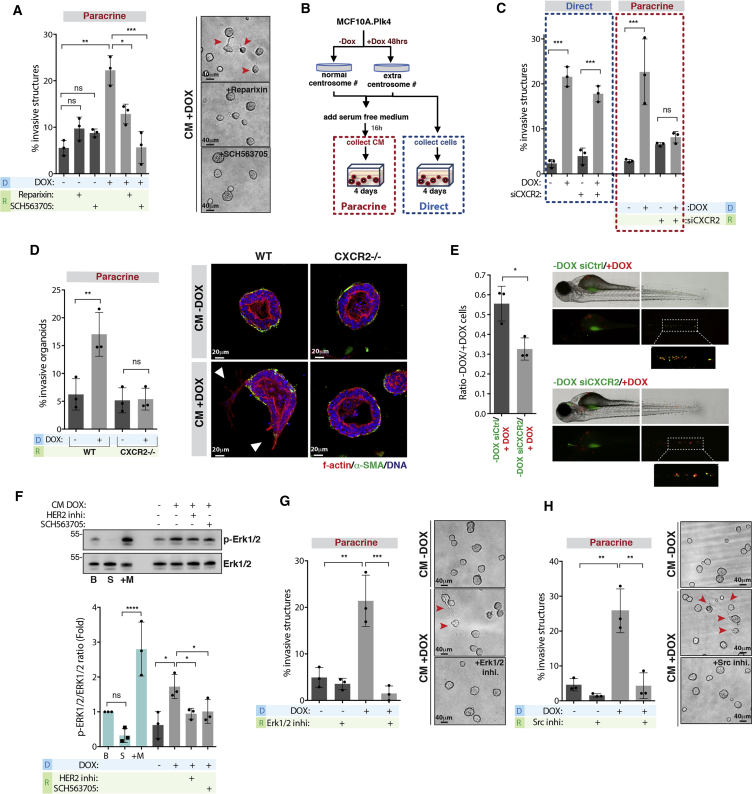
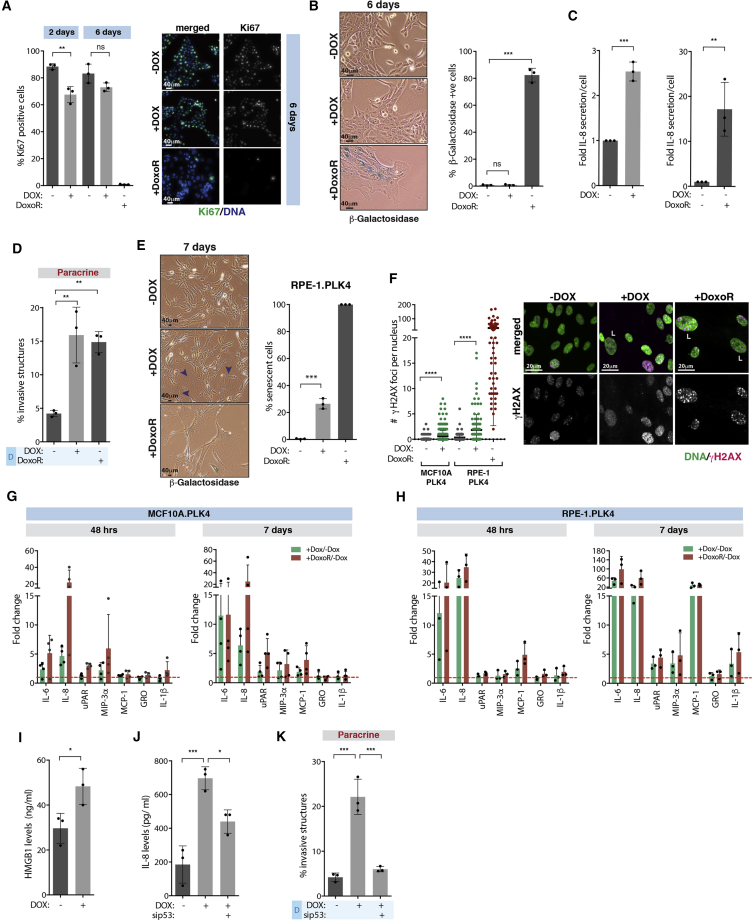
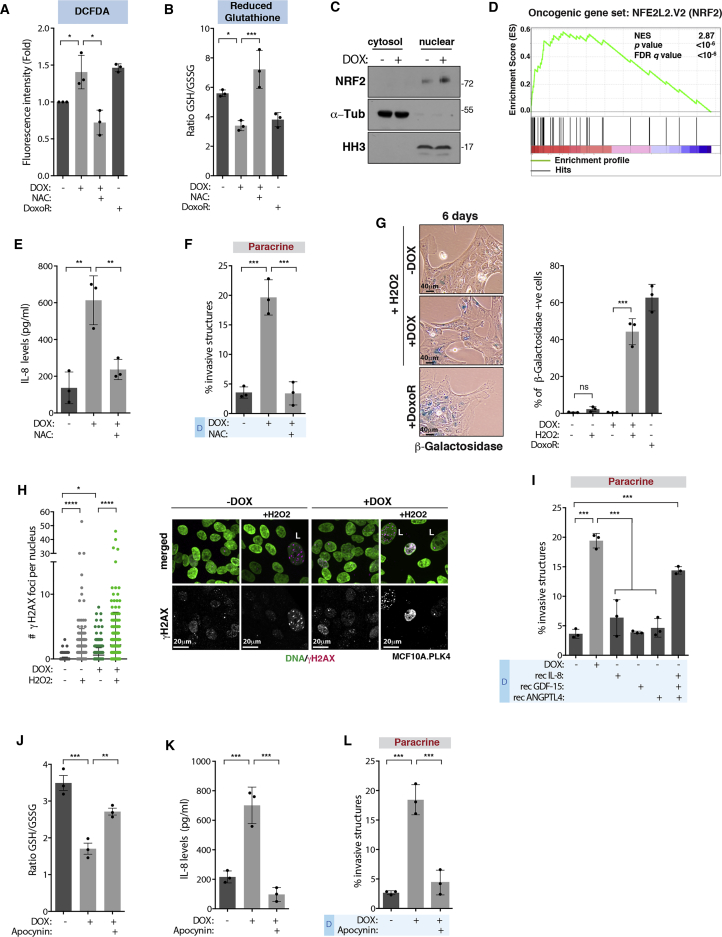
Centrosomal abnormalities, in particular centrosome amplification, are recurrent features of human tumors. Enforced centrosome amplification in vivo plays a role in tumor initiation and progression. However, centrosome amplification occurs only in a subset of cancer cells, and thus, partly due to this heterogeneity, the contribution of centrosome amplification to tumors is unknown. Here, we show that supernumerary centrosomes induce a paracrine-signaling axis via the secretion of proteins, including interleukin-8 (IL-8), which leads to non-cell-autonomous invasion in 3D mammary organoids and zebrafish models. This extra centrosomes-associated secretory phenotype (ECASP) promotes invasion of human mammary cells via HER2 signaling activation. Further, we demonstrate that centrosome amplification induces an early oxidative stress response via increased NOX-generated reactive oxygen species (ROS), which in turn mediates secretion of pro-invasive factors. The discovery that cells with extra centrosomes can manipulate the surrounding cells highlights unexpected and far-reaching consequences of these abnormalities in cancer.

Keywords: HER2; IL-8; ROS; cancer; centrosome amplification; invasion; paracrine signaling; secretion; senescence.


Figures

None
Graphical abstract
Figure 1
Figure 1
Centrosome Amplification Induces Paracrine Invasion (A) Experimental flowchart. (B) Left, quantification of invasive structures. Right, normal and invasive 3D acini. White arrowheads indicate invasive protrusions. Scale bar: 20 μM. (C) Quantification of centrosome amplification. (D) Quantification of invasive structures. (E) Quantification of invasive structures. (F) Top, schematic representation of mammary organoids isolation and growth. Bottom, non-invasive and invasive mammary organoids. Scale bar: 20 μM. (G) Quantification of invasive organoids. (H) Images of zebrafish injected with cells with (+DOX) or without (−DOX) extra centrosomes (left) or co-injected +DOX/−DOX (right). (I) Incidence of invasive cells in zebrafish embryos. Number of injected fish −DOX = 121; +DOX = 103; and co-injection +/−DOX = 116. (J) Number of disseminated cells in the zebrafish tail. Error bars represent mean ± SEM. For all graphics, error bars represent mean ± SD from three independent experiments. p < 0.05, ∗∗p < 0.01, ∗∗∗p < 0.001, ∗∗∗∗p < 0.0001; ns not significant. See also Figure S1; Videos S1, S2, S3, and S4; Table S1.
Figure 2
Figure 2
Induction of Paracrine Invasion Is Mediated by RTK Signaling (A) Left, schematic representation of the different CM treatments. Right, quantification of invasive structures. (B) Quantification of invasive structures. (C) Fold increase in RTK phosphorylation in MCF10A cells after incubation with CM+DOX. (D) Left, quantification of invasive structures with or without HER2 (Trastuzumab, 40 μg/mL) and c-Met (PHA-66752, 1 μM) inhibitors. Right, acinar structures. Red arrowheads indicate invasive acini. Scale bar: 40 μM. For all graphics, error bars represent mean ± SD from three independent experiments. ∗∗p < 0.01, ∗∗∗p < 0.001, ∗∗∗∗p < 0.0001; ns not significant. See also Figure S2.
Figure 3
Figure 3
Secretome Analysis Reveals Differential Protein Secretion in Cells with Amplified Centrosomes (A) Experimental flowchart. (B) Log2-fold changes in protein abundance in the CM of cells with extra centrosomes (+DOX). Red circles indicate changes >1.5-fold difference. (C) Pie charts represent the cellular localization of the proteins increased in CM+DOX. See STAR Methods for details. (D) Fold change of secreted proteins in CM+DOX using protein array. (E) IPA classification of the extracellular secreted proteins identified by mass spectrometry and protein arrays. (F) Quantification of invasive structures after siRNA depletion. (G) Left, validation of specific positive hits identified in (F). Right, acinar structures. Red arrowheads indicate invasive acini. For all graphics, error bars represent mean ± SD from three independent experiments. p < 0.05, ∗∗p < 0.01. Scale bar: 40 μM. See also Figure S3 and Table S1.
Figure 4
Figure 4
Secreted IL-8 Is Crucial for Paracrine Invasion through Her2 Activation (A) Left, quantification of invasive structures with and without the CXCR1/2 inhibitors Reparixin (100 nM) and SCH563705 (100 nM). Right, acinar structures. Red arrowheads indicate invasive acini. Scale bar: 40 μM. (B) Experimental flowchart. (C) Quantification of invasive structures upon CXCR2 depletion in cells with extra centrosomes (direct) or incubated with CM+DOX (paracrine). (D) Left, quantification of invasive mammary organoids from WT or CXCR2−/− mice. Right, non-invasive and invasive mammary organoids. Scale bar: 20 μM. (E) Left, ratio of disseminated cells in co-injection experiments. Right, zebrafish embryos co-injected with cells with (+DOX, red) and without centrosome amplification (−DOX, green). Number of injected fish co-injection control siRNA = 71; co-injection CXCR2 siRNA = 121. (F) Top, levels of p-Erk1/2 and total Erk1/2 in cells. Bottom, ratio of phospho/total Erk1/2. B, basal conditions; S, serum starved cells; +M, serum starved cells after incubation with fresh medium. (G) Left, quantification of invasive structures with or without Erk1/2 inhibitor (PD98059, 20 μM). Right, acinar structures. Red arrowheads indicate invasive acini. Scale bar: 40 μM. (H) Left, quantification of invasive structures with and without Src inhibitor (PP2, 5 μM). Right, acinar structures. Red arrowheads indicate invasive acini. Scale bar: 40 μM. For all graphics, error bars represent mean ± SD from three independent experiments. p < 0.05, ∗∗p < 0.01, ∗∗∗p < 0.001; ns not significant. See also Figure S4.
Figure 5
Figure 5
Centrosome Amplification Induces an Early Stress Response that Leads to Altered Secretion (A) Left, quantification of Ki67 positive cells. Right, cells stained for Ki67. Scale bar: 40 μM. (B) Left, cells stained for β-galactosidase (blue). Right, quantification of β-galactosidase positive cells after 6 days. Scale bar: 40 μM. (C) Relative IL-8 secretion (fold, ng/cell) in cells with extra centrosomes (Left) or treated with DoxoR (Right). (D) Quantification of invasive structures. (E) Left, cells stained for β-galactosidase (blue). Right, quantification of senescence in RPE-1.PLK4 cells. Note that senescence was assessed by enlarged morphology (purple arrowheads). Scale bar: 40 μM. (F) Left, quantification of γH2AX foci. Right, cells were stained for γH2AX. L, large nuclei. Number of cells MCF10A.PLK4 −DOX = 469; +DOX = 466; and RPE-1.PLK4 −DOX = 155; +DOX = 115; +DoxoR = 84. Scale bar: 20 μM. (G and H) (G) Fold change of secreted SASP components in MCF10A and (H) RPE-1 cells. (I) HMGB1 secretion after 48 hr. (J) IL-8 secretion after p53 depletion (48 hr). (K) Quantification of invasive structures. Graphic in (G) represents 4 independent experiments; for all other graphics, error bars represent mean ± SD from three independent experiments. p < 0.05, ∗∗p < 0.01, ∗∗∗p < 0.001, ∗∗∗∗p < 0.0001; ns, not significant. See also Figure S5 and Table S1.
Figure 6
Figure 6
Increased ROS Levels in Cells with Extra Centrosomes Drive Secretion (A and B) (A) Levels of intracellular ROS using DCFDA or (B) by measuring the ratio of GSH/GSSG (48 hr). (C) NRF2 protein levels in the cytosolic and nuclear fractions. (D) Gene expression profile of cells with extra centrosomes (48 hr) compared to an NRF2 (NFE2L2)-induced gene-set signature. (E) IL-8 secretion in after NAC treatment. (F) Quantification of invasive structures. (G) Left, cells stained for β-galactosidase (blue). Right, quantification of β-galactosidase positive cells. Scale bar: 40 μM. (H) Left, quantification of γH2AX foci. Right, cells were stained for DNA (green) and γH2AX (magenta). L, large nuclei. Number of cells MCF10A.PLK4 −DOX = 469; −DOX+H2O2 = 518; +DOX = 466; +DOX+H2O2 = 377. Scale bar: 20 μM. (I) Quantification of invasive structures. (J) Ratio of GSH/GSSG. (K) IL-8 secretion in cells treated with apocynin. (L) Quantification of invasive structures. For all graphics error bars, represent mean ± SD from three independent experiments. p < 0.05, ∗∗p < 0.01, ∗∗∗p < 0.001, ∗∗∗∗p < 0.0001; ns not significant. See also Figure S6 and Table S1.
Figure 7
Figure 7
Centrosome Amplification in Breast Cancer Mediates Paracrine Invasion and Is Associated with IL-8 Secretion (A) Quantification of round invasive and tubular structures in PyMT-derived tumor organoids. (B) Tumor organoids. Scale bar: 20 μM. (C) Area and branching of the tumor organoids. Error bars represent mean ± SEM. (D) PyMT tubular organoids. Scale bar: 100 μM. (E) Levels of centrosome amplification and breast cancer subtype. (F) mRNA expression levels of pro-invasive factors. (G) Quantification of invasive structures. (H) Schematic representation of how centrosome amplification promotes secretion and paracrine invasion. Unless specified, for all graphics, error bars represent mean ± SD from three independent experiments. p < 0.05, ∗∗p < 0.01; ns, not significant. See also Figure S7 and Table S1.

References

    1. Acosta J.C., Banito A., Wuestefeld T., Georgilis A., Janich P., Morton J.P., Athineos D., Kang T.W., Lasitschka F., Andrulis M. A complex secretory program orchestrated by the inflammasome controls paracrine senescence. Nat. Cell Biol. 2013;15:978–990. - PMC - PubMed
    1. Arnandis T., Godinho S.A. Studying centrosome function using three-dimensional cell cultures. Methods Cell Biol. 2015;129:37–50. - PubMed
    1. Barretina J., Caponigro G., Stransky N., Venkatesan K., Margolin A.A., Kim S., Wilson C.J., Lehar J., Kryukov G.V., Sonkin D. The Cancer Cell Line Encyclopedia enables predictive modelling of anticancer drug sensitivity. Nature. 2012;483:603–607. - PMC - PubMed
    1. Basto R., Brunk K., Vinadogrova T., Peel N., Franz A., Khodjakov A., Raff J.W. Centrosome amplification can initiate tumorigenesis in flies. Cell. 2008;133:1032–1042. - PMC - PubMed
    1. Benoy I.H., Salgado R., Van Dam P., Geboers K., Van Marck E., Scharpe S., Vermeulen P.B., Dirix L.Y. Increased serum interleukin-8 in patients with early and metastatic breast cancer correlates with early dissemination and survival. Clin. Cancer Res. 2004;10:7157–7162. - PubMed

Publication types