. 2018 Nov 19;47(4):509-523.e5.
doi: 10.1016/j.devcel.2018.10.027.

A Cell/Cilia Cycle Biosensor for Single-Cell Kinetics Reveals Persistence of Cilia after G1/S Transition Is a General Property in Cells and Mice

Affiliations

A Cell/Cilia Cycle Biosensor for Single-Cell Kinetics Reveals Persistence of Cilia after G1/S Transition Is a General Property in Cells and Mice

Matthew J Ford et al. Dev Cell. .

Abstract

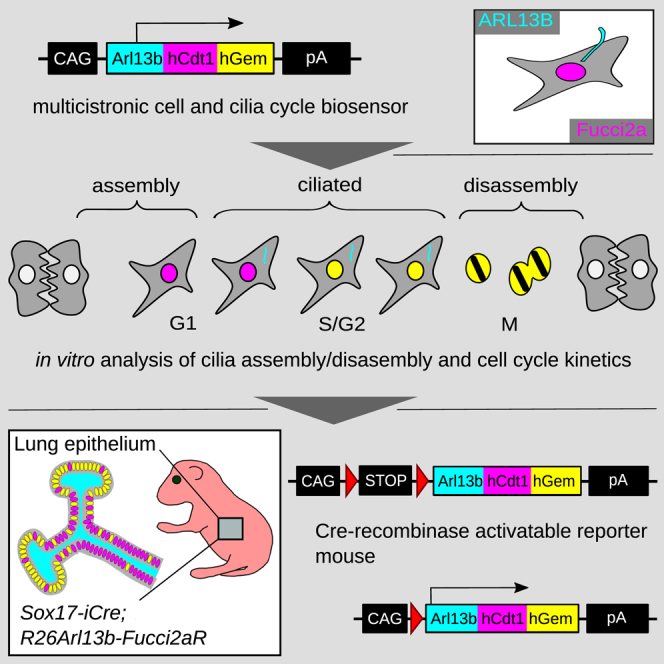
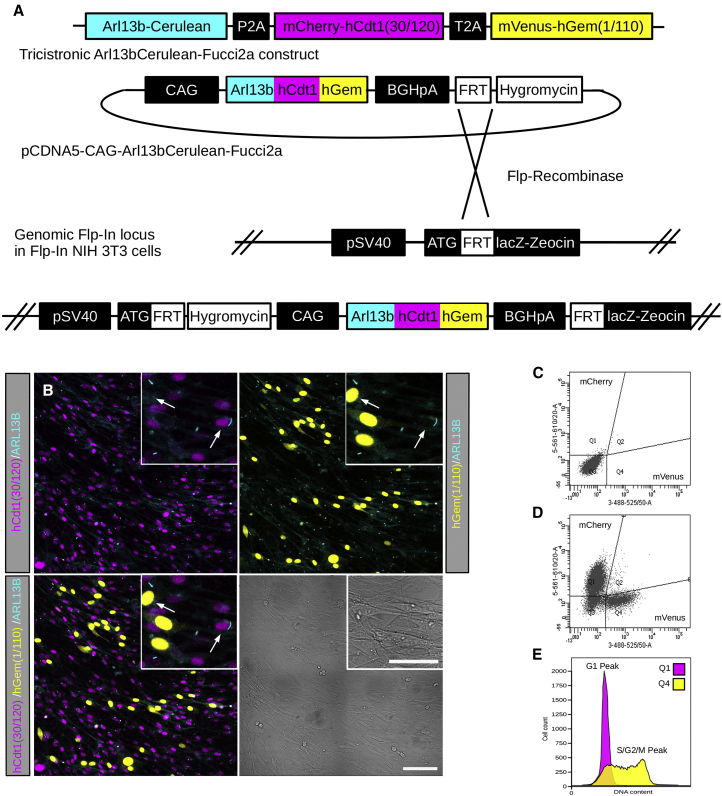
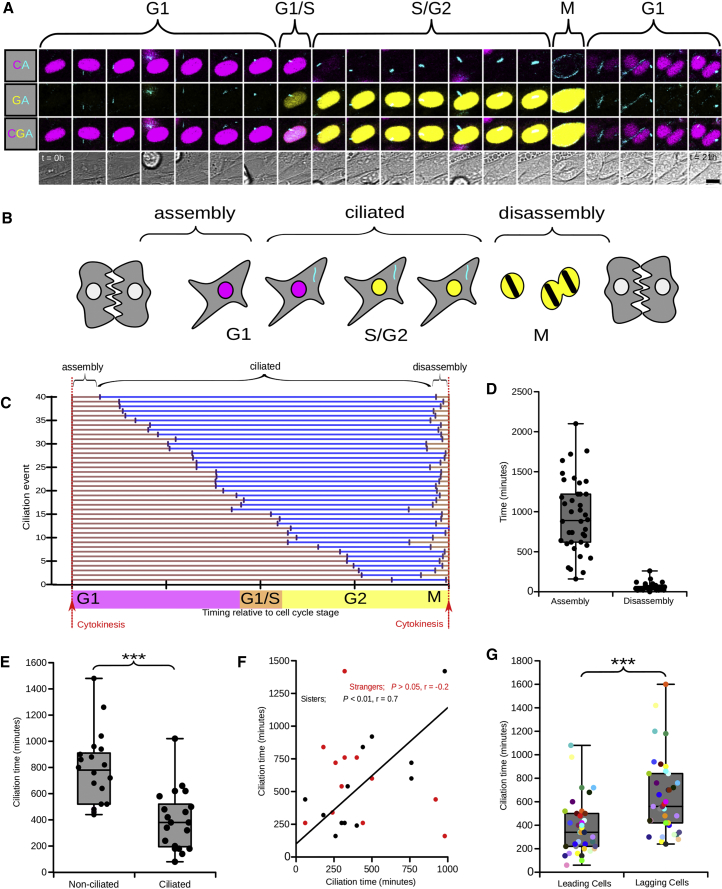
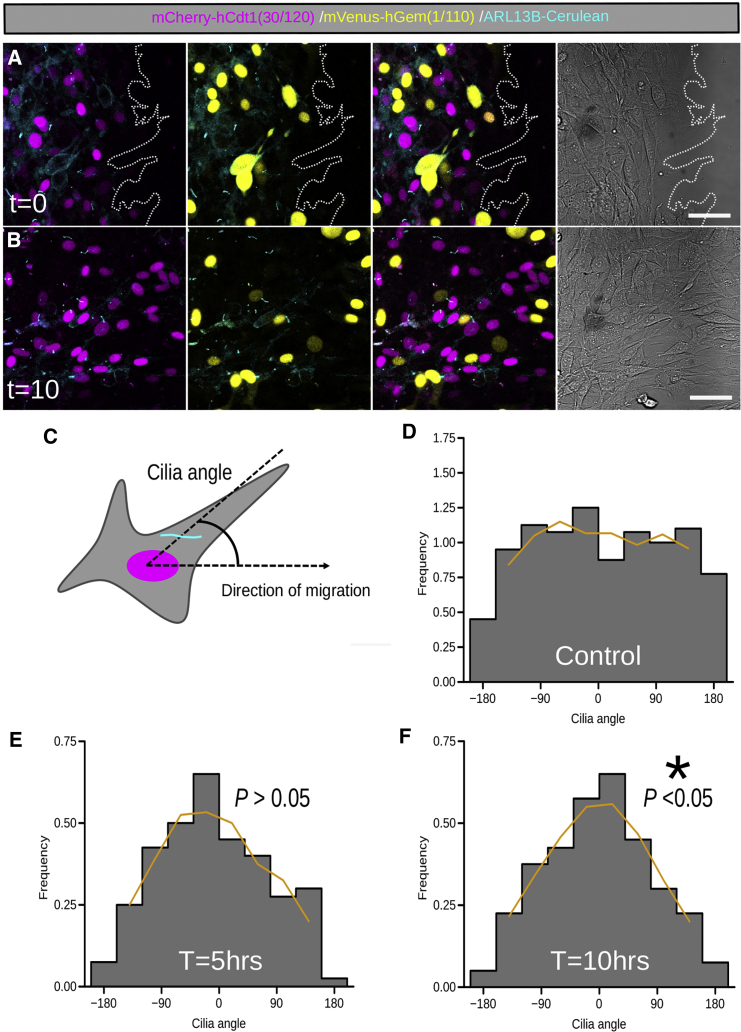
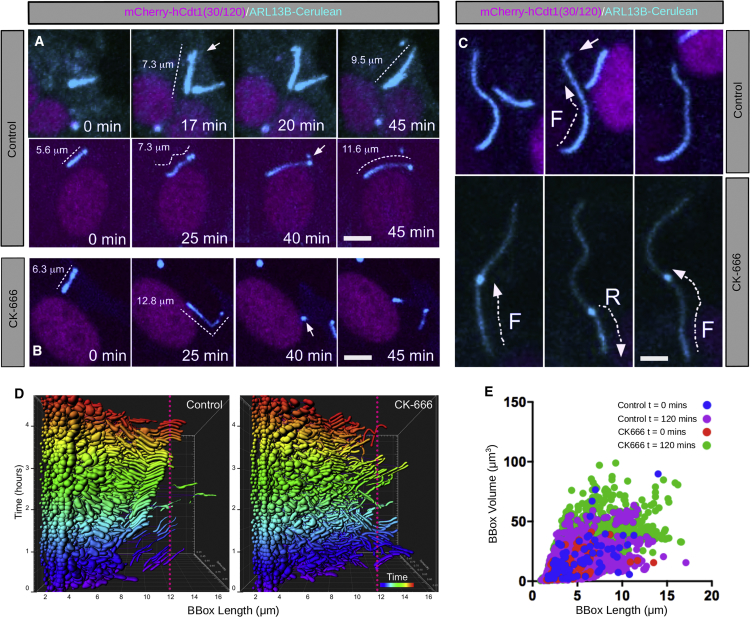
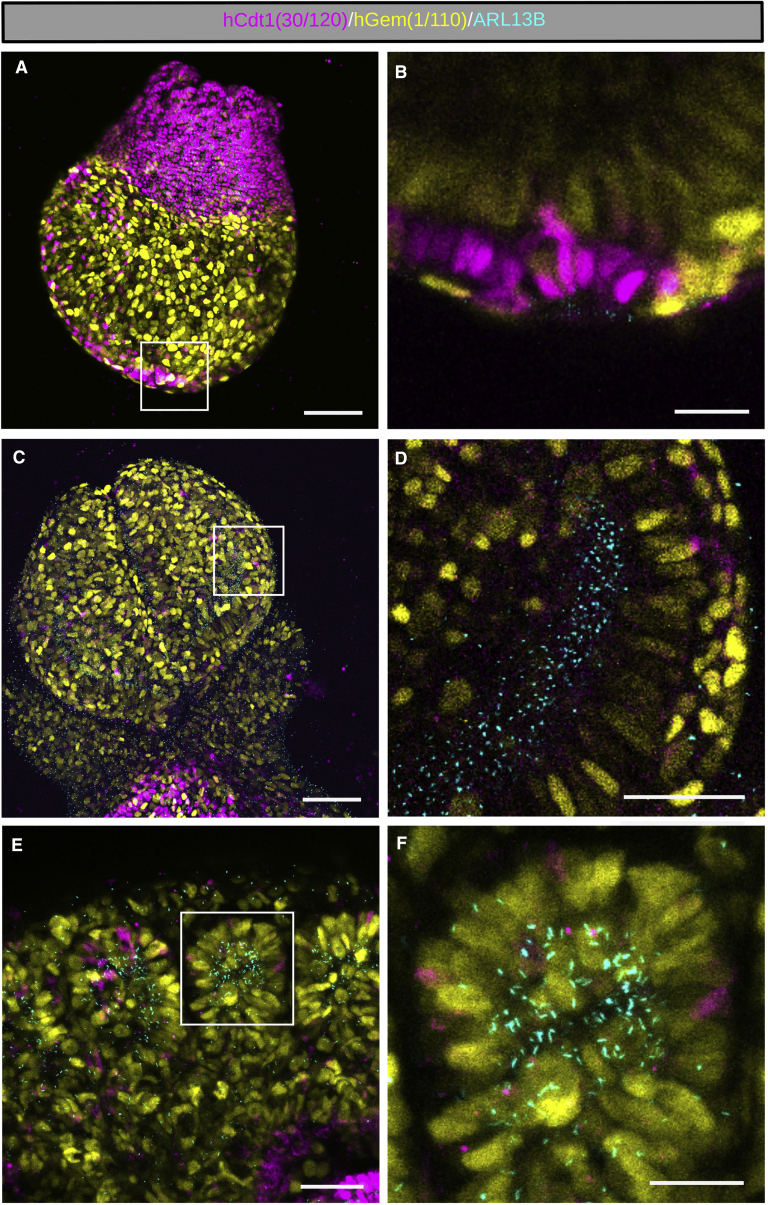
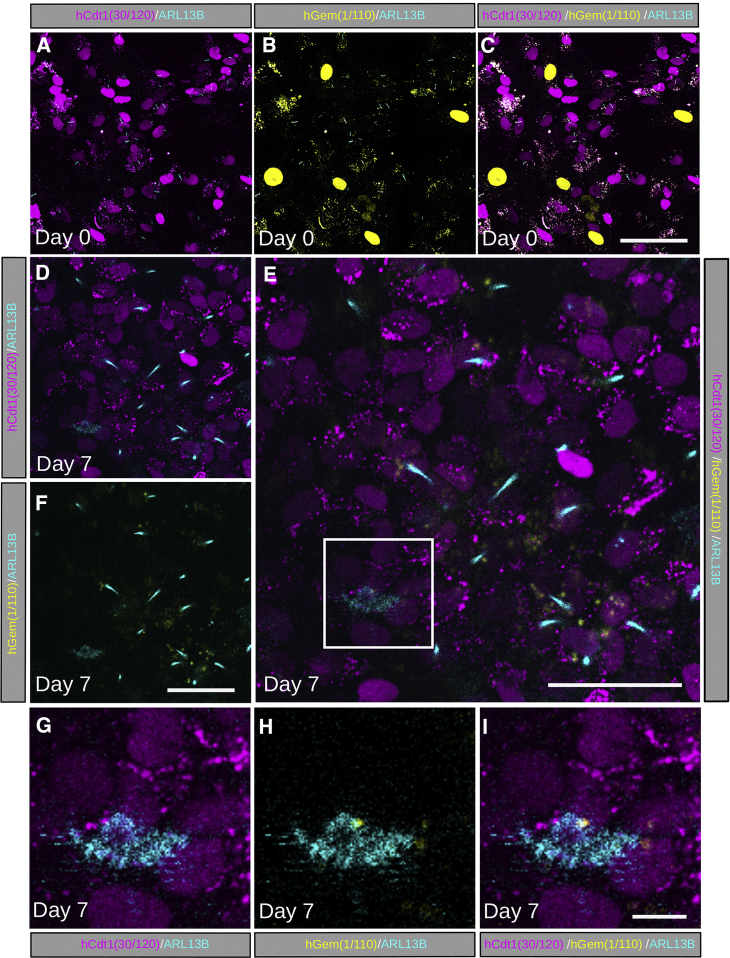
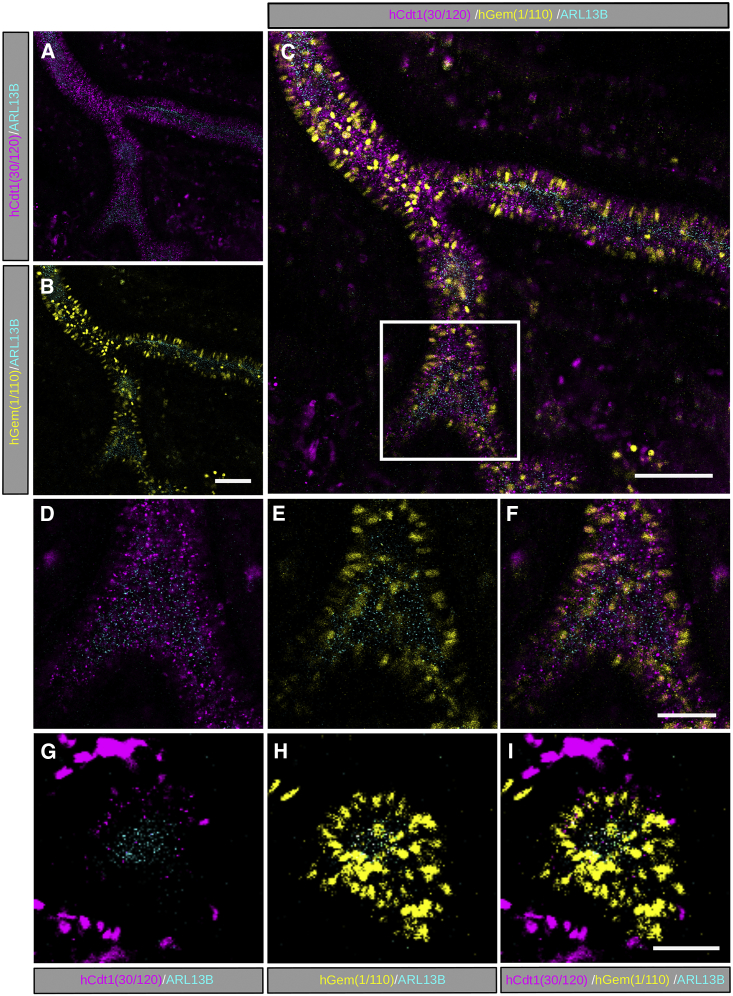
The cilia and cell cycles are inextricably linked. Centrioles in the basal body of cilia nucleate the ciliary axoneme and sequester pericentriolar matrix (PCM) at the centrosome to organize the mitotic spindle. Cilia themselves respond to growth signals, prompting cilia resorption and cell cycle re-entry. We describe a fluorescent cilia and cell cycle biosensor allowing live imaging of cell cycle progression and cilia assembly and disassembly kinetics in cells and inducible mice. We define assembly and disassembly in relation to cell cycle stage with single-cell resolution and explore the intercellular heterogeneity in cilia kinetics. In all cells and tissues analyzed, we observed cilia that persist through the G1/S transition and into S/G2/M-phase. We conclude that persistence of cilia after the G1/S transition is a general property. This resource will shed light at an individual cell level on the interplay between the cilia and cell cycles in development, regeneration, and disease.

Keywords: Rosa26; biosensor; cell cycle; cilia; live imaging; organoid; reporter mouse.


Figures

None
Graphical abstract
Figure 1
Figure 1
Design and Characterization of an Arl13bCerulean-Fucci2a Reporter with Stable Integration and Expression in an NIH 3T3 Cell Line (A) The full length mouse Arl13b cDNA was fused to mCerulean and combined with the Fucci2a probes mCherry-hCdt1(30/120) and mVenus-hGem(1/110) separated by the self-cleaving peptides P2A and T2A, respectively. Expression of this tricistronic construct is driven by the CAG promoter. A stable NIH 3T3 cell line was generated using the Flp-In system incorporating a single copy of Arl13bCerulean-Fucci2a by co-transfection of pCDNA5-CAG-Arl13bCerulean-Fucci2a and the Flp-recombinase expressing plasmid pOG44. (B) Live confocal images of the Arl13bCerulean-Fucci2a 3T3 cells showing nuclei distributed throughout the G1 or S/G2M cell cycle phases and labeled with mCherry-hCdt1(30/120) or mVenus-hGem(1/110), respectively. Single primary cilia are apparent on cells in both G1 and S/G2/M phases of the cell cycle (arrows in B, inset). (C and D) FACS analysis of Arl13bCerulean-Fucci2a 3T3 cells showed distinct mCherry-hCdt1(30/120) and mVenus-hGem(1/110) labeled cell populations (D) when compared to a control cell line (C). (E) DAPI staining and FACS analysis to determine the DNA content of the mCherry-hCdt1(30/120) and mVenus-hGem(1/110) populations in (C) confirmed faithful reporting of cell cycle stage; mCherry-hCdt1(30/120) positive cells exhibit a classical 2n peak confirming they are in the G1 cell cycle phase; mVenus-hGem(1/110) positive cells exhibit a long peak between 2n and 4n, confirming a population of cells in S, G2, and M phases of the cell cycle. Scale bars: 100 μm in (B) and 50 μm in (B) (inset).
Figure 2
Figure 2
The Dynamics of the Cilia Assembly and Disassembly Cycle in Arl13bCerulean-Fucci2a NIH 3T3 Cells (A) Cell cycle progression of a single Arl13bCerulean-Fucci2a labeled nucleus as it cycles from G1 through S and G2 phases and undergoes mitosis. The sequential peaks of mCherry-hCdt1(30/120) and mVenus-hGem(1/110) are evident as is the presence of a single Arl13b-Cerulean labeled cilium during the G1, S, and G2 phases before being disassembled shortly before mitosis. (B) The dynamics of the cilia cycle in Arl13bCerulean-Fucci2a 3T3 cells were determined in time-lapse experiments. We defined cilia assembly and disassembly times as the time between cytokinesis and the initiation of cilia formation or the completion of cilia resorption (loss of ARL13B-Cerulean localization). (C) Analysis of individual cell ciliation events showing the ciliation state of each cell and its relative position within the G1 and S/G2/M cell cycle phases (n = 40 ciliation events). (D) Analysis of cilia assembly and disassembly times in cycling Arl13bCerulean-Fucci2a 3T3 cells (n = 40) revealed that, while cilia assembly time varied greatly, disassembly happened in a relatively tight window. (E) We compared the behavior of the progeny of ciliated and non-ciliated cells. Cilia assembly is significantly faster after mitosis in the progeny of ciliated mother cells compared to the progeny of non-ciliated mothers (Student’s t test; p < 0.001; n = 20 in each group). (F) Further investigation of the variation in cilia assembly time revealed a positive correlation between the cilia assembly times of the direct daughters of a mitosis (Spearman’s rank; p < 0.01; r = 0.7; n = 12 pairs) but not between randomly paired cells (Spearman’s rank; p > 0.05; r = −0.2; n = 12 pairs). (G) Comparing the sisters in individual daughter pairs revealed that one daughter typically lagged behind the other in the time taken to initiate cilia formation; we termed these daughters leading and lagging cells. There is a significant difference in cilia assembly timing between these groups (Student’s t test; p < 0.001; n = 37 daughter pairs). Boxplots indicate minimum, maximum, median, and interquartile range; all values are shown. Scale bar: 10 μm in (A); t = time in hours.
Figure 3
Figure 3
Arl13bCerulean-Fucci2a 3T3 Cells Orientate Their Cilia toward the Leading Edge Concurrent to Migration during Wound Healing (A) Images taken of Arl13bCerulean-Fucci2a 3T3 cells migrating into the cell free space after the removal of a silicon barrier. (B) Images of the region shown in (A) after 10 hr of wound healing. (C) The orientation of the primary cilium was calculated for individual cells by measuring the angle between the center of the cell’s nucleus and the cilium, followed by normalization to the collective angle of migration. (D) A histogram of ciliary angles in a control experiment in which there is no directional movement shows a uniform distribution of ciliary angles (n = 387 cilia). (E) In the migration assay, 5 hr after removal of the silicon barrier, the majority of cells have reoriented their primary cilia so that the distribution of angles coalesces around the direction of migration (n = 133 cilia). (F) After 10 hr, the distribution of cilia angles was shown to differ significantly from the uniform distribution observed in the control experiment (two sample Kolmogorov-Smirnov test; p < 0.05). Scale bars: 50 μm in (A) and (B).
Figure 4
Figure 4
Ciliary Decapitation Occurs during Ciliary Growth in G1 and Is Dependent on F-Actin (A) Live imaging of Arl13bCerulean-Fucci2a NIH 3T3 cells in G1 (mCherry-hCdt1(30/120) positive) showing cilia decapitation (arrows at 17 and 40 min) prior to cilia elongation. (B) The addition of 200-μM F-actin inhibitor (CK-666) destabilized cilia resulting in frequent decapitations (arrow at 40 min) far from the scission point. (C) Cilia swellings moving in the anterograde direction (F) were occasionally observed prior to cilia scission. In the presence of CK-666, swellings were observed moving in both anterograde (F) and retrograde (R) directions. (D) The bounding box (BBox—minimum bounding rectangular cuboid) of each cilium was identified using image processing, and a comparison of the BBox morphology of elongating cilia after serum starvation was performed. Cilia assembling in the presence of CK-666 are less stable and have a deformed morphology compared to controls. (E) Scatterplot correlating the bounding box length and volume of elongating cilia at the start and end of the time-lapse experiment in (D). Comparison of the ratio of volume to length showed a statistically significant difference between the control and CK-666 treated groups at 120 min (2-way ANOVA; p < 0.0001; Tukey’s HSD; p < 0.0001). Scale bars: 5 μm in (A)–(C); BBox = bounding box.
Figure 5
Figure 5
Visualization of Primary Cilia and Cell Cycle Status in R26Arl13b-Fucci2aR+/Tg; CAG-Cre+/Tg Embryos Ubiquitous expression of the Arl13bCerulean-Fucci2a transgene was achieved by crossing R26Arl13b-Fucci2aR mice with ubiquitous CAG-Cre mice, followed by whole-mount confocal imaging of E7.5 and E8.5 embryos. (A) A representative Z-projection of a neural plate stage E7.5 R26Arl13b-Fucci2aR+/Tg; CAG-Cre+/Tg embryo. Cells of the proximal extraembryonic ectoderm are predominantly labeled with mCherry-hCdt1(30/120) and are starkly less proliferative compared to the distal embryonic visceral endoderm and epiblast lineages that contain a large proportion of cells in S/G2/M phases of the cell cycle labeled with mVenus-hGem(1/110). In all cases (n = 4 R26Arl13b-Fucci2a+/Tg E7.5 embryos from 3 litters), the node can be identified as a cluster of mCherry-hCdt1(30/120) positive cells at the distal pole of the embryo (boxed area). (B) A single plane of boxed area in (A) showing the node as a minor population of cells in G1/G0. Cells of the node are orientated perpendicular to the embryonic surface with mCerulean-ARL13B positive cilia pointing into a concave depression at the distal tip of the embryo (also see Figure S2). (C) A representative Z-projection of a 5S stage E8.5 R26Arl13b-Fucci2a+/Tg; CAG-Cre+/Tg prosencephalon (n = 8 R26Arl13b-Fucci2a+/Tg E8.5 embryos from 2 litters). The majority of cells on the surface and within the future forebrain are mVenus-hGem(1/110) positive, many of which are ciliated. (D) A single plane of the boxed area in (C) showing a lateral ventricle. A high density of cilia are located in the lumen of the ventricle surrounded by mostly mVenus-hGem(1/110) positive neuroepithelial cells orientated perpendicular to the lumen (also see Figure S3). (E) A representative Z-projection of the rhombencephalic region of an E8.5 R26Arl13b-Fucci2aR+/Tg; CAG-Cre+/Tg embryo (n = 8 R26Arl13b-Fucci2a+/Tg E8.5 embryos from 2 litters). Emerging somites are clearly distinguishable as clusters of cycling cells labeled with mVenus-hGem(1/110) and mCherry-hCdt1(30/120). A high density of cilia are seen within each somite associated with cells in both G1 and S/G2/M phases of the cell cycle. Primary cilia are also identifiable on cycling cells outside of each somite. (F) Increased magnification of a single somite from boxed region in (E) (also see Figure S4). Scale bars: 100 μm in (A), (C), and (E). Scale bars: 50 μm in (B) and (D), and 25 μm in (F).
Figure 6
Figure 6
Primary Ependymal Cultures Exit the Cell Cycle and Form Multiple Motile Cilia during Differentiation Primary ependymal cultures were prepared from the ventricular zone of E18.5 R26Arl13b-Fucci2aR+/Tg; CAG-Cre+ve embryos. Primary cell cultures were grown to confluency before being serum starved (Day 0) to induce differentiation followed by live confocal imaging. (A) At Day 0, ciliated cells in G1 phase of the cell cycle labelled with mCherry-hCdt1 (30/120). (B) Area in (A) showing ciliated cells in S/G2/M phase of the cell cycle labelled with mVenus-hGem (1/110). (C) Merge of area imaged in (A,B) showing primary cilia are present on a subset of cells in both G1 and S/G2/M phase. (D) Upon reaching confluency and following 7 days of serum starvation, all cells had dropped out of the cell cycle and were mCherry-hCdt1 (30/120) positive. (E) Merged image (D, F) showing emergence of Cherry-hCdt1 (30/120) positive multiciliated cells. (F) After 7 days serum starvation, no cells were positive for mVenus-hGem (1/110). (G) Magnification of box in (E) showing mCherry-hCdt1(30/120) labelled cells with motile multicilia labelled with ARL13B-Cerulean (also see Video S8). (H) Ependymal cells had exited the cell cycle as shown by lack of mVenus-hGem (1/110) expression. (I) Merged image (G, H). Scale bars: 50 μm in (C), (F), and (E), and 10 μm in (I).
Figure 7
Figure 7
Primary Cilia Line the Luminal Surface of the Airway Epithelium during Lung Development To confirm the ability to induce tissue-specific expression of Arl13bCerulean-Fucci2a, R26Arl13b-Fucci2aR mice were crossed with endoderm-specific Cre-recombinase expressing line Sox17-2A-iCre. Embryonic lungs were dissected from E11.5 embryos and imaged in ex vivo organotypic culture (n = 9 R26Arl13b-Fucci2a+/Tg E11.5 embryos from 2 litters). Arl13bCerulean-Fucci2a expression was restricted to the lung epithelium and a subset of migratory mesenchymal cells. (A) In the proximal non-branching regions of the epithelium, cells were predominantly in G1 labelled with mCherry-hCdt1(30/120). ARL13B-Cerulean labelled cilia were visible along the entire length of the airway epithelium. (B) A subset of proximal epithelial cells resided in S/G2/M - labelled with mVenus-hGem(1/110). (C) Merged image (A,B). (D) Magnification of the region in (C) showing mCherry-hCdt1(30/120) labelled epithelial cells with primary cilia oriented towards the lumen of the branching tubule. (E) Magnification of the box in (C) showing mVenus-hGem(1/110) labelled epithelial cells with primary cilia oriented towards the lumen of the branching tubule. (F) Merged region of interest (D,E). (G) At the distal tips of the actively branching epithelium, mCherry-hCdt1(30/120) labelled epithelial cells are largely absent but ARL13B-Cerulean labelled cilia are present projecting into the lumen. (H) A highly proliferative area is evident at the branching tip where mVenus-hGem(1/110) labelled epithelial cells predominate and harbour ARL13B-Cerulean labelled cilia that project into the lumen. (I) Merged image of region of interest (G,H). Scale bars: 50 μm in (B) and (C), and 10 μm in (F).

Similar articles

Cited by

References

    1. Abe T., Sakaue-Sawano A., Kiyonari H., Shioi G., Inoue K., Horiuchi T., Nakao K., Miyawaki A., Aizawa S., Fujimori T. Visualization of cell cycle in mouse embryos with Fucci2 reporter directed by Rosa26 promoter. Development. 2013;140:237–246. - PubMed
    1. Anderson C.T., Stearns T. Centriole age underlies asynchronous primary cilium growth in mammalian cells. Curr. Biol. 2009;19:1498–1502. - PMC - PubMed
    1. Bangs F.K., Schrode N., Hadjantonakis A.K., Anderson K.V. Lineage specificity of primary cilia in the mouse embryo. Nat. Cell Biol. 2015;17:113–122. - PMC - PubMed
    1. Becker-Heck A., Zohn I.E., Okabe N., Pollock A., Lenhart K.B., Sullivan-Brown J., McSheene J., Loges N.T., Olbrich H., Haeffner K. The coiled-coil domain containing protein CCDC40 is essential for motile cilia function and left-right axis formation. Nat. Genet. 2011;43:79–84. - PMC - PubMed
    1. Bellusci S., Furuta Y., Rush M.G., Henderson R., Winnier G., Hogan B.L. Involvement of Sonic hedgehog (Shh) in mouse embryonic lung growth and morphogenesis. Development. 1997;124:53–63. - PubMed

Publication types

Substances