The metastasis suppressor NME1 inhibits melanoma cell motility via direct transcriptional induction of the integrin beta-3 gene
- PMID: 30458180
- PMCID: PMC6446928
- DOI: 10.1016/j.yexcr.2018.11.010
The metastasis suppressor NME1 inhibits melanoma cell motility via direct transcriptional induction of the integrin beta-3 gene
Abstract
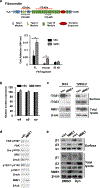
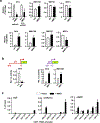
Expression of the metastasis suppressor NME1 in melanoma is associated with reduced cellular motility, invasion, and metastasis, but mechanisms underlying these activities are not completely understood. Herein we report a novel mechanism through which NME1 drives formation of large, stable focal adhesions (FAs) in melanoma cells via induction of integrin β3 (ITGβ3), and in one cell line, concomitant suppression of integrin β1 (ITGβ1) transcripts. Forced expression of NME1 resulted in a strong activation of the promoter region (-301 to +13) of the ITGB3 gene. Chromatin immunoprecipitation (ChIP) analysis revealed the transcriptional induction was associated with direct recruitment of NME1 and an increase in the epigenetic activation mark, acetylation of histone 3 on lysine 27 (H3K27Ac) to a 1 kb stretch of 5'-flanking sequence of the ITGB3 gene. Unexpectedly, NME1 did not affect the amount either ITGβ1 or ITGβ3 proteins were internalized and recycled, processes commonly associated with regulating expression of integrins at the cell surface. The ability of NME1 to suppress motile and invasive phenotypes of melanoma cells was dependent on its induction of ITGβ3. Expression of ITGβ3 mRNA was associated with increased disease-free survival time in melanoma patients of the TCGA collection, consistent with its potential role as an effector of the metastasis suppressor function of NME1. Together, these data indicate metastasis suppressor activity of NME1 in melanoma is mediated by induction of ITGB3 gene transcription, with NME1-driven enrichment of ITGβ3 protein at the cell membrane resulting in attenuated cell motility through the stabilization of large focal adhesions.
Keywords: Cell motility; ITGβ3; Melanoma; Metastasis; NME1; Transcription.
Copyright © 2018 Elsevier Inc. All rights reserved.
Conflict of interest statement
The authors declare no conflict of interest.
Figures


Similar articles
-
Metastasis suppressor NME1 regulates melanoma cell morphology, self-adhesion and motility via induction of fibronectin expression.Exp Dermatol. 2015 Jun;24(6):455-61. doi: 10.1111/exd.12697. Epub 2015 Apr 27. Exp Dermatol. 2015. PMID: 25808322 Free PMC article.
-
Metastasis Suppressor NME1 Directly Activates Transcription of the ALDOC Gene in Melanoma Cells.Anticancer Res. 2018 Nov;38(11):6059-6068. doi: 10.21873/anticanres.12956. Anticancer Res. 2018. PMID: 30396920 Free PMC article.
-
Dual functions of NME1 in suppression of cell motility and enhancement of genomic stability in melanoma.Naunyn Schmiedebergs Arch Pharmacol. 2015 Feb;388(2):199-206. doi: 10.1007/s00210-014-1010-4. Epub 2014 Jul 15. Naunyn Schmiedebergs Arch Pharmacol. 2015. PMID: 25017017 Free PMC article.
-
Multiple mechanisms underlie metastasis suppressor function of NM23-H1 in melanoma.Naunyn Schmiedebergs Arch Pharmacol. 2011 Oct;384(4-5):433-8. doi: 10.1007/s00210-011-0621-2. Epub 2011 Mar 30. Naunyn Schmiedebergs Arch Pharmacol. 2011. PMID: 21448569 Review.
-
Learning about the functions of NME/NM23: lessons from knockout mice to silencing strategies.Naunyn Schmiedebergs Arch Pharmacol. 2011 Oct;384(4-5):421-31. doi: 10.1007/s00210-011-0649-3. Epub 2011 May 12. Naunyn Schmiedebergs Arch Pharmacol. 2011. PMID: 21562815 Review.
Cited by
-
Avian Models for Human Carcinogenesis-Recent Findings from Molecular and Clinical Research.Cells. 2024 Oct 30;13(21):1797. doi: 10.3390/cells13211797. Cells. 2024. PMID: 39513904 Free PMC article. Review.
-
TMT-based proteomic analysis reveals integrins involved in the synergistic infection of reticuloendotheliosis virus and avian leukosis virus subgroup J.BMC Vet Res. 2022 Apr 4;18(1):131. doi: 10.1186/s12917-022-03207-6. BMC Vet Res. 2022. PMID: 35379256 Free PMC article.
-
Identification of Therapeutic Targets and Prognostic Biomarkers Among Integrin Subunits in the Skin Cutaneous Melanoma Microenvironment.Front Oncol. 2021 Sep 30;11:751875. doi: 10.3389/fonc.2021.751875. eCollection 2021. Front Oncol. 2021. PMID: 34660316 Free PMC article.
-
Integrated Analysis of Single-Cell and Bulk RNA Data Reveals Complexity and Significance of the Melanoma Interactome.Cancers (Basel). 2025 Jan 5;17(1):148. doi: 10.3390/cancers17010148. Cancers (Basel). 2025. PMID: 39796775 Free PMC article.
-
A Fucose-Containing Sulfated Polysaccharide from Spatoglossum schröederi Potentially Targets Tumor Growth Rather Than Cytotoxicity: Distinguishing Action on Human Melanoma Cell Lines.Mar Biotechnol (NY). 2024 Feb;26(1):181-198. doi: 10.1007/s10126-024-10287-y. Epub 2024 Jan 26. Mar Biotechnol (NY). 2024. PMID: 38273163
References
-
- SEER cancer statistics review In: Horner MJ, Krapcho M, Neyman N, et al., eds. Bethesda, MD, 2006.
-
- Steeg PS, Bevilacqua G, Kopper L, Thorgeirsson UP, Talmadge JE, Liotta LA, Sobel ME. Evidence for a novel gene associated with low tumor metastatic potential. J Natl Cancer Inst 1988;80:200–4. - PubMed
-
- Hartsough MT, Steeg PS. Nm23/nucleoside diphosphate kinase in human cancers. J Bioenerg Biomembr 2000;32:301–08. - PubMed
-
- Hsu S, Huang F, Ossowski L, Friedman E. Colon carcinoma cells with inactive nm23 show increased motility and response to motility factors. Carcinogenesis 1995;16:2259–62. - PubMed
Publication types
MeSH terms
Substances
Grants and funding
LinkOut - more resources
Full Text Sources
Medical
Molecular Biology Databases
Research Materials
Miscellaneous

