Comparative Study
. 2018 Dec 6;27(4):581-593.
doi: 10.1044/2018_AJA-18-0027.

A Comparison of Personal Sound Amplification Products and Hearing Aids in Ecologically Relevant Test Environments

Affiliations
Comparative Study

A Comparison of Personal Sound Amplification Products and Hearing Aids in Ecologically Relevant Test Environments

Lisa Brody et al. Am J Audiol. .

Abstract

Purpose: The aim of this study was to compare the benefit of self-adjusted personal sound amplification products (PSAPs) to audiologist-fitted hearing aids based on speech recognition, listening effort, and sound quality in ecologically relevant test conditions to estimate real-world effectiveness.

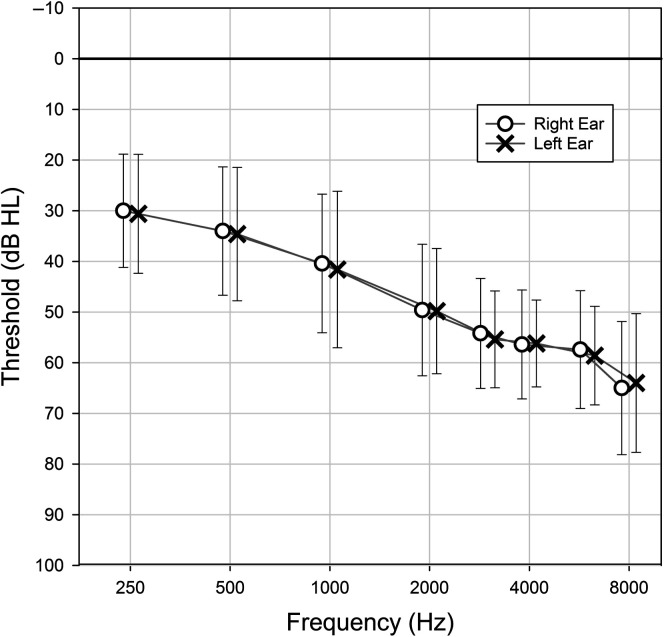
Method: Twenty-five older adults with bilateral mild-to-moderate hearing loss completed the single-blinded, crossover study. Participants underwent aided testing using 3 PSAPs and a traditional hearing aid, as well as unaided testing. PSAPs were adjusted based on participant preference, whereas the hearing aid was configured using best-practice verification protocols. Audibility provided by the devices was quantified using the Speech Intelligibility Index (American National Standards Institute, 2012). Outcome measures assessing speech recognition, listening effort, and sound quality were administered in ecologically relevant laboratory conditions designed to represent real-world speech listening situations.

Results: All devices significantly improved Speech Intelligibility Index compared to unaided listening, with the hearing aid providing more audibility than all PSAPs. Results further revealed that, in general, the hearing aid improved speech recognition performance and reduced listening effort significantly more than all PSAPs. Few differences in sound quality were observed between devices. All PSAPs improved speech recognition and listening effort compared to unaided testing.

Conclusions: Hearing aids fitted using best-practice verification protocols were capable of providing more aided audibility, better speech recognition performance, and lower listening effort compared to the PSAPs tested in the current study. Differences in sound quality between the devices were minimal. However, because all PSAPs tested in the study significantly improved participants' speech recognition performance and reduced listening effort compared to unaided listening, PSAPs could serve as a budget-friendly option for those who cannot afford traditional amplification.


Figures

Figure 1.
Figure 1.
Mean hearing thresholds for the participants. Right and left ears are offset from one another. Error bars indicate 1 SD.
Figure 2.
Figure 2.
Input–output functions at 2000 Hz measured for each device in P1 (A) and P2 (B). Devices were set to the most common selected settings, averaged across all 25 participants. HA = hearing aid; PSAP = personal sound amplification product.
Figure 3.
Figure 3.
Characteristics of the six prototype listening situations (PLS). Circles indicate the eight-loudspeaker array surrounding the participant (center). Black circles indicate location of the speech. Eye graphic indicates presence of visual cues. For PLS1 to PLS3, speech and noise were presented at 60 and 40 dBA, respectively. For PLS4 to PLS6, speech and noise were presented at 68 and 61 dBA, respectively.
Figure 4.
Figure 4.
Mean real-ear aided response (REAR) as a function of frequency for the first (P1) (A) and second (P2) (B) user program of each device with participant-selected settings using a 65-dB SPL speech input. Mean National Acoustics Laboratories Nonlinear prescription procedures, 2nd generation (NAL-NL2) targets averaged across participants are plotted as single points. HA = hearing aid; PSAP = personal sound amplification product.
Figure 5.
Figure 5.
Box plots of better ear Speech Intelligibility Index measures for each device (and unaided) obtained on-ear using a 65-dB SPL speech input in each of the first (P1) and second (P2) user programs of the device. The boundaries of the boxes represent the 25th and 75th percentiles, and the thin line within the boxes marks the median. Thick lines represent the means. Error bars indicate the 10th and 90th percentiles. HA = hearing aid; PSAP = personal sound amplification product.
Figure 6.
Figure 6.
Box plots of speech recognition threshold (SRT) in quiet (A) and noise (B) measured using the Hearing in Noise Test as a function of device condition. The y-axis has been reversed so that the top of the figure represents better performance. The boundaries of the boxes represent the 25th and 75th percentiles, and the thin line within the boxes marks the median. Thick lines represent the means. Error bars indicate the 10th and 90th percentiles. HA = hearing aid; PSAP = personal sound amplification product.
Figure 7.
Figure 7.
Box plots of the Connected Speech Test score (in percent correct) for each device condition in each prototype listening situation (PLS) (A) and collapsed across all PLSs (excluding PLS4) (B). Higher scores represent better performance. The boundaries of the boxes represent the 25th and 75th percentiles, and the thin line within the boxes marks the median. Thick lines represent the means. Error bars indicate the 10th and 90th percentiles. HA = hearing aid; PSAP = personal sound amplification product.
Figure 8.
Figure 8.
Box plots of self-reported listening effort rating for each device condition in each prototype listening situation (PLS) (A) and collapsed across all PLSs (B). Higher scores represent better performance. The boundaries of the boxes represent the 25th and 75th percentiles, and the thin line within the boxes marks the median. Thick lines represent the means. Error bars indicate the 10th and 90th percentiles. HA = hearing aid; PSAP = personal sound amplification product.
Figure 9.
Figure 9.
Box plots of self-reported sound quality rating for each device condition in each prototype listening situation (PLS) (A) and collapsed across all PLSs (B). Higher scores represent better performance. The boundaries of the boxes represent the 25th and 75th percentiles, and the thin line within the boxes marks the median. Thick lines represent the means. Error bars indicate the 10th and 90th percentiles. HA = hearing aid; PSAP = personal sound amplification product.

Similar articles

Cited by

References

    1. Abrams, H. B. , & Kihm, J. (2015). An introduction to MarkeTrak IX: A new baseline for the hearing aid market. Hearing Review, 22(6), 16–21.
    1. Acosta, G. , Hines, A. , & Johnson, J. (2018). Does cognition affect potential benefits of audiologic intervention with OTCs? Paper presented at the American Auditory Society Annual Meeting, Scottsdale, Arizona. Retrieved from http://www.harlmemphis.org/files/1115/2001/8824/OTC_AAS_Poster_Final2.pdf
    1. American National Standards Institute. (2010). Method of measurement of performance characteristics of hearing aids under simulated in-situ working conditions (ANSI S3.35-2010) . New York, NY: Author.
    1. American National Standards Institute. (2012). Methods for calculation of the Speech Intelligibility Index (ANSI S3.5-1997) (R2012) . New York, NY: Author.
    1. Bentler, R. , Palmer, C. , & Mueller, G. H. (2006). Evaluation of a second-order directional microphone hearing aid: I. Speech perception outcomes. Journal of the American Academy of Audiology, 17(3), 179–189. - PubMed

Publication types