. 2018 Nov 20;12(Suppl 5):98.
doi: 10.1186/s12918-018-0616-4.

BioGraph: a web application and a graph database for querying and analyzing bioinformatics resources

Affiliations

BioGraph: a web application and a graph database for querying and analyzing bioinformatics resources

Antonio Messina et al. BMC Syst Biol. .

Abstract

Background: Several online databases provide a large amount of biomedical data of different biological entities. These resources are typically stored in systems implementing their own data model, user interface and query language. On the other hand, in many bioinformatics scenarios there is often the need to use more than one resource. The availability of a single bioinformatics platform that integrates many biological resources and services is, for those reasons a fundamental issue.

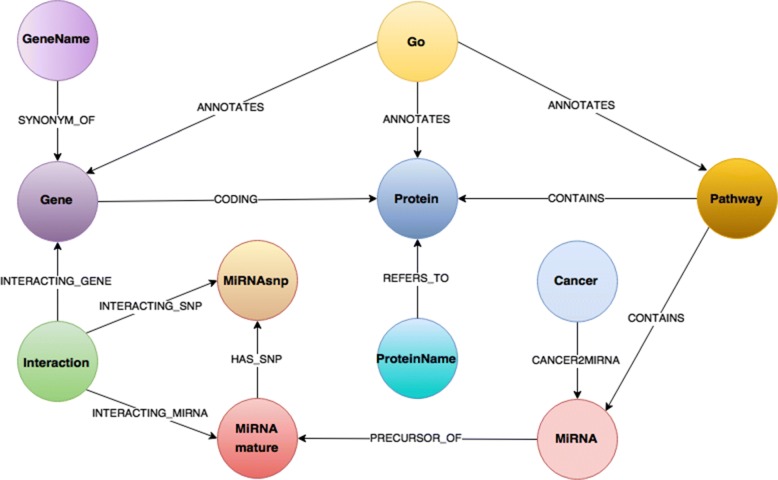
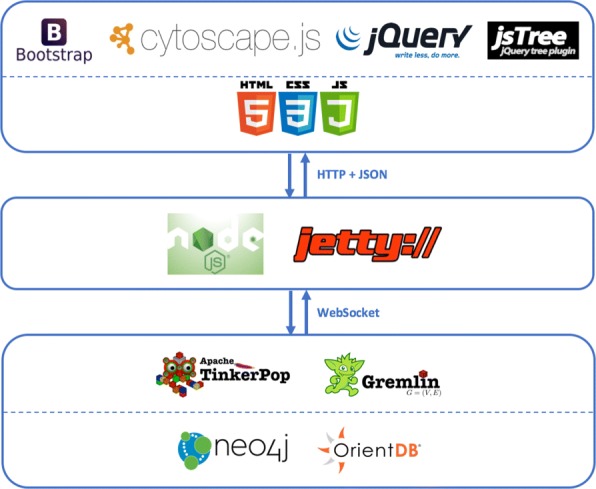
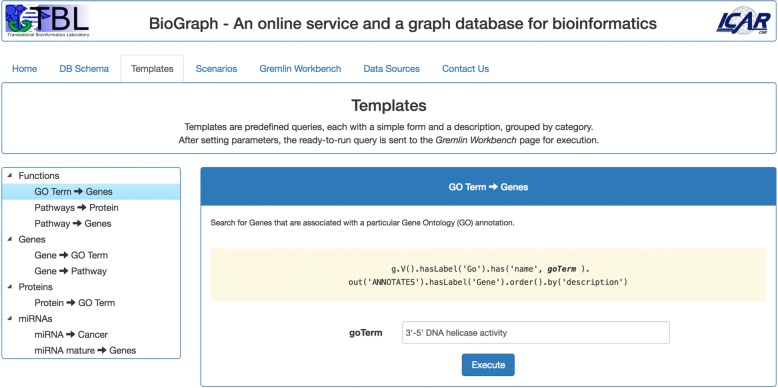
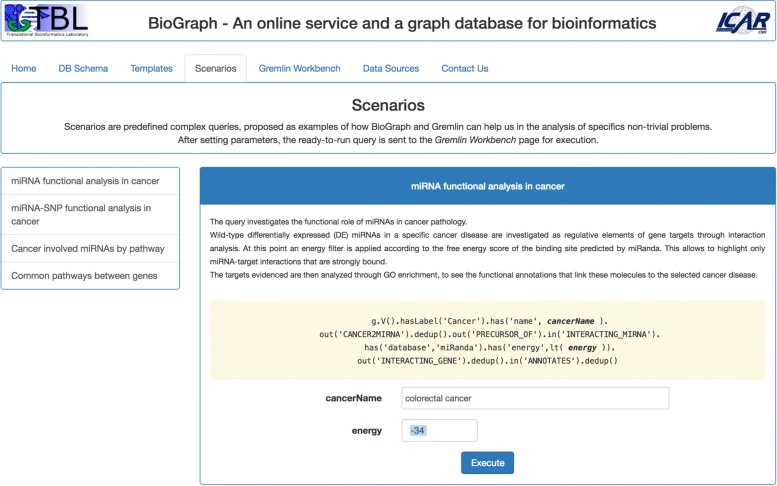
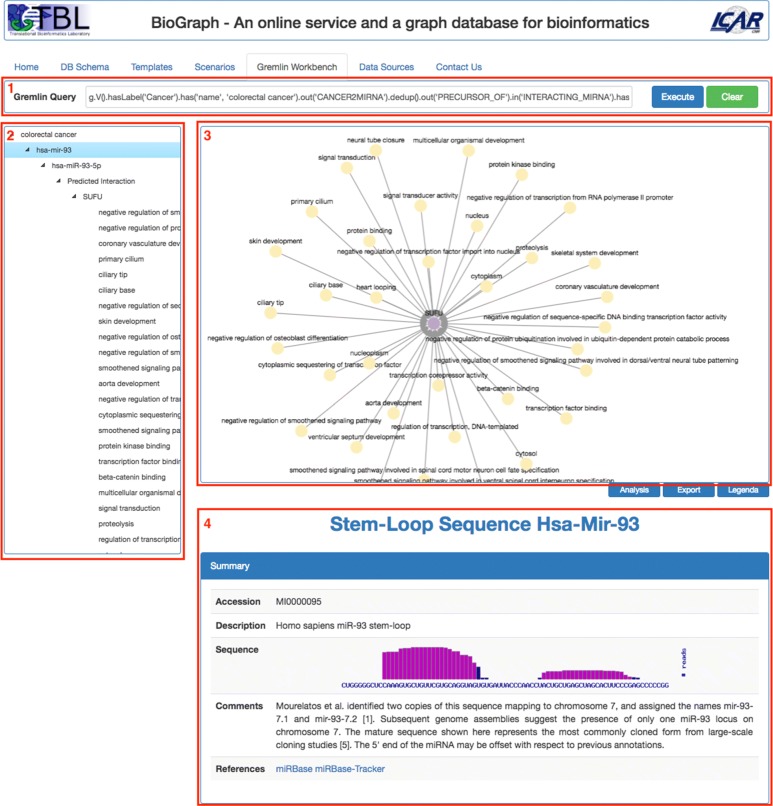
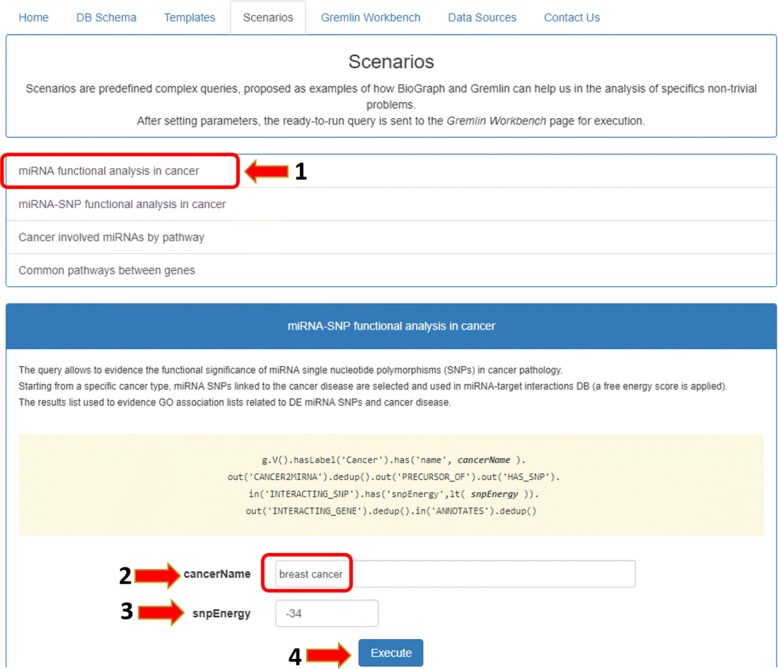
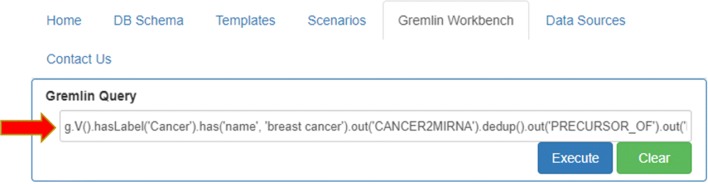
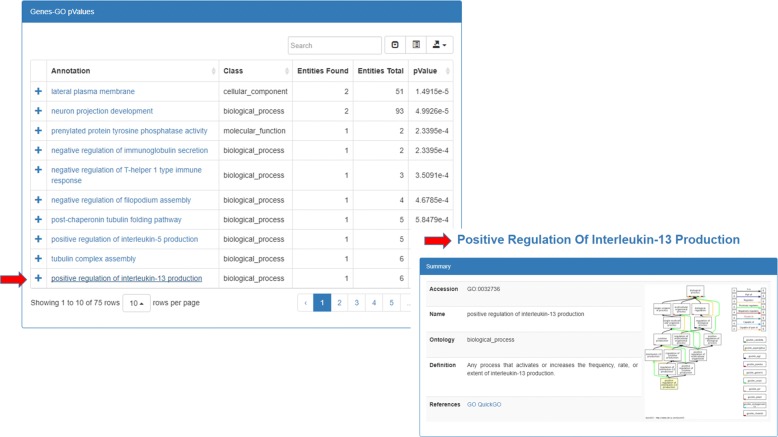
Description: Here, we present BioGraph, a web application that allows to query, visualize and analyze biological data belonging to several online available sources. BioGraph is built upon our previously developed graph database called BioGraphDB, that integrates and stores heterogeneous biological resources and make them available by means of a common structure and a unique query language. BioGraph implements state-of-the-art technologies and provides pre-compiled bioinformatics scenarios, as well as the possibility to perform custom queries and obtaining an interactive and dynamic visualization of results.

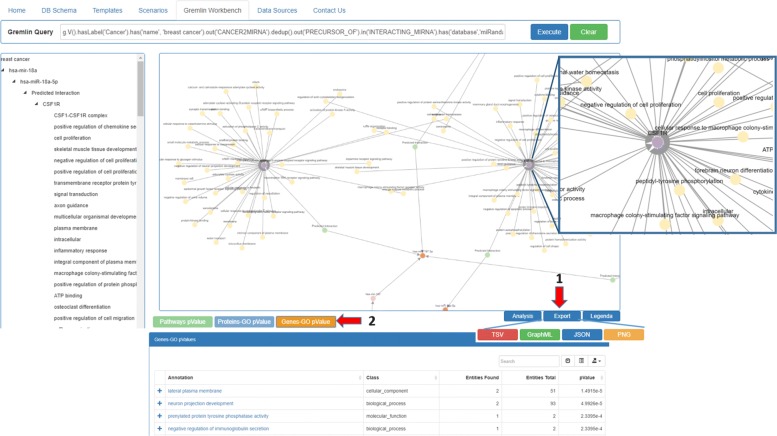
Conclusion: We present a case study about functional analysis of microRNA in breast cancer in order to demonstrate the functionalities of the system. BioGraph is freely available at http://biograph.pa.icar.cnr.it . Source files are available on GitHub at https://github.com/IcarPA-TBlab/BioGraph.

Keywords: BioGraphDB; Bioinformatics databases; Graph databases; Integrated databases; miRNA.


Conflict of interest statement

Ethics approval and consent to participate

Not applicable.

Consent for publication

Not applicable.

Competing interests

The authors declare that they have no competing interests.

Publisher’s Note

Springer Nature remains neutral with regard to jurisdictional claims in published maps and institutional affiliations.

Figures

Fig. 1
Fig. 1
BioGraphDB scheme. The graph data model of BioGraphDB consists of a set of nodes/vertices classes matching the biological entities provided by the used data sources. Relationships between entities are modeled as relations, or edges
Fig. 2
Fig. 2
BioGraph architectural stack. The pictures gives an overview on the state-of-the-art technology behind BioGraph. Used tools are grouped into three levels. From the bottom to the top: the Graph Data level overlooked by Apache Tinkerpop, the Microservices level, and the Web Application level. Protocols and data formats of inter-level communications are also highlighted
Fig. 3
Fig. 3
The Templates tab. Templates are simple predefined queries given as examples of how an user can traverse BioGraphDB. The queries are customizable and grouped by category
Fig. 4
Fig. 4
The Scenarios tab. The four proposed scenarios are examples of how complex Gremlin queries can help in the analysis of non-trivial bioinformatics problems
Fig. 5
Fig. 5
The Gremlin Workbench. It is basically composed of four panes: 1) the Gremlin query pane, 2) Tree View, 3) Graph view-port, 4) the Details pane
Fig. 6
Fig. 6
Case study scenario. The functional analysis of miRNAs in breast cancer can be done starting from the first scenario in the Scenarios tab and personalizing the values of parameters
Fig. 7
Fig. 7
Custom Gremlin query. Gremlin Workbench allows the user to manually type and execute any query he wants
Fig. 8
Fig. 8
Results for the case study scenario. The user can immediately study the results given in graphical and tree form. He can also (1) export them in several formats or (2) perform some data analysis, when applicable
Fig. 9
Fig. 9
GO analysis Analysis of data through p-value calculation. As the figure shows, it is possible to deeply investigate a specific field of the interrogation. In the shown case study figure, it is possible to investigate about a specific annotation linked to a particular gene target

Similar articles

Cited by

References

    1. Reddy KB. MicroRNA (miRNA) in cancer. Cancer Cell Int. 2015;15(1):38. doi: 10.1186/s12935-015-0185-1. - DOI - PMC - PubMed
    1. Hayes J, Peruzzi PP, Lawler S. MicroRNAs in cancer: biomarkers, functions and therapy. Trends Mol Med. 2014;20(8):460–9. doi: 10.1016/j.molmed.2014.06.005. - DOI - PubMed
    1. Vera R, Perez-Riverol Y, Perez S, Ligeti B, Kertesz-Farkas A, Pongor S. JBioWH: an open-source Java framework for bioinformatics data integration. Database. 2013;2013:051. doi: 10.1093/database/bat051. - DOI - PMC - PubMed
    1. Kalderimis A, Lyne R, Butano D, Contrino S, Lyne M, Heimbach J, Hu F, Smith R, Stěpán R, Sullivan J, Micklem G. InterMine: extensive web services for modern biology, Nucleic Acids Res. 2014;42(Web Server issue):468–72. doi: 10.1093/nar/gku301. - DOI - PMC - PubMed
    1. Lyne R, Smith R, Rutherford K, Wakeling M, Varley A, Guillier F, Janssens H, Ji W, Mclaren P, North P, Rana D, Riley T, Sullivan J, Watkins X, Woodbridge M, Lilley K, Russell S, Ashburner M, Mizuguchi K, Micklem G. FlyMine: an integrated database for Drosophila and Anopheles genomics, Genome Biol. 2007;8(7):129. doi: 10.1186/gb-2007-8-7-r129. - DOI - PMC - PubMed