. 2018 Nov 21;10(1):85.
doi: 10.1186/s13073-018-0595-5.

Cell-free DNA profiling of metastatic prostate cancer reveals microsatellite instability, structural rearrangements and clonal hematopoiesis

Affiliations

Cell-free DNA profiling of metastatic prostate cancer reveals microsatellite instability, structural rearrangements and clonal hematopoiesis

Markus Mayrhofer et al. Genome Med. .

Abstract

Background: There are multiple existing and emerging therapeutic avenues for metastatic prostate cancer, with a common denominator, which is the need for predictive biomarkers. Circulating tumor DNA (ctDNA) has the potential to cost-efficiently accelerate precision medicine trials to improve clinical efficacy and diminish costs and toxicity. However, comprehensive ctDNA profiling in metastatic prostate cancer to date has been limited.

Methods: A combination of targeted and low-pass whole genome sequencing was performed on plasma cell-free DNA and matched white blood cell germline DNA in 364 blood samples from 217 metastatic prostate cancer patients.

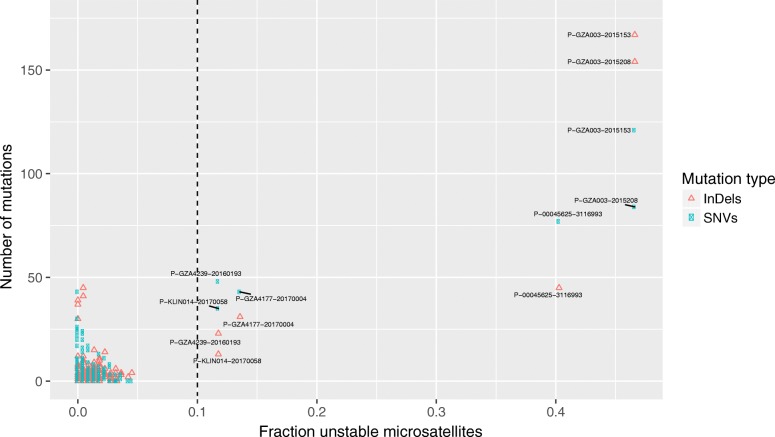
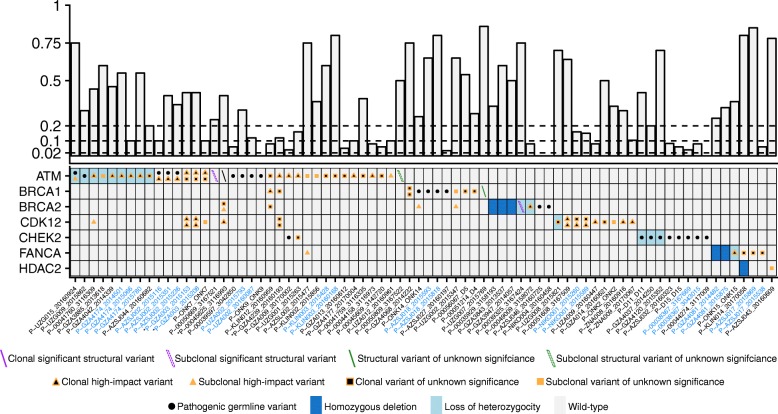
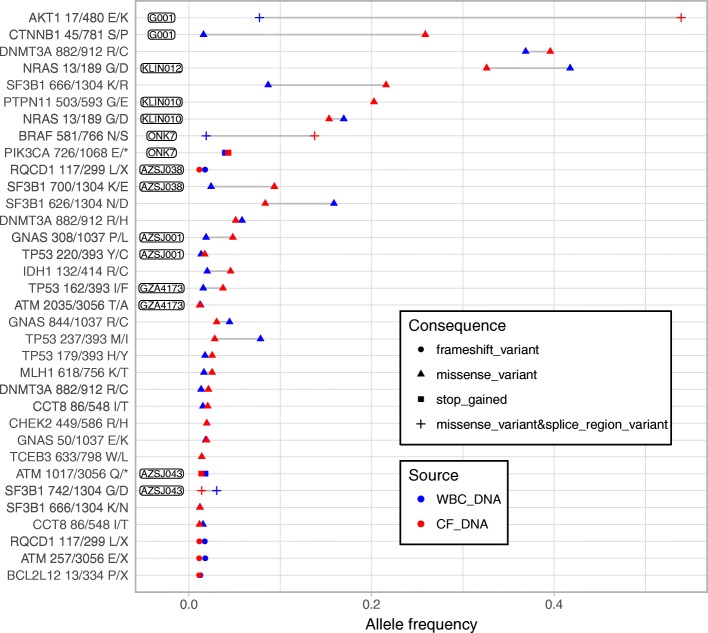
Results: ctDNA was detected in 85.9% of baseline samples, correlated to line of therapy and was mirrored by circulating tumor cell enumeration of synchronous blood samples. Comprehensive profiling of the androgen receptor (AR) revealed a continuous increase in the fraction of patients with intra-AR structural variation, from 15.4% during first-line metastatic castration-resistant prostate cancer therapy to 45.2% in fourth line, indicating a continuous evolution of AR during the course of the disease. Patients displayed frequent alterations in DNA repair deficiency genes (18.0%). Additionally, the microsatellite instability phenotype was identified in 3.81% of eligible samples (≥ 0.1 ctDNA fraction). Sequencing of non-repetitive intronic and exonic regions of PTEN, RB1, and TP53 detected biallelic inactivation in 47.5%, 20.3%, and 44.1% of samples with ≥ 0.2 ctDNA fraction, respectively. Only one patient carried a clonal high-impact variant without a detectable second hit. Intronic high-impact structural variation was twice as common as exonic mutations in PTEN and RB1. Finally, 14.6% of patients presented false positive variants due to clonal hematopoiesis, commonly ignored in commercially available assays.

Conclusions: ctDNA profiles appear to mirror the genomic landscape of metastatic prostate cancer tissue and may cost-efficiently provide somatic information in clinical trials designed to identify predictive biomarkers. However, intronic sequencing of the interrogated tumor suppressors challenges the ubiquitous focus on coding regions and is vital, together with profiling of synchronous white blood cells, to minimize erroneous assignments which in turn may confound results and impede true associations in clinical trials.

Keywords: Circulating tumor DNA; Clonal hematopoiesis; Metastatic prostate cancer; Microsatellite instability; Structural rearrangement.


Conflict of interest statement

Ethics approval and consent to participate

Ethical approval was obtained from ethical committees in Belgium (Antwerp University Hospital, registration number: B300201524217) and Sweden (Stockholm Regional Ethical Vetting Board registration numbers: 2016/101-32, amendment 2017/252-32; 2009/780-31/4, amendment 2014/1564-32). All patients provided a written informed consent document. The study was conducted in accordance with the Declaration of Helsinki.

Consent for publication

All patients additionally consented to have their data published in an anonymous format. Each patient and blood draw were assigned an untraceable number. The sample donor ID represents a unique patient and the sample ID a specific sampling occasion.

Competing interests

The authors declare that they have no competing interests.

Publisher’s Note

Springer Nature remains neutral with regard to jurisdictional claims in published maps and institutional affiliations.

Figures

Fig. 1
Fig. 1
Tumor burden at different lines of therapy. a Violin plot of the circulating tumor cell counts per 7.5 ml of blood using the CellSearch platform partitioned according to line of therapy. The black horizontal lines within the violin plots denote the median of the density estimate. Blue points represent the circulating tumor cell counts in individual blood samples. A one-sided Wilcoxon rank sum test was applied to investigate if the baseline samples of, for example, mCRPC1 had lower tumor burden than mCRPC2. Y-axis: log10 transformed circulating tumor cell counts. X-axis: line of therapy. b as a but for circulating tumor DNA fraction. Y-axis: circulating tumor DNA fraction. In total, 364 blood samples from 217 cases are displayed here; however, only 340/364 had a successful circulating tumor cell count. The dashed lines at 0.02, 0.10, and 0.20 denote the cutoffs to reliably detect point mutations, loss of heterozygosity, and homozygous deletions, respectively. Abbreviations: mHNPC[number], metastatic hormone naïve prostate cancer and line of therapy; mHSPC[number], metastatic hormone-sensitive prostate cancer and line of therapy; mCRPC[number], metastatic castration-resistant prostate cancer and line of therapy; _B, baseline, blood samples collected at start of a new systemic therapy; _F, follow-up, blood samples collected during a systemic therapy; Nbr, number of cell-free DNA samples profiled in each category
Fig. 2
Fig. 2
Detection of microsatellite instability from cell-free DNA. Microsatellite unstable tumors were identified from 121 samples (105 unique patients) with ≥ 0.1 circulating tumor DNA fraction by plotting the number of mutations (Y-axis, including intronic and synonymous variants) versus the fraction of unstable microsatellite loci (X-axis). Indels and single nucleotide variants are kept separate for each sample, colored according to the right legend. The dashed vertical line at 0.10 fraction unstable microsatellites denotes the cutoff to reliably detect microsatellite instability. Two separate cell-free DNA samples were profiled for P-GZA003, and both demonstrated microsatellite instability. Note that although individual P-KLIN014, sample 20170058, demonstrated > 0.1 fraction unstable microsatellite loci, it was classified as microsatellite stable. The sample had a high circulating tumor DNA fraction (0.80), lacked an increase in number of mutations and displayed high copy-number burden, indicative of a chromosomal instability phenotype
Fig. 3
Fig. 3
Exonic and intronic profiling of circulating tumor DNA. The non-repetitive sequence was captured for the entire gene body of TP53, PTEN, and RB1 in 165 cell-free DNA samples from 135 men. The somatic variants found in the 152 cell-free DNA samples from 124 men with detectable circulating tumor DNA are shown here. TMPRSS2-ERG gene fusions or structural rearrangements in TMPRSS2 or ERG are also shown. The upper panel displays the circulating tumor DNA fraction. The dashed lines at 0.02, 0.10, and 0.20 denote the cutoffs to reliably detect point mutations, loss of heterozygosity, and homozygous deletions, respectively. Bottom panel, heatmap of the somatic alterations detected from circulating tumor DNA profiling. Type of alteration is coded according to the bottom legend. For visualization purposes, up to two mutations or structural variants (forward and backslashes) are displayed per patient. Triangles and boxes represent single nucleotide variants and indels, respectively. Subclonal mutations are defined as having an allele frequency < 1/4 of the circulating tumor DNA fraction. The same definition was applied to structural variants after median allele frequency adjustment with respect to the mutations. Synonymous point mutations are not displayed here. Variants of unknown significance are non-synonymous single nucleotide variants outside hotspots, not annotated as pathogenic in variant databases. Structural variants of unknown significance are, for example, confined to a single intron, without affecting neighboring exons. X-axis: cell-free DNA samples sorted according to the circulating tumor DNA fraction. Patients with multiple samples are colored in blue. The asterisk indicates samples with microsatellite instability. Samples described in the main text are connected with lines
Fig. 4
Fig. 4
Androgen receptor alterations. Comprehensive profiling of AR was performed in 275 cell-free DNA samples from 177 mCRPC patients. a The upper panel displays the circulating tumor DNA fraction. The dashed lines at 0.02, 0.10, and 0.20 denote the cutoffs to reliably detect point mutations, loss of heterozygosity, and homozygous deletions, respectively. Bottom panel, heatmap of the mutational landscape detected in the androgen receptor from circulating tumor DNA profiling. Type of alteration is coded according to the bottom legend. For visualization purposes, only samples with an alteration are shown here (126 samples from 89 individuals). Up to two mutations or structural variants (forward and backslashes) are displayed per sample. X-axis: cell-free DNA samples sorted according to the number of alterations detected. Patients with multiple samples are colored in blue. The asterisk indicates samples with microsatellite instability. b The fraction of patients with alterations in the androgen receptor is categorized by type of alteration and line of therapy. Only high-impact mutations, e.g., hotspot mutations, are shown here. Intra-AR structural variation is colored according to the legend in a. The rightmost bar plot represents the fraction of patients with any alteration in the androgen receptor. Abbreviations: mCRPC[number], metastatic castration-resistant prostate cancer and line of therapy; _B, baseline; Nbr, number of samples profiled
Fig. 5
Fig. 5
Alterations in genes associated with DNA repair deficiency. The upper panel displays the circulating tumor DNA fraction. The dashed lines at 0.02, 0.10, and 0.20 denote the cutoffs to reliably detect point mutations, loss of heterozygosity, and homozygous deletions, respectively. Bottom panel, heatmap of the mutational landscape detected from circulating tumor DNA profiling of 327 cell-free DNA samples from 217 individuals. For visualization purposes, only the 76 samples with a relevant alteration are shown here. Type of alteration is coded according to the bottom legend. Up to two mutations or structural variants (forward and backslashes) are displayed per patient. Triangles and boxes represent single nucleotide variants and indels, respectively. Subclonal mutations are defined as having an allele frequency <1/4 of the circulating tumor DNA fraction. The same definition was applied to structural variants after median allele frequency adjustment with respect to the mutations. The BRCA2 structural variant of patient P-00039325, sample 3167424, was classified as borderline subclonal although relevant in the progressing clone after chemohormonal treatment (Additional file 6: Figure S7C). Synonymous point mutations are not displayed here. Variants of unknown significance are non-synonymous single nucleotide variants outside hotspots, not annotated as pathogenic in variant databases. Structural variants of unknown significance are for example confined to a single intron, without affecting neighboring exons. X-axis: cell-free DNA samples sorted according to the number of alterations detected in each gene in alphabetical order. Patients with multiple samples are colored in blue. The asterisk indicates samples with microsatellite instability
Fig. 6
Fig. 6
Clonal hematopoiesis. Presence of clonal expansions in the white blood cell compartment was investigated by somatic mutation (single nucleotide variants and indels) analysis. Somatic mutations, supporting existence of clonal hematopoiesis, were identified in germline DNA extracted from white blood cells by using a pool of healthy donor DNA as reference and subsequently validated in cell-free DNA from the same individual. For each mutation, the amino acid position and total number of amino acids are given. Patients with multiple mutations are labeled with sample donor ID. X-axis: variant allele frequency. Y-axis: individual mutations sorted according to allele frequency in white blood cells and individual. The inset legend explains the type and the source of each variant

References

    1. Ferlay J, Steliarova-Foucher E, Lortet-Tieulent J, Rosso S, Coebergh JWW, Comber H, et al. Cancer incidence and mortality patterns in Europe: estimates for 40 countries in 2012. Eur J Cancer. 2013;49:1374–1403. doi: 10.1016/j.ejca.2012.12.027. - DOI - PubMed
    1. Beer TM, Armstrong AJ, Rathkopf DE, Loriot Y, Sternberg CN, Higano CS, et al. Enzalutamide in metastatic prostate cancer before chemotherapy. N Engl J Med. 2014;371:424–433. doi: 10.1056/NEJMoa1405095. - DOI - PMC - PubMed
    1. de Bono JS, Logothetis CJ, Molina A, Fizazi K, North S, Chu L, et al. Abiraterone and increased survival in metastatic prostate cancer. N Engl J Med. 2011;364:1995–2005. doi: 10.1056/NEJMoa1014618. - DOI - PMC - PubMed
    1. Scher HI, Fizazi K, Saad F, Taplin M-E, Sternberg CN, Miller K, et al. Increased survival with enzalutamide in prostate cancer after chemotherapy. N Engl J Med. 2012;367:1187–1197. doi: 10.1056/NEJMoa1207506. - DOI - PubMed
    1. Ryan CJ, Smith MR, de Bono JS, Molina A, Logothetis CJ, de Souza P, et al. Abiraterone in metastatic prostate cancer without previous chemotherapy. N Engl J Med. 2013;368:138–148. doi: 10.1056/NEJMoa1209096. - DOI - PMC - PubMed

Publication types