. 2019 Jan 3;37(1):113-122.
doi: 10.1016/j.vaccine.2018.11.024. Epub 2018 Nov 17.

Interferon gamma (IFN-γ) negative CD4+ and CD8+ T-cells can produce immune mediators in response to viral antigens

Affiliations

Interferon gamma (IFN-γ) negative CD4+ and CD8+ T-cells can produce immune mediators in response to viral antigens

Ritah Nakiboneka et al. Vaccine. .

Abstract

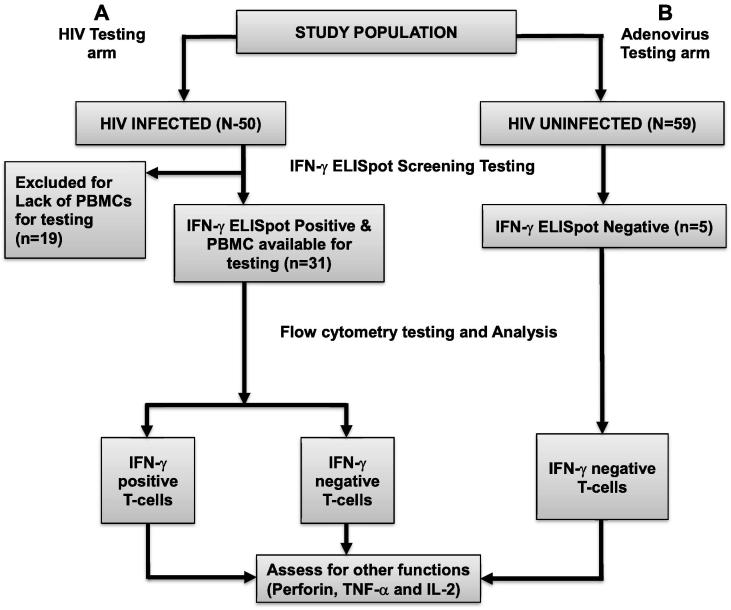
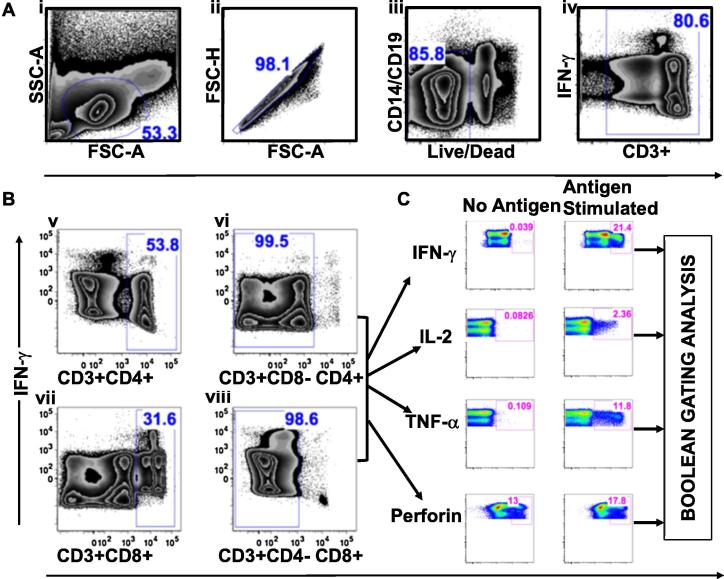
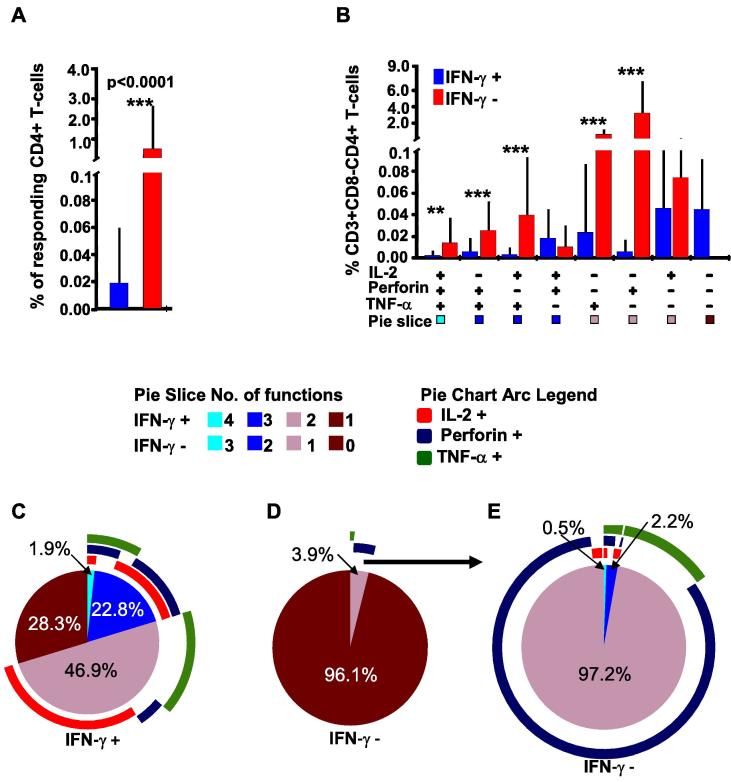
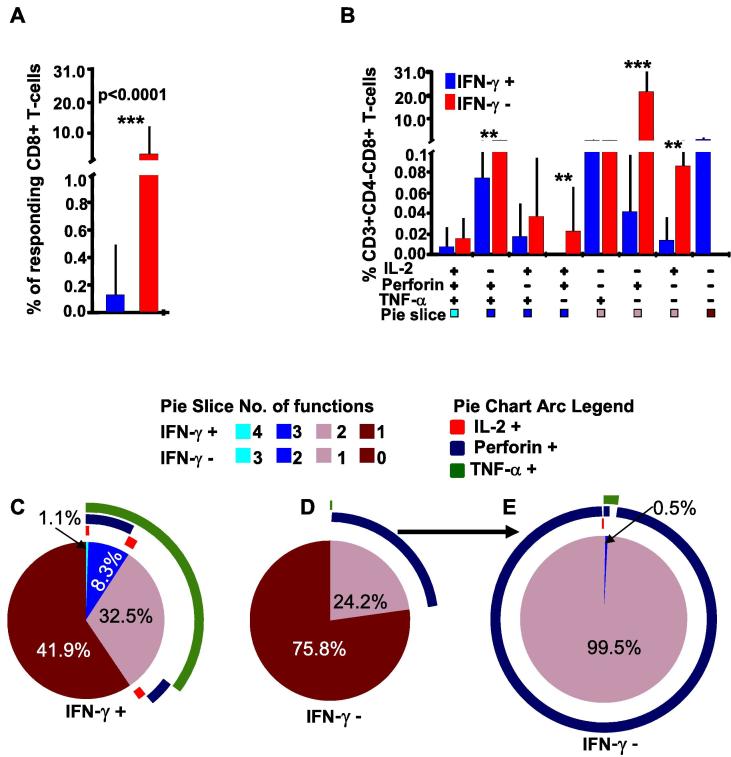
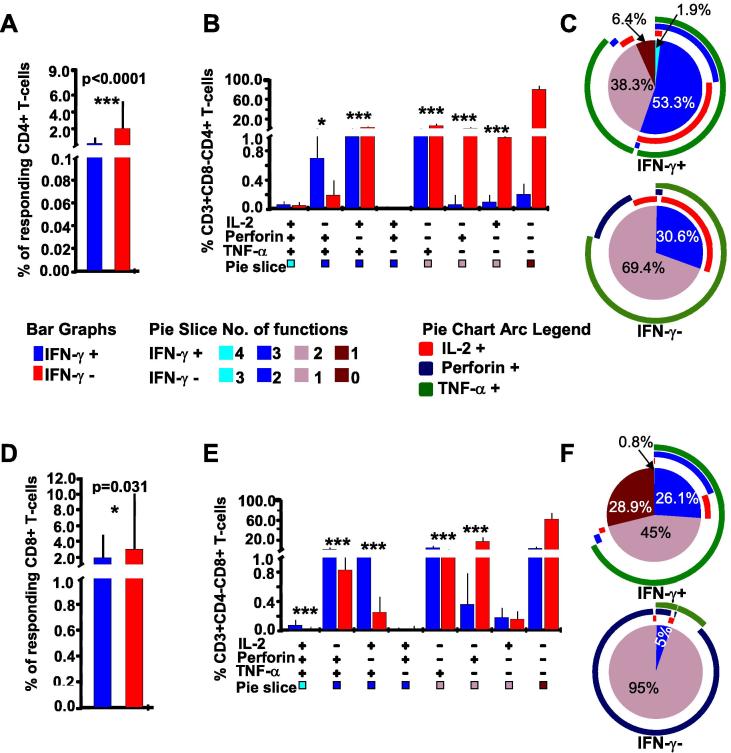
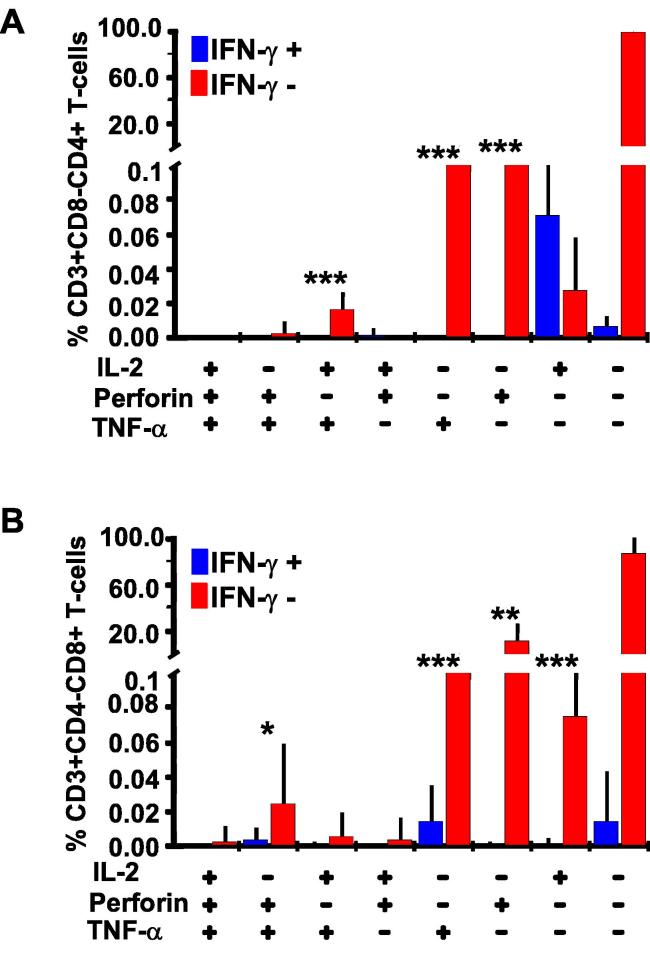
Evaluation of antigen-specific T-cell responses to viral antigens is frequently performed on IFN-γ secreting cells. However, T-cells are capable of producing many more functions than just IFN-γ, some of which, like Perforin, are associated with immune protection in HIV-1 disease elite controllers. We evaluated the extent of missed T-cell functions when IFN-γ secretion is used as a surrogate marker for further evaluation of T-cell functions. Intracellular cytokine staining assay and flow cytometry were used to assess peripheral blood mononuclear cells (PBMCs) from 31 HIV-infected ART-naive individuals for the extent to which gated CD4+ and CD8+ IFN-γ producing and non-producing T-cells also secreted IL-2, Perforin, and TNF-α functions. Similarly, the extent of missed virus-specific responses in IFN-γ ELISpot assay negative T-cells from 5 HIV-1 uninfected individuals was evaluated. Cells from HIV-infected individuals were stimulated with pooled consensus group M (Con M) peptides; and those from healthy individuals were stimulated with pooled adenovirus (Ad) peptides. Overall, frequencies of virus-specific IFN-γ secreting CD4+ and CD8+ cells were low. Proportions of IFN-γ negative CD4+ expressing IL-2, Perforin, or TNF-α to Con M were significantly higher (5 of 7 functional profiles) than the corresponding IFN-γ positive CD4+ (0 of 7) T-cell phenotype, p = 0.02; Fisher's Exact test. Likewise, proportions of CD8+ T-cells expressing other functions were significantly higher in 4 of the 7 IFN-γ negative CD8+ T-cells. Notably, newly stimulated Perforin, identified as Perforin co-expression with IL-2 or TNF-α, was significantly higher in IFN-γ negative CD8+ T-cell than in the positive CD8+ T-cells. Using SEB, lower responses in IFN-γ positive cells were most associated with CD4+ than CD8+ T-cells. These findings suggest that studies evaluating immunogenicity in response to HIV and Adenovirus viral antigens should not only evaluate T-cell responsiveness among IFN-γ producing cells but also among those T-cells that do not express IFN-γ.

Keywords: ELISpot assay; Flow cytometry; HIV-1; IFN-γ negative T-cells; T-cell responses; Vaccines.


Figures

Fig. 1
Fig. 1
Model for selection and evaluation of specimens for antigen-specific T-cell immune responses. This figure illustrates the screening for T-cell responses using the Interferon gamma (IFN-γ) ELISpot assay, and subsequent use of flow cytometry to evaluate co-expressing responses. Arm A denotes stimulation of PBMCs from HIV-1 infected individuals with consensus group M peptides. After flow cytometry, T-cells in Arm A were stratified into IFN-γ secreting (IFN-γ positive) and non-secreting (IFN-γ negative) populations. Secretion of other T-cell functions (Perforin, TNF-α and IL-2) was then compared across the two groups. Arm B comprised healthy HIV-1 uninfected individuals, serologically reactive to Adenovirus by antibody testing, but IFN-γ ELISpot negative to Adenovirus peptide stimulation. The IFN-γ negative T-cells were assessed for expression of Adenovirus-specific Perforin, TNF-α,and IL-2 using flow cytometry.
Fig. 2
Fig. 2
Gating strategy for defining antigen-specific T-cell functions using flow cytometry. This figure summarizes procedures for demarcating antigen-specific T-cells using FlowJo software, FlowJo, LLC. (i) First, lymphocytes were identified; (ii) plotted on forward scatter height (FSC-H) against forward scatter area (FSC-A) to select single cells, (iii) subjected to CD14, CD19, and Aqua antibody exclusion to remove B-cells, monocytes, and dead cells, respectively, (iv) before gating out CD3+ lymphocytes, A. Double positive T cells (CD3+CD4+CD8+) were excluded, while CD4+ (CD3+CD8−CD4+) and CD8+ (CD3+CD4−CD8+) T cells were selected for subsequent evaluations, B. Secretion of IFN-γ, IL-2, TNF-α, and Perforin was then quantified using cytokine-specific plots derived from FlowJo software, C. Finally, the co-expressed T cell functions were further distinguished into singly expressed, concurrently expressed, and non-functional subsets using FlowJo generated Boolean gating.
Fig. 3
Fig. 3
IFN-γ negative T-cells from HIV infected individuals’ can produce detectable IL-2, TNF-α and/or Perforin. This figure compares IFN-γ positive and negative T-cells for frequencies of co-expressed T-cell functions after stimulation with HIV-1 consensus M (Con M) Gag antigens. FlowJo™ generated booleans were uploaded onto Pestle™ software to subtract backgrounds; and SPICE™ software, version 5.1 (NIAID) to stratify the CD4+ T-cells into IFN-γ positive and negative cells (IFN-γ overlaying). The T-cell responses were graphically summarized into eight functional combinations of IFN-γ secreting (red) and non-secreting (blue) cells using SPICE™, A, and B. Plus (+) and minus (−) signs below the x-axis indicate presence or absence of the specified function(s), respectively. Bars represent the frequencies (%) of expressed function(s) by the parent cells; and error bars represent their standard deviations. P values of ≤0.05 were considered statistically significant, and were denoted with * sign above the bars to indicate p-values ≤ 0.05, ** to indicate p-values ≤ 0.01, and *** to indicate p-values of ≤0.001. Bonferroni adjustment for multiple testing was applied when responses were compared across the functional combinations, in that case, P values of ≤0.0071 were considered significant. Cells that did not secrete any of the evaluated responses have been excluded to ease clarity. The y-axis has been cut for better visual presentation of the data, B. The pie charts summarize frequencies of indicated CD4+ T-cell functions in IFN-γ positive cells (C); in IFN-γ negative including non-secreting cells (D), and the IFN-γ negative without non-secreting cells (E). Pie arcs represent individual contributions of specified functions to the total T-cell response.
Fig. 4
Fig. 4
Some IFN-γ negative CD8+ T-cells express high proportions of Perforin, TNF-α and/or IL2 functions. This figure compares frequencies of co-expressed CD8+ T-cell functions in IFN-γ positive and negative cells in response to HIV-1 Con M stimulation, A. FlowJo derived CD8+ T-cell booleans were stratified as 8 distinct combinations of IFN-γ secreting (red) and non-secreting (blue) functional profiles using SPICETM software, version 5.1 (NIAID). Positive signs (+) below the x-axis indicate presence of specified function(s), and negative signs indicate absence of that function. The bars represent frequencies (%) of parent T-cells expressing a specified combination of functions; error bars represent standard deviations. P values of ≤0.05 were considered statistically significant, and were denoted with a* sign above the bars to indicate p-values ≤0.05, ** to indicate p values ≤0.01, and *** to indicate p values ≤0.001. Bonferroni adjustment was applied to compare responses across subgroups, in such cases P values of ≤0.0071 were considered significant. Cells that did not secrete any functions have been excluded to improve clarity. The y-axis has been cut to improve visual presentation of the data, B. Cell populations were also summarized as pie charts with IFN-γ response overlaid, to illustrate frequencies of CD8+ T-cells that are secreting IFN-γ (C); CD8+ T –cells that are IFN-γ negative including non-secreting cells, (D), and IFN-γ negative CD8+ T-cells without the non-secreting cells E. Pie arcs represent the individual contribution of each function to the total T-cell response.
Fig. 5
Fig. 5
T-cells from HIV-Infected individuals were capable of secreting high frequencies of SEB-stimulated T-cell responses. This figure summarizes the overall SEB-stimulated IFN-γ positive (blue) and negative (red) CD4+ T-cell responses, (A) The cells stratified into eight functional combinations of IFN-γ positive and negative cells, with bars representing frequencies (%) of expressed IL-2, TNF-α, and Perforin functions, and error bars the standard deviations. P values ≤ 0.05 are considered statistically significant, and are denoted with a * sign above the bars to indicate p-values ≤ 0.05; ** indicates p values ≤ 0.01 and *** indicates p values ≤ 0.001, (B) Pie charts summarize the proportions of functions in IFN-γ positive (upper C) and negative CD4+ T-cells (lower C). Pie arcs represent contributions of each function to the total response. Similarly, frequencies of IFN-γ positive and negative CD8+ T-cells are shown (D), distributed into eight profiles of functions (E), and summarized as pie charts and pie arcs, F.
Fig. 6
Fig. 6
T-cell responses were detectable in some ELISpot assay screen-out IFN-γ negative cells from healthy volunteers. This figure illustrates T-cell responses detected in PBMCs from healthy individuals that were initially screened as IFN-γ ELISpot assay negative to Adenovirus peptides. These PBMCs were then stimulated with Adenovirus antigens for the co-expression of IL-2, TNF-α, and Perforin T-cell functions using flow cytometry. Bars indicate proportions of expressed IL-2, Perforin, and TNF-α in CD4+ T-cells, error bars indicate standard deviations (A). Positive signs below the x-axis indicate presence of specified function(s); and negative signs indicate absence of the specified function(s). Responses in IFN-γ positive and IFN-γ negative CD8+ T-cells are similarly shown in B.

References

    1. Goonetilleke N., Liu M.K., Salazar-Gonzalez J.F., Ferrari G., Giorgi E., Ganusov V.V. The first T-cell response to transmitted/founder virus contributes to the control of acute viremia in HIV-1 infection. J Exp Med. 2009;206:1253–1272. - PMC - PubMed
    1. Jin X., Bauer D.E., Tuttleton S.E., Lewin S., Gettie A., Blanchard J. Dramatic rise in plasma viremia after CD8(+) T-cell depletion in simian immunodeficiency virus-infected macaques. J Exp Med. 1999;189:991–998. - PMC - PubMed
    1. Altfeld M., Addo M.M., Shankarappa R., Lee P.K., Allen T.M., Yu X.G. Enhanced detection of human immunodeficiency virus type 1-specific T-cell responses to highly variable regions by using peptides based on autologous virus sequences. J Virol. 2003;77:7330–7340. - PMC - PubMed
    1. Buchbinder S.P., Mehrotra D.V., Duerr A., Fitzgerald D.W., Mogg R., Li D. Efficacy assessment of a cell-mediated immunity HIV-1 vaccine (the Step Study): a double-blind, randomised, placebo-controlled, test-of-concept trial. Lancet. 2008;372:1881–1893. - PMC - PubMed
    1. Boulet S., Ndongala M.L., Peretz Y., Boisvert M.P., Boulassel M.R., Tremblay C. A dual color ELISPOT method for the simultaneous detection of IL-2 and IFN-gamma HIV-specific immune responses. J Immunol Methods. 2007;320:18–29. - PMC - PubMed

Publication types

MeSH terms