. 2018 Nov 20;50(11):1-12.
doi: 10.1038/s12276-018-0182-2.

A small molecule approach to degrade RAS with EGFR repression is a potential therapy for KRAS mutation-driven colorectal cancer resistance to cetuximab

Affiliations

A small molecule approach to degrade RAS with EGFR repression is a potential therapy for KRAS mutation-driven colorectal cancer resistance to cetuximab

Sang-Kyu Lee et al. Exp Mol Med. .

Abstract

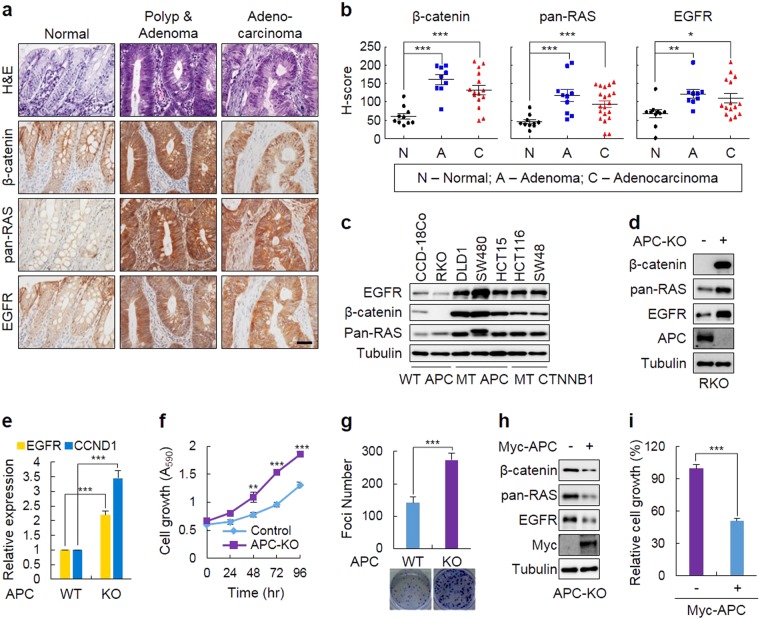
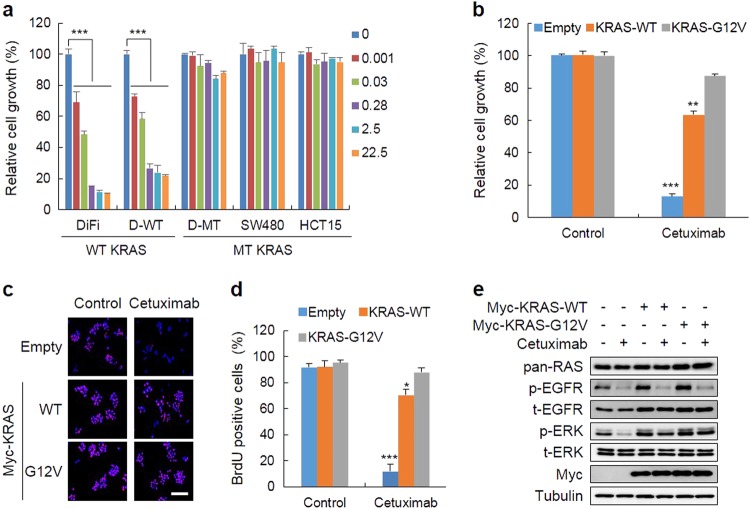
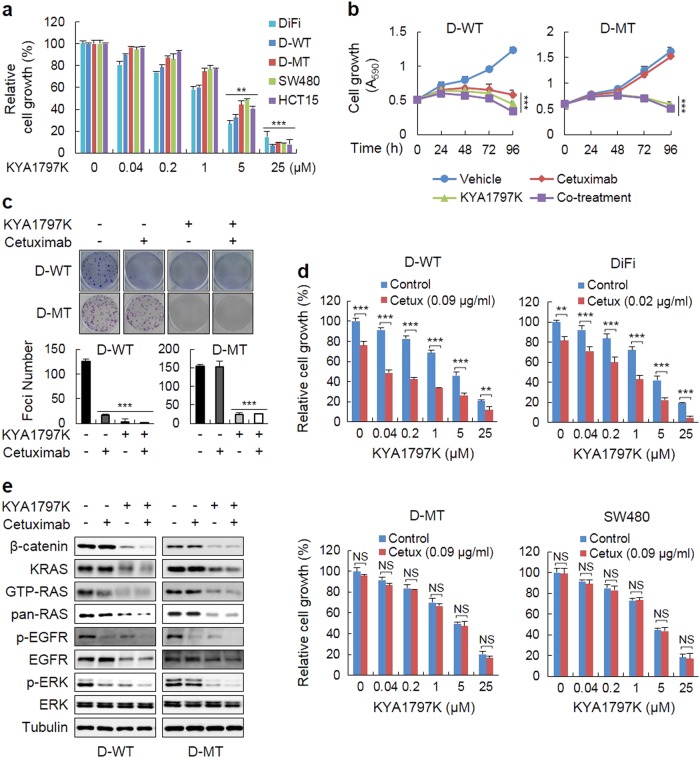
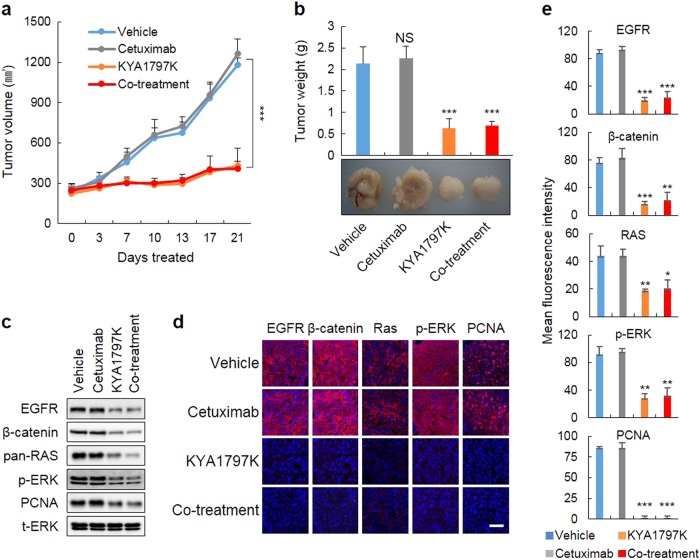
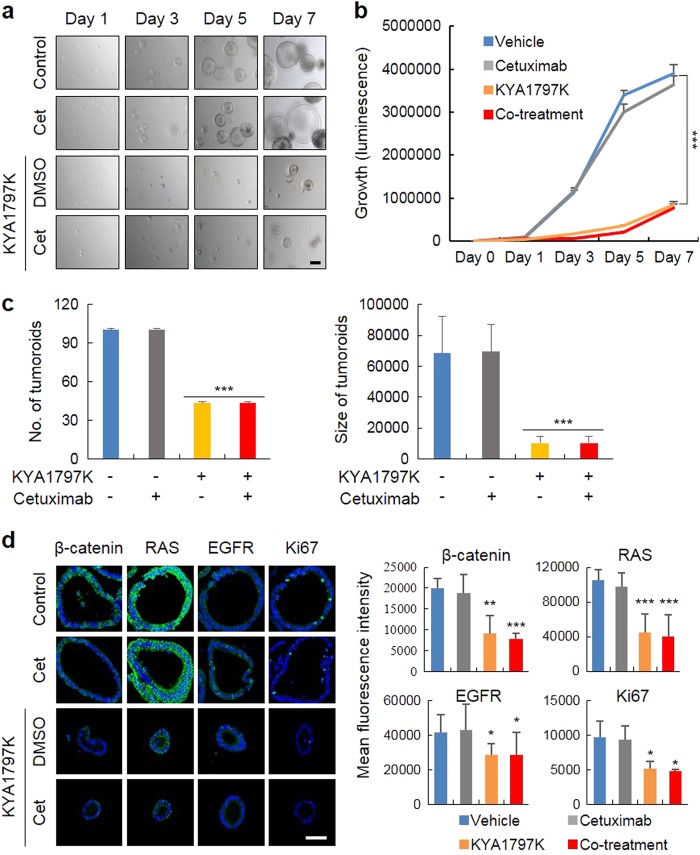
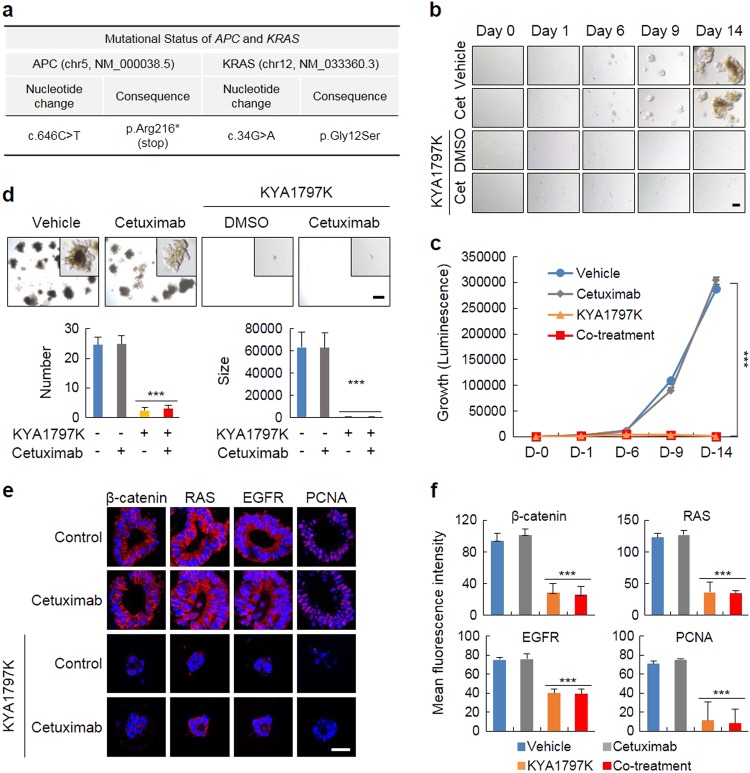
Drugs targeting the epidermal growth factor receptor (EGFR), such as cetuximab and panitumumab, have been prescribed for metastatic colorectal cancer (CRC), but patients harboring KRAS mutations are insensitive to them and do not have an alternative drug to overcome the problem. The levels of β-catenin, EGFR, and RAS, especially mutant KRAS, are increased in CRC patient tissues due to mutations of adenomatous polyposis coli (APC), which occur in 90% of human CRCs. The increases in these proteins by APC loss synergistically promote tumorigenesis. Therefore, we tested KYA1797K, a recently identified small molecule that degrades both β-catenin and Ras via GSK3β activation, and its capability to suppress the cetuximab resistance of KRAS-mutated CRC cells. KYA1797K suppressed the growth of tumor xenografts induced by CRC cells as well as tumor organoids derived from CRC patients having both APC and KRAS mutations. Lowering the levels of both β-catenin and RAS as well as EGFR via targeting the Wnt/β-catenin pathway is a therapeutic strategy for controlling CRC and other types of cancer with aberrantly activated the Wnt/β-catenin and EGFR-RAS pathways, including those with resistance to EGFR-targeting drugs attributed to KRAS mutations.


Conflict of interest statement

The authors declare that they have no conflict of interest.

Figures

Fig. 1
Fig. 1. The levels of β-catenin, RAS, and EGFR are increased by APC mutations and correlate with the growth and transformation of CRC cells.
a Immunohistochemical (IHC) analysis of β-catenin, RAS, or EGFR in the CRC patient tissue microarrays (TMAs) containing normal, polyp/adenoma, and adenocarcinoma. Scale bar, 50 µm. b The quantitative analyses of positive signals in the IHC images were performed by comparing the H-scores of staining for β-catenin, RAS, or EGFR in normal tissues and at different stages of colorectal tumorigenesis. Normal mucosa (n = 10), polyp/adenoma (n = 9), and adenocarcinoma (n = 15). c Immunoblot (IB) analysis to detect β-catenin, RAS, and EGFR in various CRC cell lines harboring different mutations of APC or CTNNB1. d–g The effects of APC knockout (KO) on the expression of β-catenin, RAS or EGFR and on cell growth/transformation. The APC-KO RKO cells and RKO cells expressing the control vector alone were grown, and IB analyses were performed with whole cell lysates (WCLs) to detect each protein (d). Quantitative polymerase chain reaction (qPCR) assays were performed to determine the expression of the EGFR and CCND1 mRNAs (e). 3-(4,5-Dimethylthiazol-2yl)-2-5-diphenyltetrazolium bromide (MTT) assays (f) were performed for measurements of cell growth, and foci formation assays (g) were performed to detect cellular transformation. h, i The effects of overexpression of APC. The APC-KO RKO cells were transfected with Myc-tagged APC for 36 h, and the WCLs were subjected to IB analysis (h). The relative cell growth was measured by the MTT assay (i). The data are presented as the mean ± SD. Two-sided Student’s t-test, *P<0.05, **P<0.005, and ***P<0.001
Fig. 2
Fig. 2. The overexpression of WT KRAS, as well as the mutant form, contributes to the resistance to cetuximab.
a MTT assays were performed to determine the effects of cetuximab on the growth of various CRC cells treated with the indicated doses of cetuximab for 96 h. b–e The effects of the overexpression of KRAS WT or oncogenic mutant G12V on cell growth. The D-WT cells stably expressing Myc-KRAS-WT, -G12V, or empty vector were treated with 5 µg/mL cetuximab for 96 h. MTT (b) and bromodeoxyuridine (BrdU) incorporation (c, d) assays were performed to measure cell proliferation. Scale bar, 100 µm. The WCLs were subjected to IB analyses (e). The data are presented as the mean ± SD (n = 3). Two-sided Student’s t-test, *P<0.05, **P<0.005, and ***P<0.001
Fig. 3
Fig. 3. KYA1797K overcomes the resistance to cetuximab attributed to KRAS mutations on the growth and transformation of CRC cells.
a MTT assays were performed to determine the effects of KYA1797K on the growth of various CRC cells treated with the indicated doses of KYA1797K for 96 h. b, c The D-WT or D-MT cells were treated with vehicle, 25 µM KYA1797K, 5 µg/mL cetuximab, or were co-treated with both for the indicated time periods. The growth and transformation of the D-WT or D-MT cells were monitored by MTT (b) and foci formation (c) assays, respectively. d MTT assays were performed to determine the combined effect of KYA1797K and cetuximab in D-WT, DiFi, D-MT, and SW480 cells co-treated with the indicated doses of KYA1797K and cetuximab for 96 h. e IB analysis of D-WT or D-MT cells treated under the indicated conditions for 24 h. Glutathione-S-transferase (GST)-Raf-1 RAS-binding domain (RBD) pull-down assays were performed to detect active RAS (GTP-RAS). The data are presented as the mean ± SD (n = 3). Two-sided Student’s t-test, **P<0.005, and ***P<0.001. NS not significant
Fig. 4
Fig. 4. KYA1797K overcomes the resistance to cetuximab attributed to KRAS mutations on tumor xenograft growth.
a D-MT cells were subcutaneously injected into nude mice with the subsequent intraperitoneal (i.p.) injection of vehicle, 20 mg/kg KYA1797K, 1 mg/mouse cetuximab, or a combination of KYA1797K (20 mg/kg) and cetuximab (1 mg/mouse) for 21 days. The tumor volumes were measured every 3 days. b The measurement of tumor weights (b, upper panel) and the visualization of tumor images (b, lower panel) were performed at the time of killing. c WCLs prepared from the tumor tissues were subjected to IB analysis. d IHC analysis of the tissue sections incubated with the indicated antibodies and then counterstained with 4′,6-diamidino-2-phenylindole (DAPI). Scale bar, 50 µm. e The levels of the proteins were measured by the mean fluorescence intensity. The data are presented as the mean ± SD (n = 5). Two-sided Student’s t-test, *P<0.05, **P<0.005, and ***P<0.001. NS not significant
Fig. 5
Fig. 5. The effectiveness of KYA1797K on the formation and growth of tumor organoids from the small intestine of ApcMin/+/KrasG12DLA2 mice.
The tumor organoids from the small intestine of ApcMin/+/KrasG12DLA2 mice were cultured as described in the materials and methods section. The tumor organoids were cultured and treated under the indicated conditions for 7 days. a, b The images of the tumor organoids were visualized (a, scale bar, 200 µm), and the growth of the tumor organoids was measured by a cell titer assay (b). c The numbers (left) and sizes (right) of the tumor organoids were quantified. d Immunocytochemical (ICC) analysis of β-catenin, pan-RAS, EGFR, and Ki67 in the tumor organoids treated under the indicated conditions for 7 days. The tumor organoids were immobilized, immunostained with each antibody, and counterstained with DAPI (d, left panel). Scale bar, 50 µm. The levels of these proteins were measured by the mean fluorescence intensity (d, right panel). The data are presented as the mean ± SD (n = 3). Two-sided Student’s t-test, *P<0.05, **P<0.005, and ***P<0.001
Fig. 6
Fig. 6. KYA1797K effectively suppresses the formation and growth of tumor organoids derived from CRC patients having both APC and KRAS mutations.
a The tumor organoids derived from the CRC patient tissue were cultured as described in the materials and methods section and analyzed by whole exome sequencing to determine the mutational status of the genes of interest, including KRAS and APC. b, c The tumor organoids were treated under the indicated conditions for 14 days. The tumor organoids were visualized (b, scale bar, 200 µm), and the growth of the tumor organoids was measured by a cell titer assay (c). d Images of the tumor organoids treated with the indicated conditions for 21 days were captured at low magnification (upper panel, scale bar, 1 mm), and high-magnification images were visualized in the boxed region (inset). The number and size of the tumor organoids were quantified (d, lower panel). e ICC analysis of β-catenin, pan-RAS, EGFR, or PCNA in the tumor organoids cultured under the indicated conditions for 14 days. The tumor organoids were immobilized and then immunostained with antibodies. Scale bar, 50 µm. f The levels of these proteins were measured by the mean fluorescence intensity. The data are presented as the mean ± SD (n = 3). Two-sided Student’s t-test, ***P< 0.001

Similar articles

Cited by

References

    1. Downward J. Targeting RAS signalling pathways in cancer therapy. Nat. Rev. Cancer. 2003;3:11–22. doi: 10.1038/nrc969. - DOI - PubMed
    1. Kinzler KW, Vogelstein B. Lessons from hereditary colorectal cancer. Cell. 1996;87:159–170. doi: 10.1016/S0092-8674(00)81333-1. - DOI - PubMed
    1. D’Abaco GM, Whitehead RH, Burgess AW. Synergy between Apc min and an activated ras mutation is sufficient to induce colon carcinomas. Mol. Cell. Biol. 1996;16:884–891. doi: 10.1128/MCB.16.3.884. - DOI - PMC - PubMed
    1. Horst D, et al. Differential WNT activity in colorectal cancer confers limited tumorigenic potential and is regulated by MAPK signaling. Cancer Res. 2012;72:1547–1556. doi: 10.1158/0008-5472.CAN-11-3222. - DOI - PMC - PubMed
    1. Sansom OJ, et al. Loss of Apc allows phenotypic manifestation of the transforming properties of an endogenous K-ras oncogene in vivo. Proc. Natl Acad. Sci. USA. 2006;103:14122–14127. doi: 10.1073/pnas.0604130103. - DOI - PMC - PubMed

Publication types

MeSH terms