. 2018 Nov 20;8(1):17078.
doi: 10.1038/s41598-018-35188-8.

IL-23R Signaling Plays No Role in Myocardial Infarction

Affiliations

IL-23R Signaling Plays No Role in Myocardial Infarction

Erika Engelowski et al. Sci Rep. .

Abstract

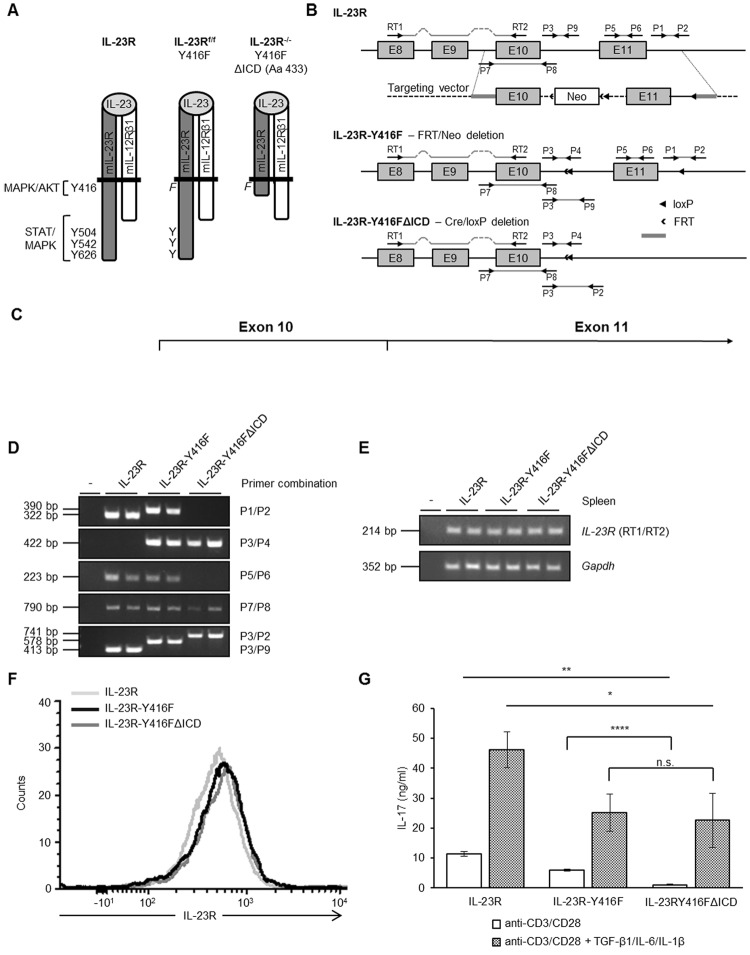
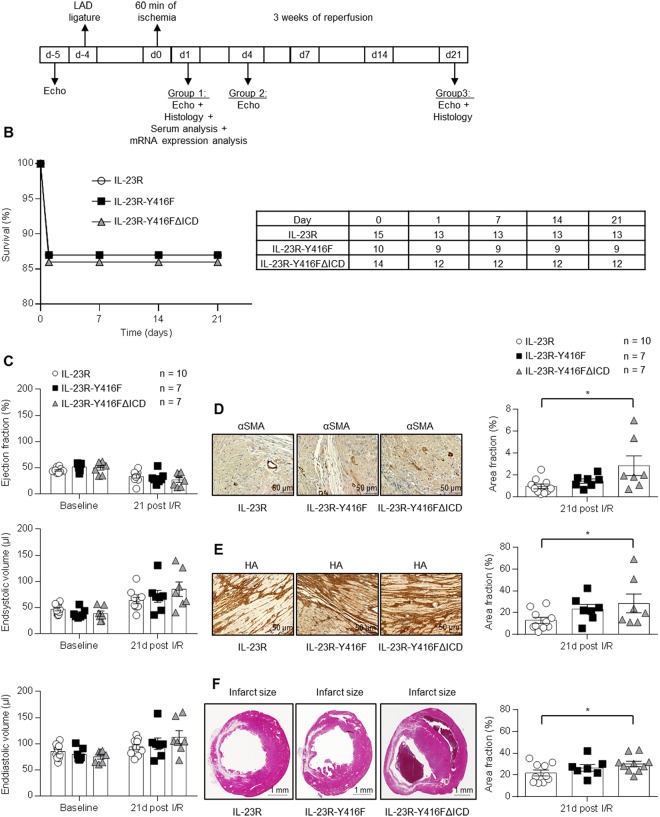
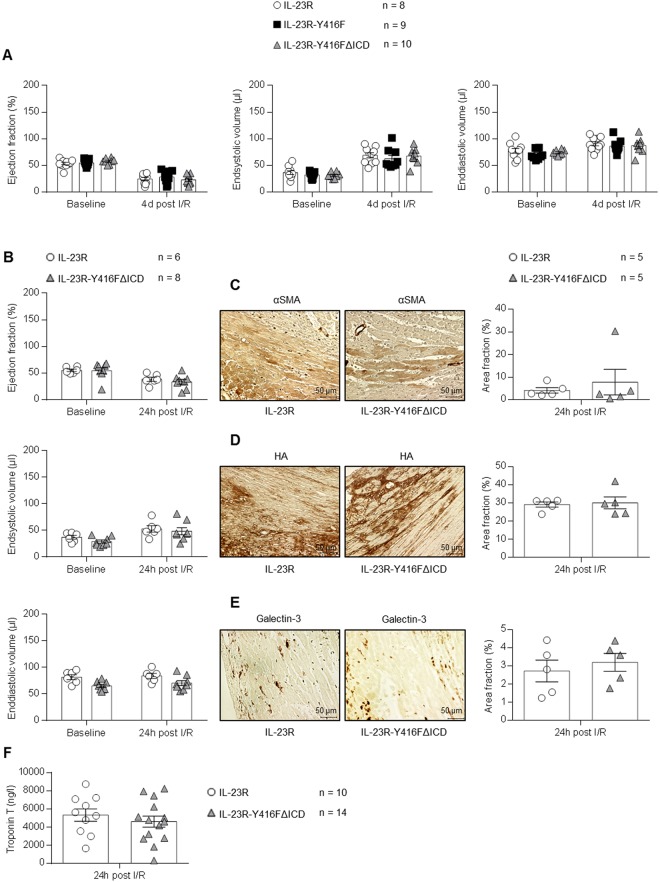
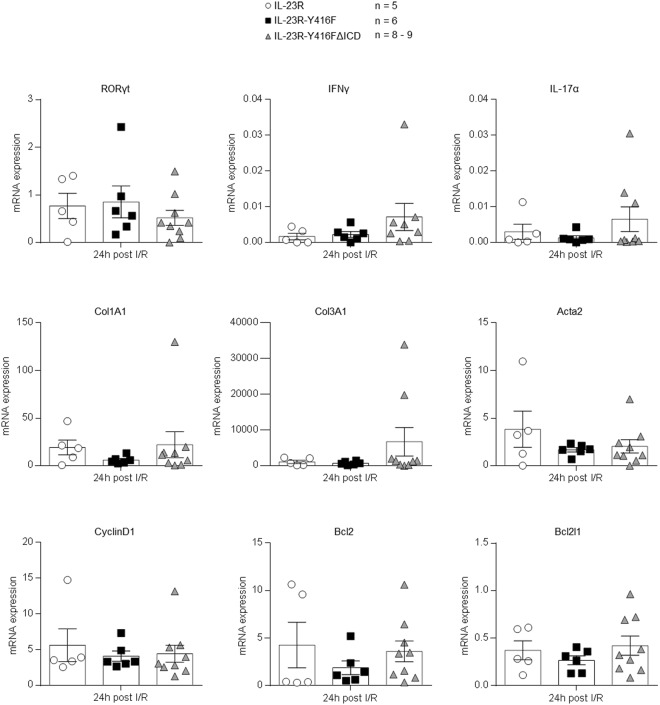
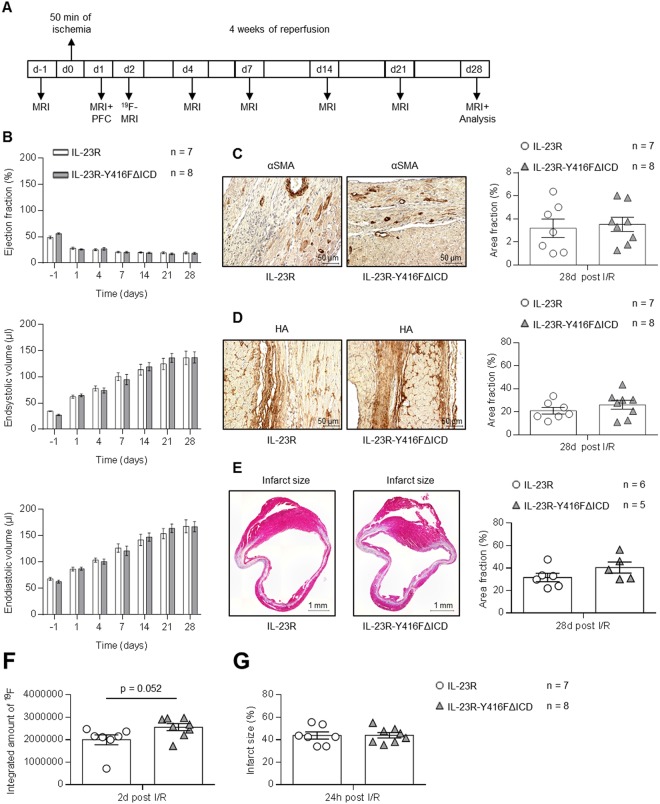
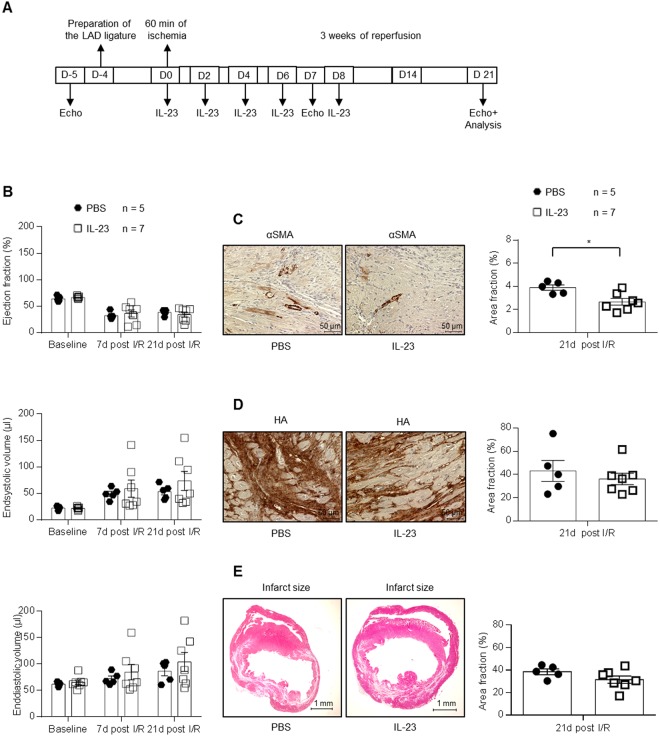
Ischemic heart diseases are the most frequent diseases in the western world. Apart from Interleukin (IL-)1, inflammatory therapeutic targets in the clinic are still missing. Interestingly, opposing roles of the pro-inflammatory cytokine IL-23 have been described in cardiac ischemia in mice. IL-23 is a composite cytokine consisting of p19 and p40 which binds to IL-23R and IL-12Rβ1 to initiate signal transduction characterized by activation of the Jak/STAT, PI3K and Ras/Raf/MAPK pathways. Here, we generate IL-23R-Y416FΔICD signaling deficient mice and challenged these mice in close- and open-chest left anterior descending coronary arteria ischemia/reperfusion experiments. Our experiments showed only minimal changes in all assayed parameters in IL-23R signaling deficient mice compared to wild-type mice in ischemia and for up to four weeks of reperfusion, including ejection fraction, endsystolic volume, enddiastolic volume, infarct size, gene regulation and α smooth muscle actin (αSMA) and Hyaluronic acid (HA) protein expression. Moreover, injection of IL-23 in wild-type mice after LAD ischemia/reperfusion had also no influence on the outcome of the healing phase. Our data showed that IL-23R deficiency has no effects in myocardial I/R.


Conflict of interest statement

The authors declare no competing interests.

Figures

Figure 1
Figure 1
Generation of IL-23 signaling deficient mice. (A) Schematic illustration of IL-23 receptor chains IL-23R and IL-12Rβ1 in complex with IL-23. Indicated are the canonical tyrosine residues and the non-canonical region for binding/activation of AKT, MAPK and STAT signaling. In IL-23R-Y416F mice tyrosine 416 is mutated into phenylalanine and in IL-23R-Y416FΔICD signaling deficient mice Y416F is combined with a deletion of the IL-23R from amino acid residue 432. (B) Targeting strategy for the generation of floxed IL-23-Y416F and IL-23R-Y416FΔICD signaling deficient mice. The arrows indicate the locations of primers used for genomic PCR and RT-PCR. (C) Partial amino acid sequence of IL-23R, IL-23R-Y416F and IL-23R-Y416FΔICD mice. (D) PCR to characterize genomic organization of IL-23R, IL-23R-Y416F and IL-23R-Y416FΔICD in mice. Primer combinations are indicated. (E) RT-PCR on RNA from spleen tissue of IL-23R, IL-23R-Y416F and IL-23R-Y416FΔICD mice. GAPDH served as control. (F) IL-23R cell surface expression of spleen cells from IL-23R (light gray), IL-23R-Y416F (black) and IL-23R-Y416FΔICD (dark gray) mice 5 days after stimulation with anti-CD3, anti-CD28, TGF-β1, IL-6 and IL-1 by flow cytometry. (G) Splenocytes were incubated for 5 days with anti-CD3 and anti-CD28, in the absence (white bars) or presence of TGF-β1, IL-6 and mouse IL-1β (black dotted bars). Supernatants were collected and analyzed by ELISA for IL-17. Results are mean ± S.D. of three replicates. Significance of difference (two-tailed Student t test): *p < 0.05, **p < 0.01, ****p < 0.0001.
Figure 2
Figure 2
Closed-chest LAD ischemia/reperfusion with 60 min ischemia and 3 weeks reperfusion in IL-23R, IL-23R-Y416F and IL-23R-Y416FΔICD signaling deficient mice. (A) Schematic illustration of the closed-chest LAD experiment with IL-23R, IL-23R-Y416F and IL-23R-Y416FΔICD mice. Baseline measurement were performed at day -5, LAD ligature was inserted at day -4, 60 min of ischemia was done at day 0 followed by 3 weeks of reperfusion and analysis at day 1, 4 and 21. (B) Survival curve of IL-23R (n = 15), IL-23R-Y416F (n = 10) and IL-23R-Y416FΔICD (n = 14) mice after ischemia/reperfusion. (C) Echocardiographic analysis of ejection fraction, endsystolic- and enddiastolic volume before (baseline) and after 3 weeks of reperfusion. Results are mean ± S.E.M. of 7–10 animals/group (IL-23R n = 10; IL-23R-Y416F n = 7; IL-23R-Y416FΔICD n = 7). (D) Immunostaining and quantitative analysis of αSMA protein amounts in the left ventricle (LV) 3 weeks of reperfusion; 40x magnification; scale bars, 50 µm. Results are mean ± S.E.M. of 7–10 animals/group (IL-23R n = 10; IL-23R-Y416F n = 7; IL-23R-Y416FΔICD n = 7). (E) Immunostaining with HAbP and quantitative analysis of HA amounts in the LV 3 weeks of reperfusion. Representative images of the LV after 3 weeks of reperfusion and quantitative image analysis; 40x magnification; scale bars, 50 µm. Results are mean ± S.E.M. of 7–10 animals/group (IL-23R n = 10; IL-23R-Y416F n = 7; IL-23R-Y416FΔICD n = 7). (F) Representative Gomori’s 1-step trichrome staining of heart sections and quantitative analysis of infarct size/LV 3 weeks of reperfusion; scale bars, 1 mm. Results are mean ± S.E.M. of 7–10 animals/group (IL-23R n = 10; IL-23R-Y416F n = 7; IL-23R-Y416FΔICD n = 10). Significance of difference (one-way ANOVA): *p < 0.05.
Figure 3
Figure 3
Closed-chest LAD ischemia/reperfusion with 60 min ischemia and 24 h/4d reperfusion in IL-23R and IL-23R-Y416FΔICD signaling deficient mice. (A) Echocardiographic analysis of ejection fraction, endsystolic- and enddiastolic volume before (baseline) and after 4 days of reperfusion. Results are mean ± S.E.M. of 8–10 animals/group (IL-23R n = 8; IL-23R-Y416FΔICD n = 10). (B) Echocardiographic analysis of ejection fraction, endsystolic- and enddiastolic volume before (baseline) and after 24 h of reperfusion. Results are mean ± S.E.M. of 6–8 animals/group (IL-23R n = 6; IL-23R-Y416FΔICD n = 8). (C) Immunostaining and quantitative analysis of αSMA protein amounts in the left ventricle (LV) after 24 h of reperfusion; 40x magnification; scale bars, 50 µm. Results are mean ± S.E.M. of 5 animals/group. (D) Immunostaining with HAbP and quantitative analysis of HA amounts in the LV after 3 weeks of reperfusion. Representative images of the LV after 3 weeks of reperfusion and quantitative image analysis; 40x magnification; scale bars, 50 µm. Results are mean ± S.E.M. of 5 animals/group. (E) Immunostaining and quantitative analysis of Galectin-3 protein amounts in the left ventricle (LV) after 24 h of reperfusion; 40x magnification; scale bars, 50 µm. Results are mean ± S.E.M. of 5 animals/group. (F) Measurement of mouse serum samples for troponin T 24 h after I/R. Results are mean ± S.E.M. of 6–14 animals/group (IL-23R n = 10; IL-23R-Y416F n = 6; IL-23R-Y416FΔICD n = 14).
Figure 4
Figure 4
Real-time PCR analysis of gene expression 24 h after LAD ischemia/reperfusion. RORγt, IFN-γ, IL-17α, Col1A1, Col3A1, Acta2, Bcl2l1, CyclinD1 and Bcl2 mRNA levels in the LV of IL-23R, IL-23R-Y416F and IL-23R-Y416FΔICD mice after 24 h of reperfusion. qPCR has been performed as described under “Experimental procedures”. Results are mean ± S.E.M. of 5–9 animals/group (IL-23R n = 5; IL-23R-Y416F n = 6; IL-23R-Y416FΔICD n = 8–9).
Figure 5
Figure 5
Open-chest LAD ischemia/reperfusion with 50 min ischemia and 4 weeks reperfusion in IL-23R and IL-23R-Y416FΔICD signaling deficient mice. (A) Schematic illustration of the open-chest LAD experiment with IL-23R and IL-23R-Y416FΔICD mice. Baseline measurement were performed at day -1, LAD ligature and 50 min of ischemia was done at day 0 followed by 4 weeks of reperfusion and analysis at day 1, 4, 7, 14, 21 and 28. (B) MRI analysis of ejection fraction, endsystolic- and enddiastolic volume before (baseline) and after 24 h, 4 d, 7 d, 14 d, 21 d and 28 d of reperfusion. Results are mean ± S.E.M. of 7–8 animals/group (IL-23R n = 7; IL-23R-Y416FΔICD n = 8; baseline: IL-23R n = 3; IL-23R-Y416FΔICD n = 4). (C) Immunostaining and quantitative analysis of αSMA protein in the left ventricle (LV) after 28 days of reperfusion; 40x magnification; scale bars, 50 µm. Results are mean ± S.E.M. of 7–8 animals/group (IL-23R n = 7; IL-23R-Y416FΔICD n = 8). (D) Immunostaining with HAbP and quantitative analysis of HA amounts in the LV after 3 weeks of reperfusion. Representative images of the LV after 3 weeks of reperfusion and quantitative image analysis; 40x magnification; scale bars, 50 µm Results are mean ± S.E.M. of 7–8 animals/group (IL-23R n = 7; IL-23R-Y416FΔICD n = 8). (E) Representative Gomori’s 1-step trichrome staining of heart sections and quantitative analysis of infarct size/LV after 28 days of reperfusion; scale bars, 1 mm. Results are mean ± S.E.M. of 5–6 animals/group (IL-23R n = 6; IL-23R-Y416FΔICD n = 5). (F) Calculated amounts of 19F as indicator of macrophages infiltration after 24 h of reperfusion by magnetic resonance imaging as described in “Experimental procedures”. (G) Ischemic areas of hearts after 24 h of reperfusion was visualized and calculated by magnetic resonance imaging as described in “Experimental procedures”.
Figure 6
Figure 6
Biological activity of the purified recombinant HIL-23Fc. (A) Schematic illustration of the Hyper IL-23Fc fusion gene. Hyper-IL-23 was N-terminally tagged with a flag-tag and C-terminally tagged with Fc and His-tag. (B) CHO-K1 cells were stably transduced with Hyper-IL-23Fc cDNA and a high producer clone was selected. Western blot detection of HIL-23Fc was done with α-hFc mAbs. Input: CHO-K1 supernatant containing Hyper-IL-23Fc. Unbound: Detection of Hyper-IL-23Fc which was not bound to Protein A agarose after precipitation. Bound: Detection of Hyper-IL-23Fc, which was precipitated by Protein A agarose. (C) Hyper-IL-23Fc was purified by Protein A agarose affinity chromatography and stained by Coomassie brilliant blue. Input: cell culture supernatant from CHO-K1 cells stably expression Hyper-IL-23Fc. Flow Through: Fraction which did not bind to Protein A agarose. Wash: The column was washed twice with PBS. Elution: Hyper-IL-23Fc was eluted with 50 mM citrate buffer (50 mM citric acid, 50 mM sodium citrate), pH 3.25. (D) Ba/F3-gp130 and Ba/F3-mIL-23R-mIL-12Rβ1 cells were stimulated with the indicated concentrations of Hyper-IL-23Fc and GFP. Cellular proliferation was determined after 72 h. One representative experiment out of three is shown. Results are mean ± S.D. of three replicates. (E) Ba/F3-gp130 and Ba/F3-gp130-mIL-23R-mIL-12Rβ1 cells were stimulated with 25 ng/ml of recombinant GFP, HIL-23Fc, HIL-6Fc and PBS for 30 min. Equal amounts of total protein (50 μg/lane) were analyzed for phospho-STAT3, STAT3, phospho-ERK1/2, ERK1/2, phospho AKT and AKT. Western blot data show one representative experiment out of three. Uncropped images of Western blots are presented in Supplementary Figure 1.
Figure 7
Figure 7
Closed-chest LAD ischemia/reperfusion with 60 min ischemia and 3 weeks of reperfusion was induced in wild-type mice treated with recombinant HIL-23Fc. (A) Schematic illustration of closed-chest LAD experiments with 12–14 weeks old wild-type mice injected with Hyper-IL-23Fc. Baseline measurement were performed at day -5, LAD ligature was inserted at day -4, 60 min of ischemia was done at day 0 followed by 3 weeks of reperfusion and analysis at day 1, 4 and 21. 10 µg/mouse HIL-23Fc in 200 µl sterile PBS or 200 µl sterile PBS were injected intraperitoneally on day 0 (directly at the beginning of reperfusion), 2, 4, 6 and 8. (B) Echocardiographic analysis of ejection fraction, endsystolic- and enddiastolic volume before (baseline) and after 7 d and 21 d of reperfusion. Results are mean ± S.E.M. of 5–7 animals/group (PBS treated group n = 5; HIL-23Fc treated group n = 7). (C) Immunostaining and quantitative analysis of αSMA protein in the LV after HIL-23Fc injection or PBS and after 3 weeks of reperfusion; 40x magnification; scale bars, 50 µm. Results are mean ± S.E.M. of 5–7 animals/group (PBS treated group n = 5; HIL-23Fc treated group n = 7). (D) Immunostaining with HAbP and quantitative analysis of HA amounts in the LV after HIL-23Fc injection or PBS and after 3 weeks of reperfusion. Representative images and quantitative analysis; 40x magnification; scale bars, 50 µm. Results are mean ± S.E.M. of 5–7 animals/group (PBS treated group n = 5; HIL-23Fc treated group n = 7). (E) Representative Gomori’s 1-step trichrome staining of heart sections and quantitative analysis of infarct size/LV after HIL-23Fc injection or PBS and after 3 weeks of reperfusion; scale bars, 1 mm. Results are mean ± S.E.M. of 5–7 animals/group (PBS treated group n = 5; HIL-23Fc treated group n = 7). Significance of difference (two-tailed Student t test): *p < 0.05.

References

    1. Marchant D, et al. Inflammation in myocardial diseases. Circulation research. 2012;110:126–144. doi: 10.1172/JCI78085. - DOI - PubMed
    1. Ridker P, et al. Antiinflammatory Therapy with Canakinumab for Atherosclerotic Disease. N Engl J Med. 2017;377:1119–1131. doi: 10.1056/NEJMoa1707914. - DOI - PubMed
    1. Fontes J, Rose N, Čiháková D. The varying faces of IL-6: From cardiac protection to cardiac failure. Cytokine. 2015;74:62–68. doi: 10.1016/j.cyto.2014.12.024. - DOI - PMC - PubMed
    1. Savvatis K, et al. Interleukin-23 deficiency leads to impaired wound healing and adverse prognosis after myocardial infarction. Circulation: Heart Failure. 2014;7:161–171. - PubMed
    1. Yan X, et al. Deleterious effect of the IL-23/IL-17A axis and γδT cells on left ventricular remodeling after myocardial infarction. J Am Heart Assoc. 2012;1:e004408. - PMC - PubMed

Publication types

Substances