. 2018 Oct 16:12:359.
doi: 10.3389/fncel.2018.00359. eCollection 2018.

Blood-Brain Barrier Cellular Responses Toward Organophosphates: Natural Compensatory Processes and Exogenous Interventions to Rescue Barrier Properties

Affiliations

Blood-Brain Barrier Cellular Responses Toward Organophosphates: Natural Compensatory Processes and Exogenous Interventions to Rescue Barrier Properties

Orly Ravid et al. Front Cell Neurosci. .

Abstract

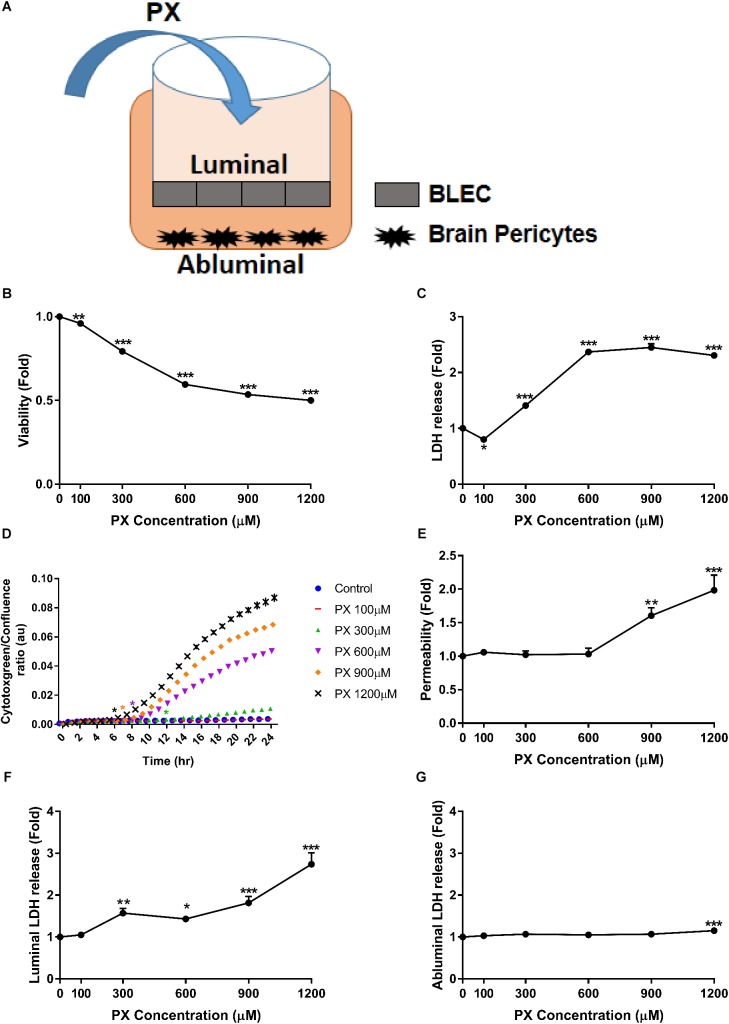
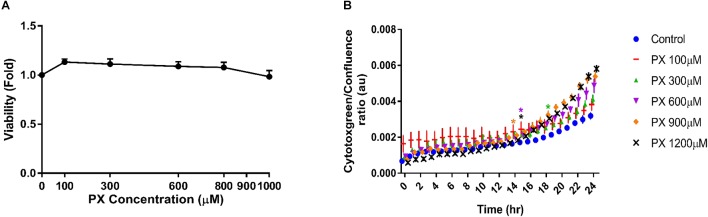
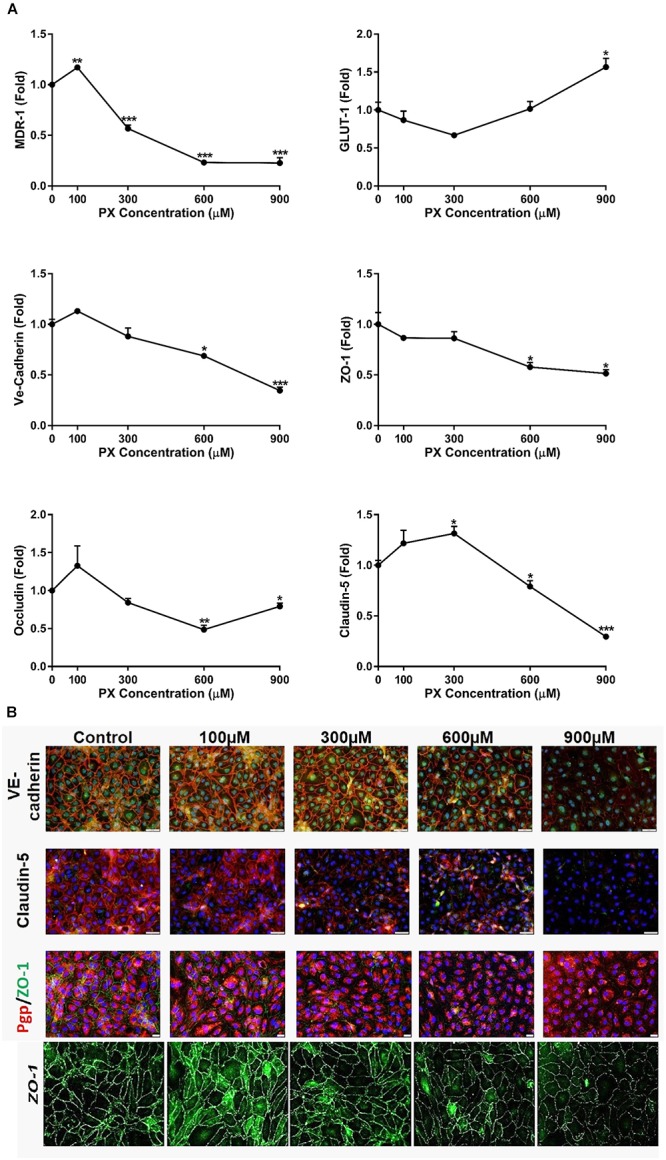
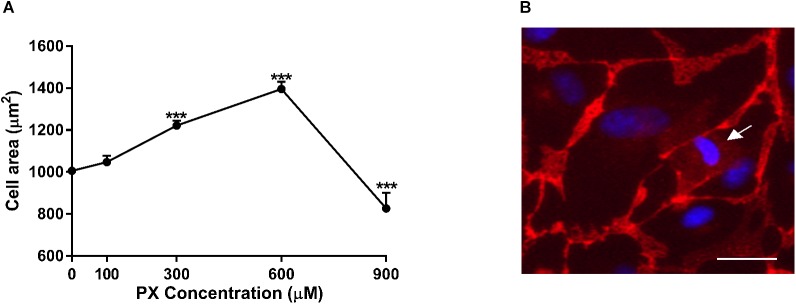
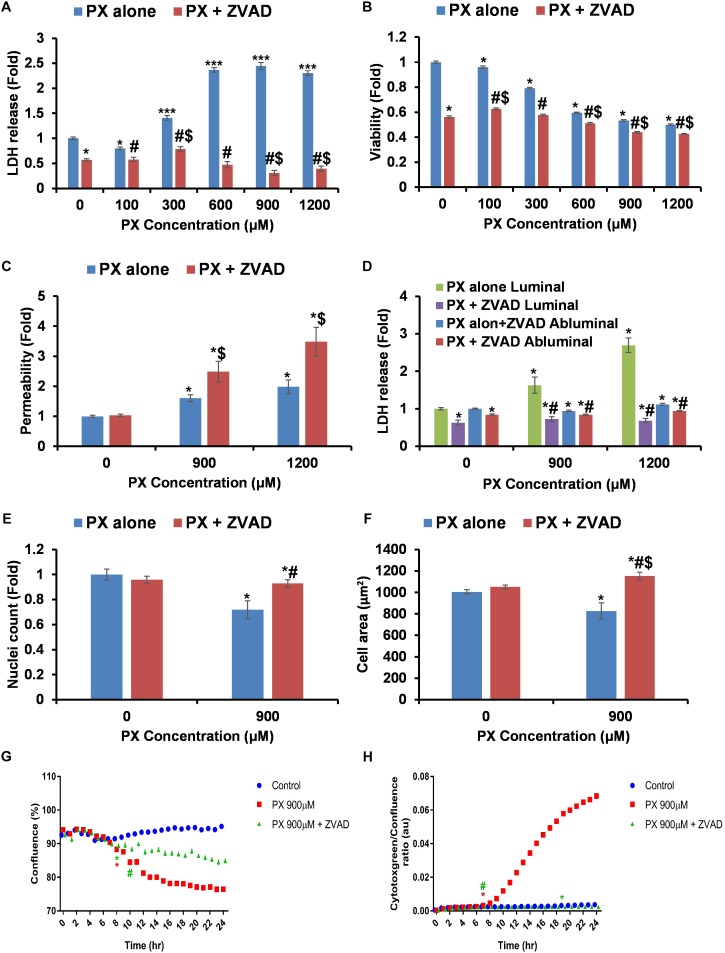
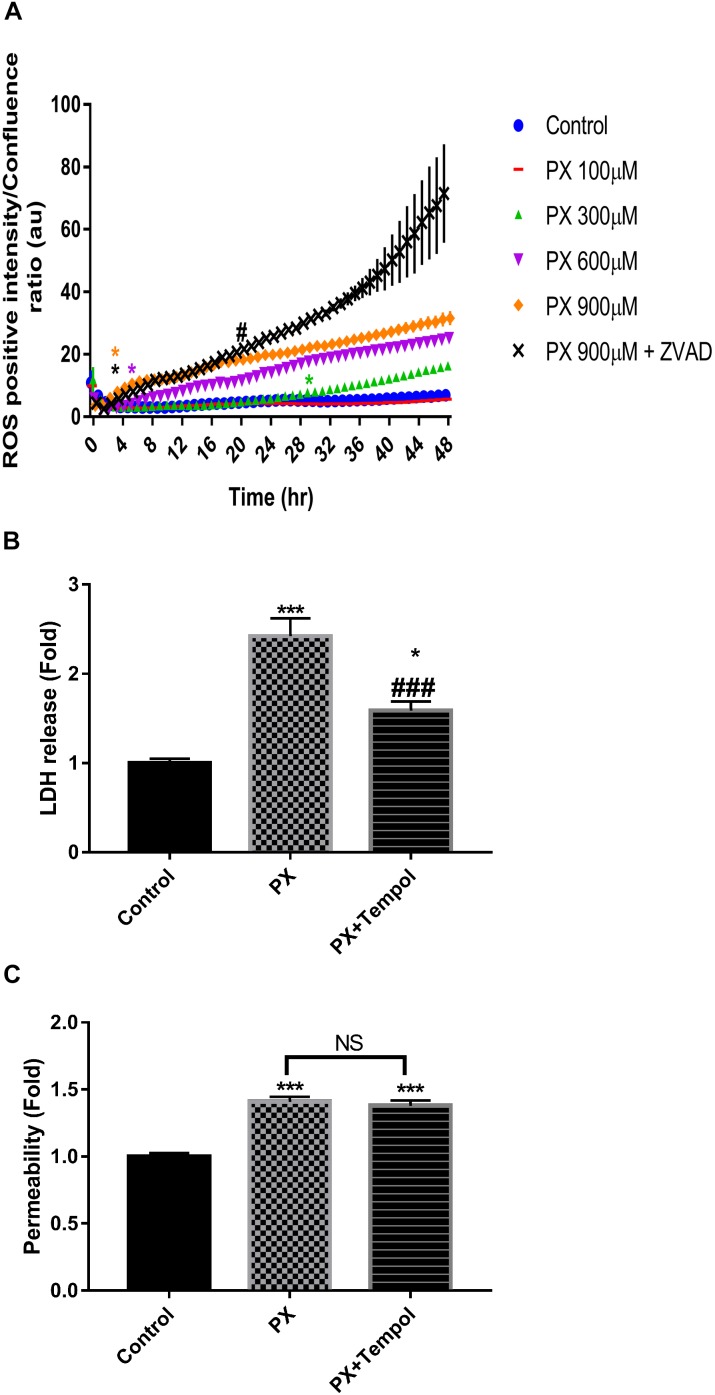
Organophosphorus compounds (OPs) are highly toxic chemicals widely used as pesticides (e.g., paraoxon (PX)- the active metabolite of the insecticide parathion) and as chemical warfare nerve agents. Blood-brain barrier (BBB) leakage has been shown in rodents exposed to PX, which is an organophosphate oxon. In this study, we investigated the cellular mechanisms involved in BBB reaction after acute exposure to PX in an established in vitro BBB system made of stem-cell derived, human brain-like endothelial cells (BLECs) together with brain pericytes that closely mimic the in vivo BBB. Our results show that PX directly affects the BBB in vitro both at toxic and non-toxic concentrations by attenuating tight junctional (TJ) protein expression and that only above a certain threshold the paracellular barrier integrity is compromised. Below this threshold, BLECs exhibit a morphological coping mechanism in which they enlarge their cell area thus preventing the formation of meaningful intercellular gaps and maintaining barrier integrity. Importantly, we demonstrate that reversal of the apoptotic cell death induced by PX, by a pan-caspase-inhibitor ZVAD-FMK (ZVAD) can reduce PX-induced cell death and elevate cell area but do not prevent the induced BBB permeability, implying that TJ complex functionality is hindered. This is corroborated by formation of ROS at all toxic concentrations of PX and which are even higher with ZVAD. We suggest that while lower levels of ROS can induce compensating mechanisms, higher PX-induced oxidative stress levels interfere with barrier integrity.

Keywords: blood-brain barrier; organophosphates; paraoxon; permeability; tight junction.


Figures

FIGURE 1
FIGURE 1
PX dose-dependent increase in toxicity and Pe of the human BBB model. (A) Schematic drawing of the in vitro BBB co-culture system applied in this study: co–culture model of BLEC grown on matrigel-coated Transwell® permeable inserts with bovine brain pericytes grown at the abluminal side in a non-contact manner, used for functional Pe experiments. (B–D) Monolayers of BLECs were treated with PX for 24 h in a dose response experiment. Viability and cell death were examined by (B) MTT assay –a representative (out of three) experiment, (C) LDH release (n = 37-46 from five independent experiments), and (D) cytotoxgreen staining (a representative figure, out of three time course independent experiments is shown, n = 4–6 for each time point), the relative fraction of dead cells out of the whole population is presented as the ratio of green object confluence to phase confluence, marks the first time in which the PX treatment is significantly different from control according to plot color, respectively. (E,F) Co-culture BBB in vitro model was treated with PX at the luminal side for 24 h in a dose response experiment. (E) To assess TJ functionality, Pe of sodium fluorescein (NaF) across the BBB in vitro model (from luminal to abluminal side) was assessed (n = 11–25 from four independent experiments) and cell death was examined by LDH release at the luminal (F) and abluminal (G) side (n = 11–25 from four independent experiments). Data presented as mean ± SEM. p < 0.05, ∗∗p < 0.01 and ∗∗∗p < 0.001 vs. control (Ordinary one way ANOVA with Dunnett’s multiple comparisons test).
FIGURE 2
FIGURE 2
Pericytes show high resilience to PX in comparison to BLEC. Pericytes were treated as mono culture with PX for 24 h in a dose response experiment and (A) cell viability was examined by MTT assay (n = 13–22 from three independent experiments) and (B) by time course experiments of cytotoxgreen staining (a representative figure, out of three independent experiments is shown, n = 3–6 for each time point). The relative fraction of dead cells out of the whole population is presented as the ratio of green object confluence to phase confluence, marks the first time in which the PX treatment is significantly different from control according to plot color. Data presented as mean ± SEM. p < 0.05 vs. control. (Ordinary one way ANOVA with Dunnett’s multiple comparisons test).
FIGURE 3
FIGURE 3
BBB transporters, tight and adherens junction mRNA levels and protein expression are attenuated upon PX exposure. (A) Monolayers of BLECs were treated with PX for 24 h and the mRNA expression levels of the junctional genes Occludin, Claudin-5, ZO-1, Ve-Cadherin, and transporter genes Glut-1 and MDR-1 were examined (n = 3 with 8–9 technical repeats). (B) ECs monolayers were treated with PX for 24 h and protein expression levels and patterns of Claudin-5, ZO-1, Ve-Cadherin and P-gp were examined using immunocytochemistry, one representative picture is displayed. Bar scales for two top panels equal 50 and 20 μm for the third row. Magnification level for the bottom panels is x200. Data presented as mean ± SEM. p < 0.05, ∗∗p < 0.01, and ∗∗∗p < 0.001 vs. control (Kruskal-Wallis one way ANOVA with Dunnett’s multiple comparisons test).
FIGURE 4
FIGURE 4
Cell area enlargement as an endothelium compensatory mechanism to maintain barrier properties by PX. (A) Dose-dependent cell area expansion in monolayers of BLECs treated for 24 h with PX calculated with imageJ from TJ-immunostained BLECs from at least 9 micrographs (n = 146–170 cells per treatment from three independent experiments). (B) A dying BLEC (marked with an arrow) covered by neighboring cells with functional adherens junctions at 300 μM PX (immunostaining of VE-cadherin is shown). Data presented as mean ± SEM. ∗∗∗p < 0.001 vs. control (Ordinary one way ANOVA with Dunnett’s multiple comparisons test). Bar scale equal 20 μm.
FIGURE 5
FIGURE 5
Inhibition of caspases blocks cell death but does not restore the functionality of the barrier. (A,B) LDH release (n = 12–46 from four independent experiments) (A) and MTT assay (n = 11–20 from three independent experiments) (B) after 24 h PX treatment with ZVAD in a BLEC monolayer. (C) Co-cultures of BBB in vitro models were treated at the luminal side with PX + ZVAD for 24 h in a dose response experiment. Pe of NaF from luminal to abluminal side was measured (n = 12 Transwell inserts from three independent experiments). (D) LDH release at the luminal and abluminal sides of the co-culture BBB system was measured to assess cell death. (E) Nuclei number was counted with imageJ from at least six micrographs of BLEC monolayers treated with PX ± ZVAD for 24 h. (F) Cell area of BLEC monolayers treated for 24 h with PX ± ZVAD calculated with imageJ from AJ-immunostained BLECs micrographs (n = 117–190 cells per treatment from three independent experiments). (G,H) A representative time course experiment of BLEC monolayers treated for 24 h with PX ± ZVAD, phase contrast confluence is presented (%) (G) and cytotoxgreen staining is presented (H), the relative fraction of dead cells out of the whole population is presented as the ratio of green object confluence to phase confluence (a representative figure, out of three time course independent experiments is shown, n = 6 for each time point). Marks the first time in which the PX treatment is significantly different from control according to plot color. Data presented as mean ± SEM. p < 0.05 and ∗∗∗p < 0.05 vs. control, $p < 0.05 vs. control+ZVAD and #p < 0.05 vs. PX alone at the same concentration, respectively. All results without ZVAD in this figure were taken from the previous figures in this article.
FIGURE 6
FIGURE 6
Dose and time-dependent increase in ROS levels by PX is not reversed by ZVAD. Monolayers of BLECs were treated with PX for 48 h in a dose response experiment. (A) A representative time course experiment of CellRox green staining, the fluorescence intensity of ROS-positive cells normalized to the whole population is presented as the ratio of green object integrated intensity to phase confluence (a representative figure, out of three time course independent experiments is shown, n = 6 for each time point). Marks the first time in which the PX treatment is significantly different from control, #marks the first time in which the PX treatment is significantly different from 900 μM PX; after 38 h 900 μM PX+ZVAD is not significantly different from 900 μM PX according to plot color. p < 0.05 vs. Control, #p < 0.05 vs. PX at 900 μM. (B) Co-cultures of BBB in vitro models were treated at the luminal side with 900 μM PX with or without TEMPOL at 150 μM for 24 h. LDH release at the luminal side of the co-culture BBB system was measured. (C) Pe of NaF from luminal to abluminal side was measured (n = 9–12 Transwell inserts from 3 independent experiments). Data presented as mean ± SEM. p < 0.05 and ∗∗∗p < 0.001 vs. control, ###p < 0.001 vs. PX alone (Ordinary one way ANOVA with Dunnett’s multiple comparisons test). NS, no statistical differences.

Similar articles

Cited by

References

    1. Abbott N. J., Patabendige A. A., Dolman D. E., Yusof S. R., Begley D. J. (2010). Structure and function of the blood-brain barrier. Neurobiol. Dis. 37 13–25. 10.1016/j.nbd.2009.07.030 - DOI - PubMed
    1. Abdel-Rahman A., Shetty A. K., Abou-Donia M. B. (2002). Acute exposure to sarin increases blood brain barrier permeability and induces neuropathological changes in the rat brain: dose-response relationships. Neuroscience 113 721–741. 10.1016/S0306-4522(02)00176-8 - DOI - PubMed
    1. Alluri H., Stagg H. W., Wilson R. L., Clayton R. P., Sawant D. A., Koneru M., et al. (2014). Reactive oxygen species-caspase-3 relationship in mediating blood-brain barrier endothelial cell hyperpermeability following oxygen-glucose deprivation and reoxygenation. Microcirculation 21 187–195. 10.1111/micc.12110 - DOI - PubMed
    1. Angelini D. J., Moyer R. A., Cole S., Willis K. L., Oyler J., Dorsey R. M., et al. (2015). The pesticide metabolites paraoxon and malaoxon induce cellular death by different mechanisms in cultured human pulmonary cells. Int. J. Toxicol. 34 433–441. 10.1177/1091581815593933 - DOI - PubMed
    1. Ashani Y., Catravas G. N. (1981). Seizure-induced changes in the permeability of the blood-brain barrier following administration of anticholinesterase drugs to rats. Biochem. Pharmacol. 30 2593–2601. 10.1016/0006-2952(81)90587-6 - DOI - PubMed

LinkOut - more resources