. 2018 Nov 6:12:415.
doi: 10.3389/fncel.2018.00415. eCollection 2018.

Validation and Optimization of an Image-Based Screening Method Applied to the Study of Neuronal Processes on Nanogrooves

Affiliations

Validation and Optimization of an Image-Based Screening Method Applied to the Study of Neuronal Processes on Nanogrooves

Alex J Bastiaens et al. Front Cell Neurosci. .

Abstract

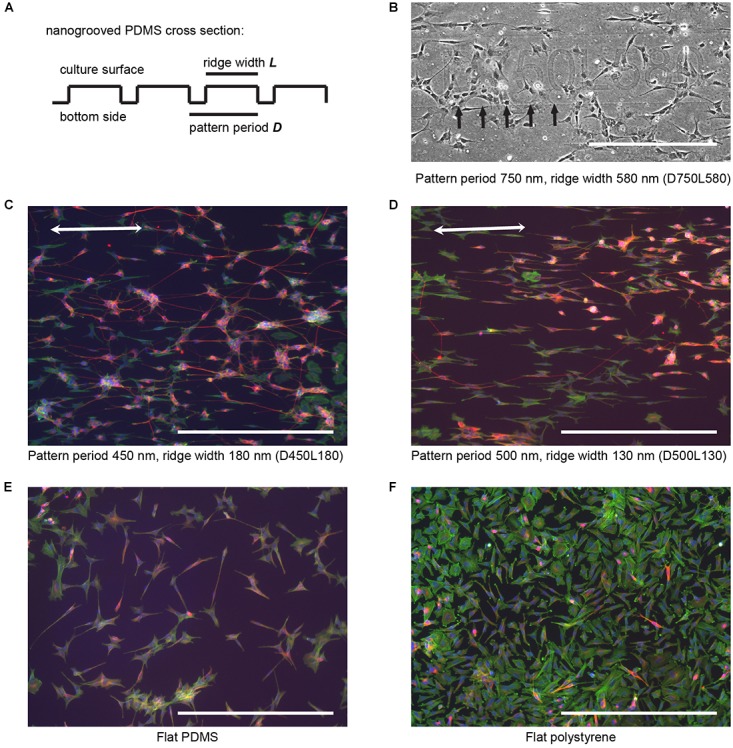
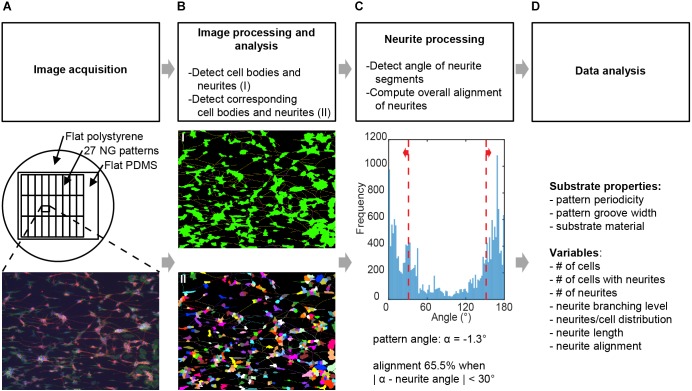
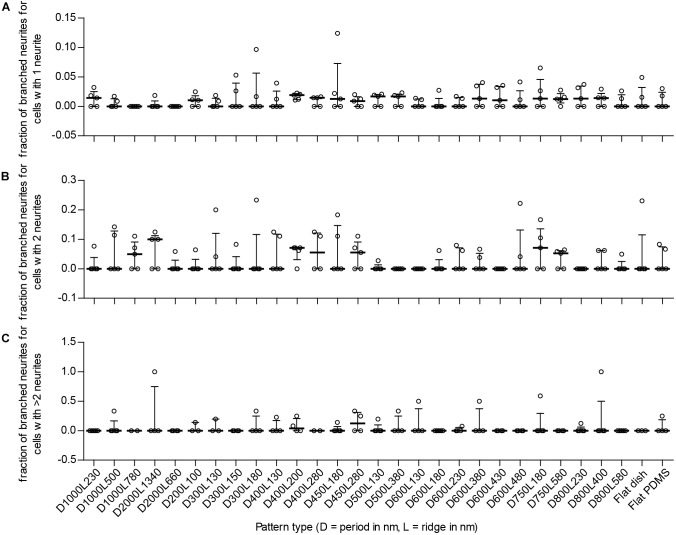
Research on neuronal differentiation and neuronal network guidance induced through nanotopographical cues generates large datasets, and therefore the analysis of such data can be aided by automatable, unbiased image screening tools. To link such tools, we present an image-based screening method to evaluate the influence of nanogroove pattern dimensions on neuronal differentiation. This new method consists of combining neuronal feature detection software, here HCA-Vision, and a Frangi vesselness algorithm to calculate neurite alignment values and quantify morphological aspects of neurons, which are measured via neurite length, neuronal polarity, and neurite branching, for differentiated SH-SY5Y cells cultured on nanogrooved polydimethylsiloxane (PDMS) patterns in the 200-2000 nm range. The applicability of this method is confirmed by our results, which find that the level of alignment is dependent on nanogroove dimensions. Furthermore, the screening method reveals that differentiation and alignment are correlated. In particular, patterns with groove widths >200 nm and with a low ridge width to pattern period ratio have a quantifiable influence on alignment, neurite length, and polarity. In summary, the novel combination of software that forms a base for this statistical analysis method demonstrates good potential for evaluating tissue microarchitecture, which depends on subtle design variation in substrate topography. Using the screening method, we obtained automated and sensitive quantified readouts from large datasets.

Keywords: SH-SY5Y cells; high-content screening; nanogrooves; neurite development; neuronal development; neuronal differentiation.


Figures

FIGURE 1
FIGURE 1
SH-SY5Y cell culture and differentiation on patterned and flat substrates. (A) Simplified cross section view for general fabricated nanogrooved patterns in PDMS. Nanogrooves in PDMS consist of a periodically repeating groove and ridge on the culture surface. For distinction between the nanogrooved patterns, a notation was used, where D and the subsequent value refer to pattern period and the respective size in nm and L and the subsequent value refer to the pattern ridge width and the respective size in nm, as is shown in (B–F). (B) Section of an example image from pattern D750L580 of how samples for each nanogrooved pattern were identified. For each nanogrooved pattern in each experiment, an image of the pattern name as described in (A) and edge of the pattern were taken. Nanogroove direction is parallel to the edge seen underneath the pattern notation and should ideally be along the horizontal axis; however, due to the manual placement of samples underneath the microscope, slight deviations occur. Therefore, the images with pattern name and border were used as references to determine the exact orientation of the nanogrooves for each individual pattern by calculating the border angle in Fiji software. Brightness and contrast were enhanced for clarification of this example only; no editing was used for data gathering. Arrows denote pattern edge, and the scale bar represents 400 μm. (C,D) SH-SY5Y cells were cultured on top of PDMS with a pattern of 450 nm period and 180 nm ridge width (C) and 500 nm period and 130 nm ridge width (D), and then they were differentiated using 10 μM RA and 50 ng ml-1 BDNF. Cells were stained for F-actin (green), β-Tubulin III (red), and cell nuclei (blue). Double-sided arrows denote the pattern direction, and the scale bar represents 400 μm. (E,F) SH-SY5Y cells were cultured on top of a flat PDMS substrate (E) and flat polystyrene substrate (F), and then they were differentiated using 10 μM RA and 50 ng ml-1 BDNF. Cells were stained for F-actin (green), β-Tubulin III (red), and cell nuclei (blue). The scale bar represents 400 μm.
FIGURE 2
FIGURE 2
Image processing and analysis. Schematic for the screening process where (A) images obtained from neuronal cell cultures on different substrates are processed to deduce variables detailing neuronal culture properties. See Section “Materials and Methods” for full details. (B) Image processing was conducted using neuronal cell feature detection in the HCA-Vision software, which detects cell bodies and neurites and links neurites to the corresponding cell bodies. (C) The alignment of neurites independent of cell bodies was computed using a Frangi vesselness algorithm in MATLAB. Alignment of neurites was considered when the detected angle relative to the angle of the underlying pattern was <30°. Variables obtained from this combined analysis in (B,C) were number of cells, number of cells with neurites, number of neurites, neurite branching level, neurites per cell distribution, neurite length, and neurite alignment. (D)Variables were then analyzed for statistically significant differences between substrates and for correlation between variables.
FIGURE 3
FIGURE 3
Comparison between Frangi vesselness, FFT, and manual neurite assessment. (A) Scatter plot showing the comparison between calculating alignment of neuronal cell culture to the underlying nanogrooved pattern by means of FFT and Frangi vesselness. Spearman’s non-parametric correlation coefficient was calculated using a two-tailed P-value and 99% confidence interval, resulting in r = 0.83 with P < 0.0001. (B) Scatter plot showing the comparison between calculating alignment of neurites to the underlying nanogrooved pattern by means of FFT and Frangi vesselness applied to a neurite-only image, resulting in r = 0.91 with P < 0.0001. (C) Scatter plot showing the comparison between calculating alignment of neurites to the underlying nanogrooved pattern by means of Frangi vesselness applied to a whole image versus applied to a neurite-only image, resulting in r = 0.87 with P < 0.0001. (D) Scatter plot showing the comparison between calculating alignment of neurites to the underlying nanogrooved pattern by means of FFT applied to a whole image versus Frangi vesselness applied to a neurite-only image, resulting in r = 0.80 with P < 0.0001. The legend in (C) shows markers for data of each experiment for plots (A–D). (E) Comparison of neurite alignment as measured through Frangi vesselness, FFT, and manual neurite assessment. The comparison is made for n = 3 samples of pattern D600L180 for high alignment, pattern D1000L500 for intermediate alignment, and the flat PDMS substrate as a control. Box plots show median with interquartile range (IQR) and whiskers, with whiskers and median being the values found for neurite alignment for each of the different measurements on the three substrate types.
FIGURE 4
FIGURE 4
Nanogrooved patterns affect neurite alignment but not neurite length. (A) Scatter plot showing the percentage of alignment depending on the groove width of the nanogrooved patterns. (B) Scatter plot showing how alignment of neurites is affected by the ratio of pattern ridge width to pattern period size. The legend in (A) shows markers for data of each experiment for plots (A–B). (C) The percentage of neurites from differentiated SH-SY5Y cells aligned to the underlying nanogrooved PDMS substrate or flat substrate (indicated underneath D) in an image as analyzed by neuronal cell feature detection in HCA-Vision combined with a Frangi vesselness algorithm in MATLAB. At isotropic distribution of neurites, alignment will be 33%. Data points shown are alignment percentages per substrate type from n = 5 experiments. Bars indicate median ± IQR. Statistically significant differences were measured using the Kruskal–Wallis non-parametric test with post hoc Dunn’s multiple comparison test at a significance level of 0.05. Represents P < 0.05 and ∗∗represents P < 0.01. (D) The neurite length for neurites of differentiated SH-SY5Y cells per substrate type. Data points shown are mean neurite lengths per substrate type from n = 5 experiments. Bars indicate median ± IQR. Statistically significant differences were not found using the Kruskal–Wallis non-parametric test with post hoc Dunn’s multiple comparison test at a significance level of 0.05.
FIGURE 5
FIGURE 5
Ratio between detected types of neuronal polarity. To detect potential shifts between neuronal polarity types for the differentiated SH-SY5Y cells due to the underlying nanotopography, the ratio between cells of different polarities is displayed. Cells with 1 neurite, 2 neurites, and >2 neurites are indicative of unipolar, bipolar, and multipolar neuronal cells, respectively. (A) Ratio of multipolar to unipolar cells per substrate type (as indicated underneath B). (B) Ratio of bipolar to unipolar cells per substrate type. For both (A,B), data points shown are ratios per substrate from n = 5 experiments. Bars indicate median ± IQR. Statistically significant differences were not found using the Kruskal–Wallis non-parametric test with post hoc Dunn’s multiple comparison test at 0.05 significance level.
FIGURE 6
FIGURE 6
Fraction of cells with branching neurites per detected type of neuronal polarity. To detect potential enhanced differentiation of SH-SY5Y cells due to the underlying nanotopography, the fraction of branching neurites per neuronal polarity type is displayed. Cells with 1 neurite, 2 neurites, and >2 neurites are indicative of unipolar, bipolar, and multipolar neuronal cells, respectively. (A) Fraction of branched neurites for unipolar cells per substrate type (as indicated underneath C). (B) Fraction of branched neurites for bipolar cells per substrate type (as indicated underneath C). (C) Fraction of branched neurites for multipolar cells per substrate type. For (A–C), data points shown are fractions per substrate type from n = 5 experiments. Bars indicate median ± IQR. Statistically significant differences were not found using the Kruskal–Wallis non-parametric test with post hoc Dunn’s multiple comparison test at 0.05 significance level.
FIGURE 7
FIGURE 7
Relation between neurite alignment, neuronal differentiation, and nanogrooves. To study whether neurite alignment and differentiation of the SH-SY5Y cells on nanogrooved patterns correlate and whether the pattern structure had an influence on these properties, scatterplots were used to visualize the relation between these parameters. (A–C) Data for which Spearman’s non-parametric correlation coefficients were calculated using a two-tailed P-value and 99% confidence interval. For all cases shown, P < 0.01 holds true, where graphs are neurite length versus alignment with correlation coefficient r = 0.746 (A), neurite length versus differentiated cells in total population with r = 0.814 (B), and alignment versus differentiated cells in total population with r = 0.731 (C). The legend shows markers for data of each experiment for plots (A–C).

References

    1. Agholme L., Lindström T., Kgedal K., Marcusson J., Hallbeck M. (2010). An in vitro model for neuroscience: differentiation of SH-SY5Y cells into cells with morphological and biochemical characteristics of mature neurons. J. Alzheimers Dis. 20 1069–1082. 10.3233/JAD-2010-091363 - DOI - PubMed
    1. Bremus-Koebberling E. A., Beckemper S., Koch B., Gillner A. (2012). Nano structures via laser interference patterning for guided cell growth of neuronal cells. J. Laser Appl. 24:042013 10.2351/1.4730804 - DOI
    1. Brunetti V., Maiorano G., Rizzello L., Sorce B., Sabella S., Cingolani R., et al. (2010). Neurons sense nanoscale roughness with nanometer sensitivity. Proc. Natl. Acad. Sci. U.S.A. 107 6264–6269. 10.1073/pnas.0914456107 - DOI - PMC - PubMed
    1. Dwane S., Durack E., Kiely P. A. (2013). Optimising parameters for the differentiation of SH-SY5Y cells to study cell adhesion and cell migration. BMC Res. Notes 6:366. 10.1186/1756-0500-6-366 - DOI - PMC - PubMed
    1. Encinas M., Iglesias M., Liu Y., Wang H., Muhaisen A., Ceña V., et al. (2000). Sequential treatment of SH-SY5Y cells with retinoic acid and brain-derived neurotrophic factor gives rise to fully differentiated, neurotrophic factor-dependent, human neuron-like cells. J. Neurochem. 75 991–1003. 10.1046/j.1471-4159.2000.0750991.x - DOI - PubMed

LinkOut - more resources