. 2018 Nov 6:9:1175.
doi: 10.3389/fphar.2018.01175. eCollection 2018.

Human Adipose Tissue-Derived Mesenchymal Stem Cells Attenuate Atopic Dermatitis by Regulating the Expression of MIP-2, miR-122a-SOCS1 Axis, and Th1/Th2 Responses

Affiliations

Human Adipose Tissue-Derived Mesenchymal Stem Cells Attenuate Atopic Dermatitis by Regulating the Expression of MIP-2, miR-122a-SOCS1 Axis, and Th1/Th2 Responses

Misun Kim et al. Front Pharmacol. .

Abstract

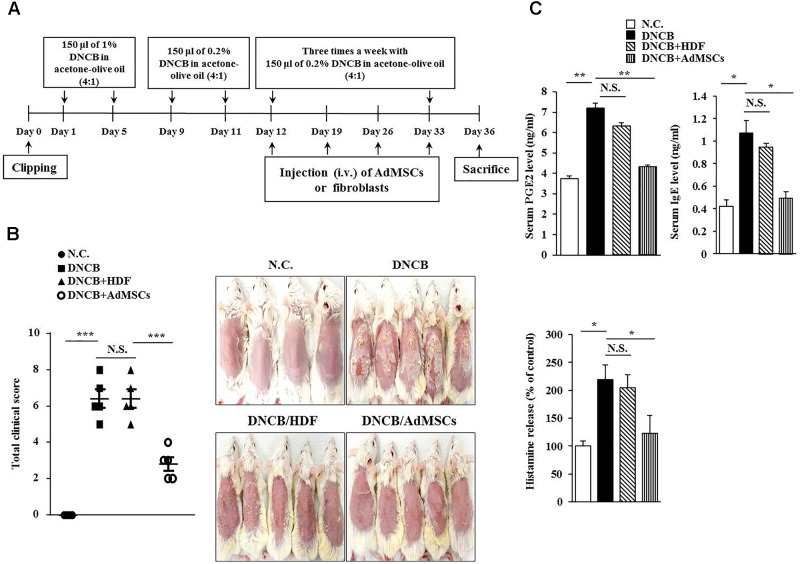
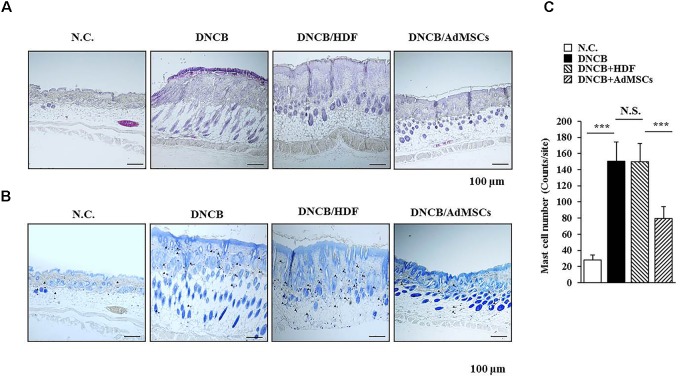
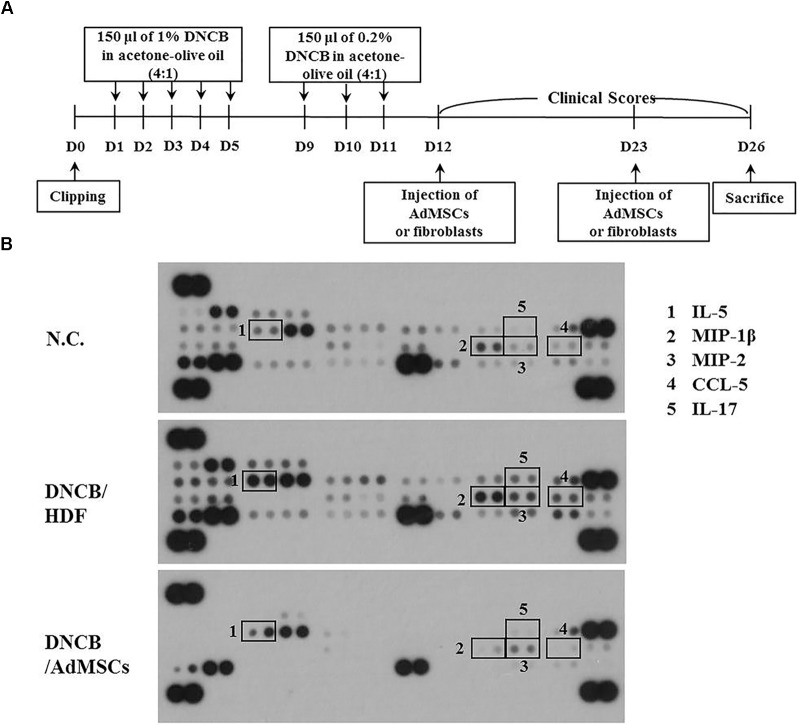
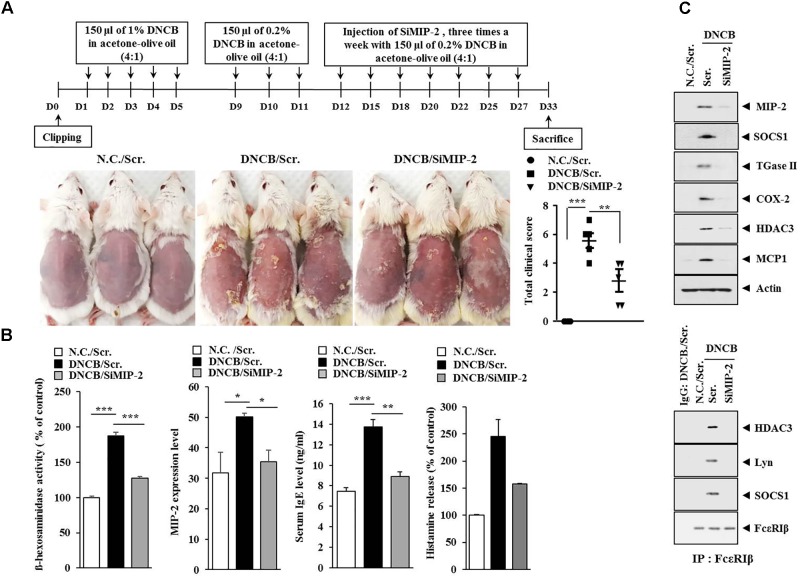
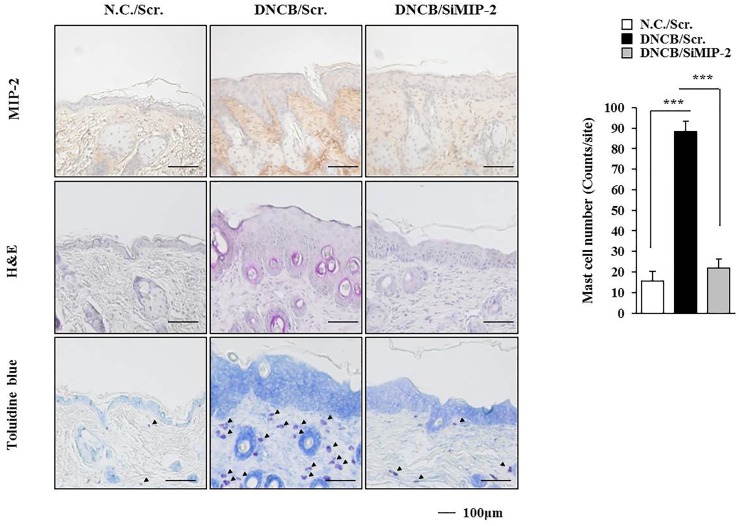
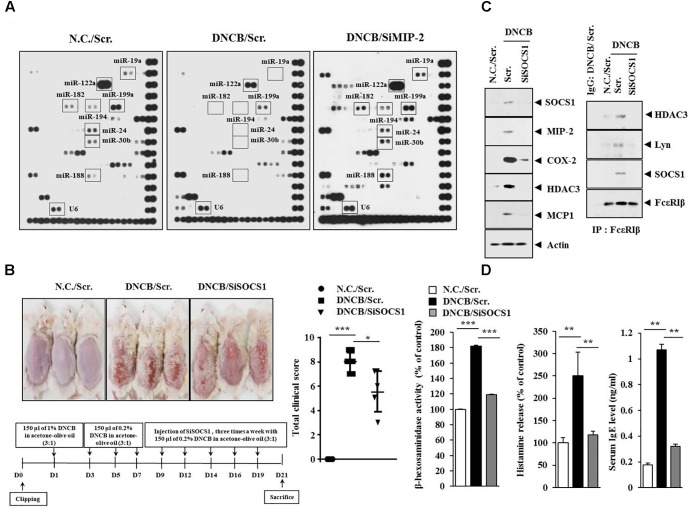
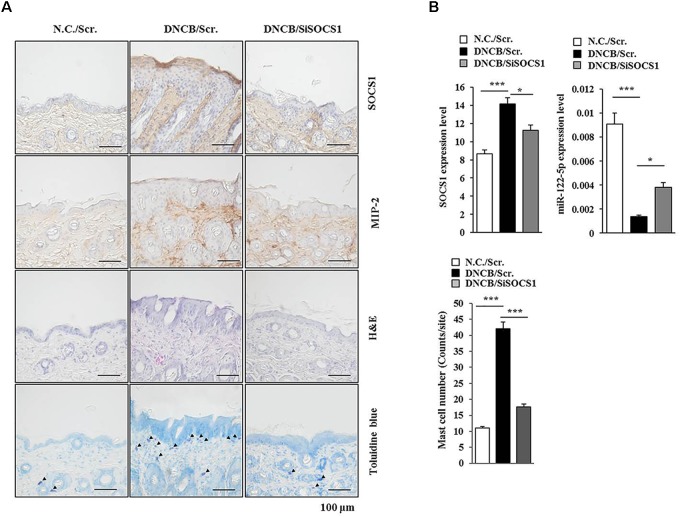
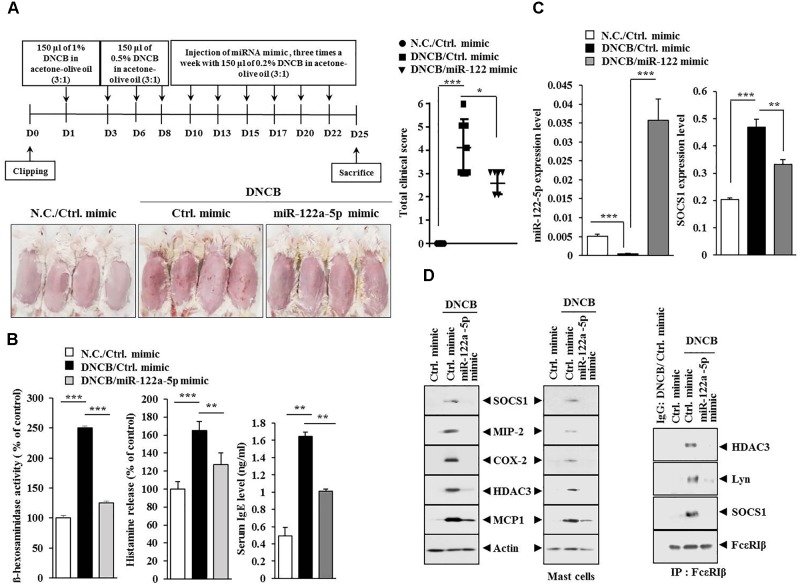
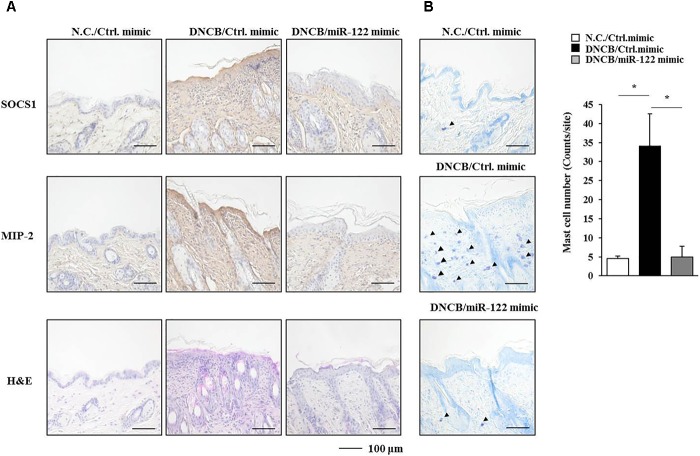
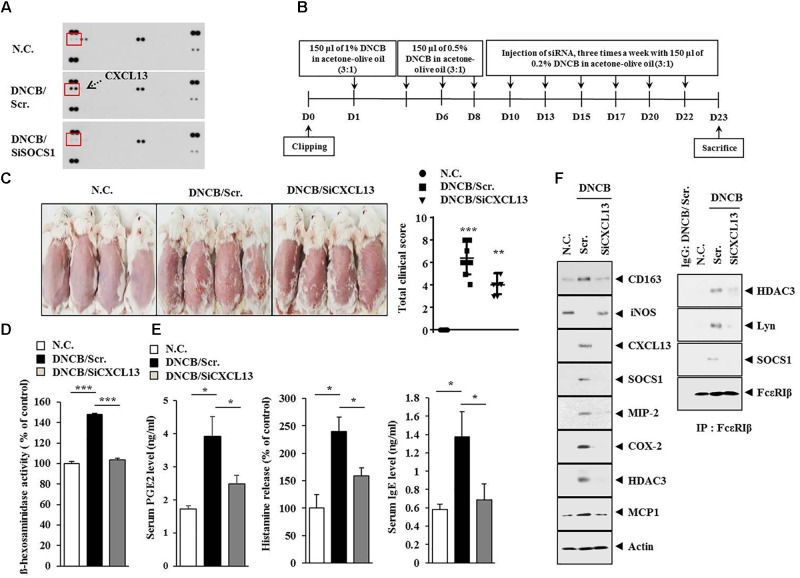
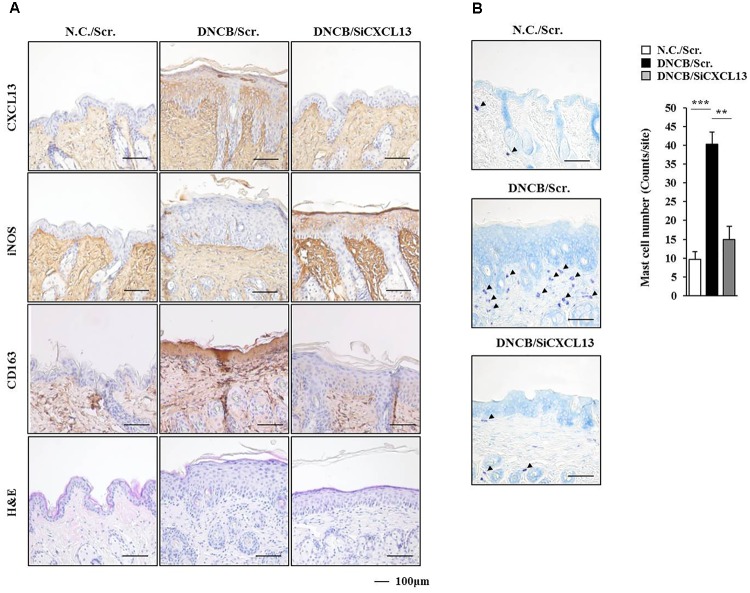
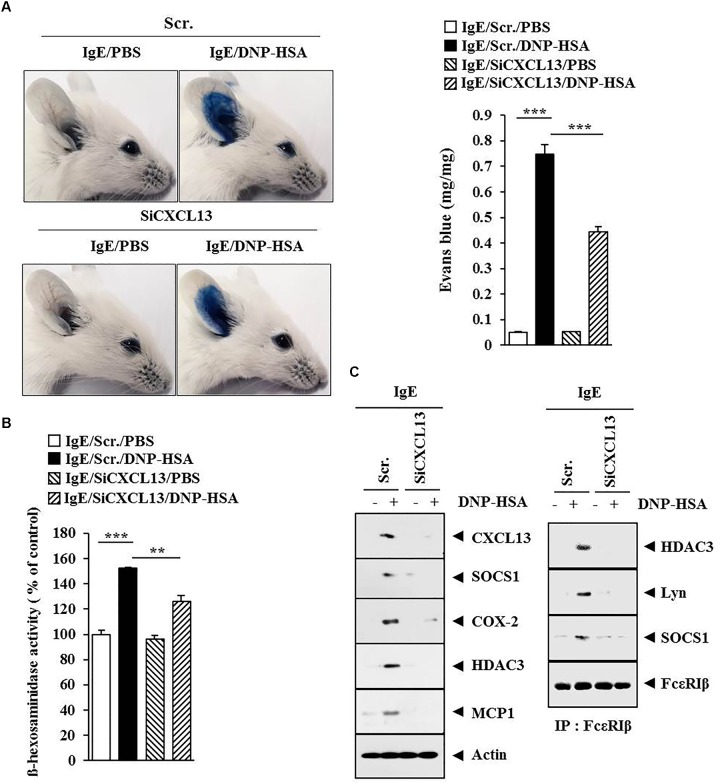
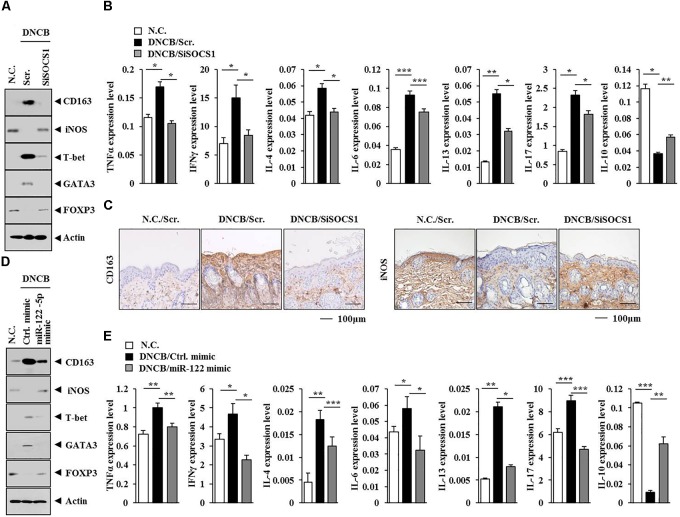
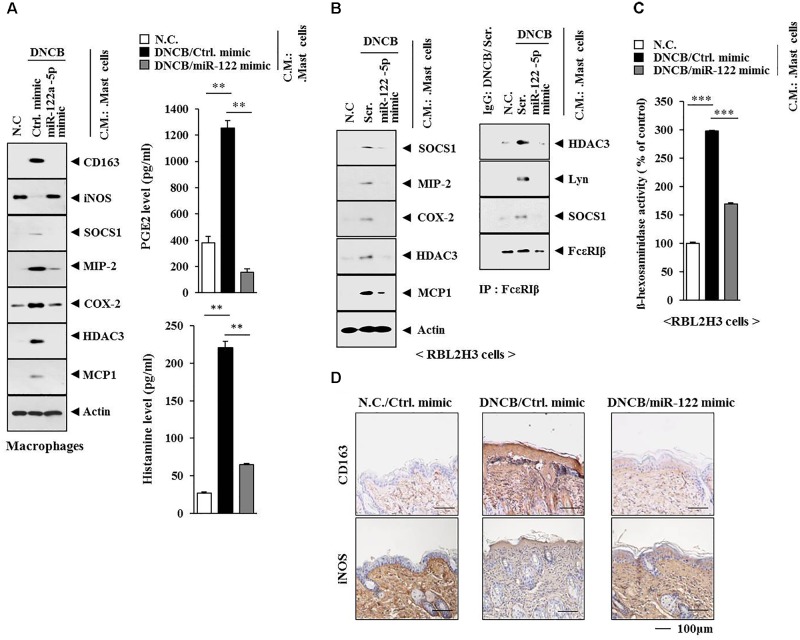
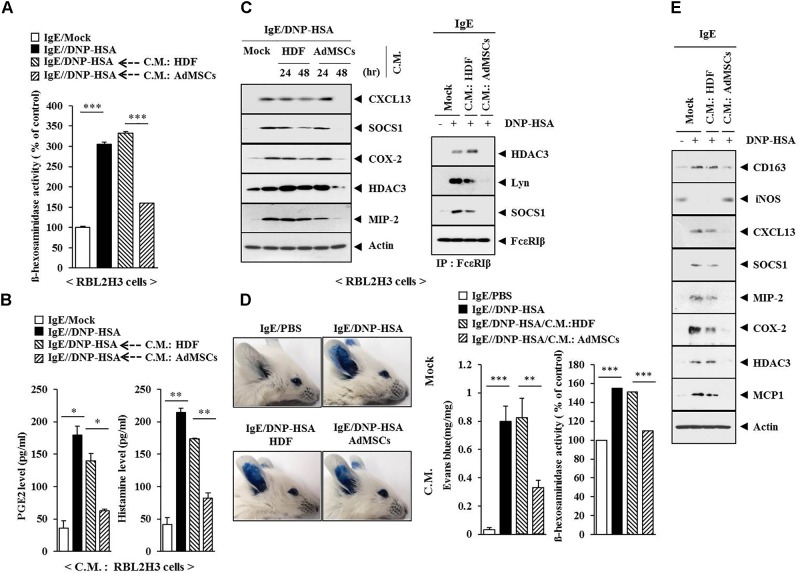
The objective of this study was to investigate the effect of human adipose tissue-derived mesenchymal stem cells (AdMSCs) on atopic dermatitis (AD) in the BALB/c mouse model. The AdMSCs attenuated clinical symptoms associated with AD, decreased numbers of degranulated mast cells (MCs), IgE level, amount of histamine released, and prostaglandin E2 level. Atopic dermatitis increased the expression levels of cytokines/chemokines, such as interleukin-5 (IL-5), macrophage inflammatory protein-1ß (MIP-1ß), MIP-2, chemokine (C-C motif) ligand 5 (CCL5), and IL-17, in BALB/c mouse. The AdMSCs showed decreased expression levels of these cytokines in the mouse model of AD. In vivo downregulation of MIP-2 attenuated the clinical symptoms associated with AD. Atopic dermatitis increased the expression levels of hallmarks of allergic inflammation, induced interactions of Fc𝜀RIβ with histone deacetylase 3 (HDAC3) and Lyn, increased ß-hexosaminidase activity, increased serum IgE level, and increased the amount of histamine released in an MIP-2-dependent manner. Downregulation of MIP-2 increased the levels of several miRNAs, including miR-122a-5p. Mouse miR-122a-5p mimic inhibited AD, while suppressor of cytokine signaling 1 (SOCS1), a predicted downstream target of miR-122a-5p, was required for AD. The downregulation of SOCS1 decreased the expression levels of MIP-2 and chemokine (C-X-C motif) ligand 13 (CXCL13) in the mouse model of AD. The downregulation of CXCL13 attenuated AD and allergic inflammation such as passive cutaneous anaphylaxis. The role of T cell transcription factors in AD was also investigated. Atopic dermatitis increased the expression levels of T-bet and GATA-3 [transcription factors of T-helper 1 (Th1) and T-helper 2 (Th2) cells, respectively] but decreased the expression of Foxp3, a transcription factor of regulatory T (Treg) cells, in an SOCS1-dependent manner. In addition to this, miR-122a-5p mimic also prevented AD from regulating the expression of T-bet, GATA-3, and Foxp3. Atopic dermatitis increased the expression of cluster of differentiation 163 (CD163), a marker of M2 macrophages, but decreased the expression of inducible nitric oxide synthase (iNOS), a marker of M1 macrophages. Additionally, SOCS1 and miR-122a-5p mimic regulated the expression of CD163 and iNOS in the mouse model of AD. Experiments employing conditioned medium showed interactions between MCs and macrophages in AD. The conditioned medium of AdMSCs, but not the conditioned medium of human dermal fibroblasts, negatively inhibited the features of allergic inflammation. In summary, we investigated the anti-atopic effects of AdMSCs, identified targets of AdMSCs, and determined the underlying mechanism for the anti-atopic effects of AdMSCs.

Keywords: MIP-2; SOCS1; adipose tissue-derived stem cells; atopic dermatitis; cellular interactions; miR-122a-5p; targets of stem cells.


Figures

FIGURE 1
FIGURE 1
Human adipose tissue-derived mesenchymal stem cells (AdMSCs) attenuate the clinical symptoms associated with atopic dermatitis (AD). (A) 2, 4-dinitro chlorobenzene (DNCB) was employed to induce AD in BALB/c mice. Human dermal fibroblasts (HDFs) or AdMSCs were intravenously injected once a week. (B) At the indicated day (day 36) after the induction of AD, clinical scores of BALB/c mice of each experimental group were determined. ∗∗∗p < 0.0005. N.C., negative control; N.S., not significant. (C) Sera of BALB/c mice of each experimental group were employed for the determination of prostaglandin E2 (PGE2) level, IgE level, and the amount of histamine released. p < 0.05; ∗∗p < 0.005.
FIGURE 2
FIGURE 2
AdMSCs inhibit features of AD. (A) Skin tissues of BALB/c mice of each experimental group were isolated at the time of sacrifice and were subjected to hematoxylin & eosin (H&E) staining. (B,C) Same as (A) except that toluidine blue staining was performed to determine the number of degranulated mast cells. ∗∗∗p < 0.0005. Closed triangle represents degranulated mast cells. Scale bars represent 100 μm.
FIGURE 3
FIGURE 3
Identification of cytokines subjected to opposite regulations by AD and AdMSCs. (A) Shows the experimental time line to determine cytokines that mediate AD and serve as targets of AdMSCs. (B) Serum of BALB/c mouse of each experimental group was subjected to cytokine array analysis. Serum was obtained at the time of sacrifice.
FIGURE 4
FIGURE 4
Macrophage inflammatory proten-2 (MIP-2) is necessary for AD. (A) Shows the experimental time line to determine the effect of MIP-2 on AD. Lower figure shows the effect of MIP-2 on clinical symptoms associated with AD. ∗∗p < 0.005; ∗∗∗p < 0.0005. (B) Skin tissue lysates were subjected to ß-hexosaminidase activity assay and qRT-PCR analysis. Serum IgE level and the amount of histamine released were also determined. p < 0.05; ∗∗p < 0.005; ∗∗∗p < 0.0005. (C) Tissue lysates from the mice of each experimental group were subjected to western blot analysis and immunoprecipitation by employing the indicated antibody (2 μg/ml). Tissue lysates from BALB/c mouse injected with scrambled (scr.) following the induction of AD by DNCB were also immunoprecipitated with isotype-matched IgG antibody (2 μg/ml).
FIGURE 5
FIGURE 5
Induction of the features of AD occurs in an MIP-2-dependent manner. Skin tissues of BALB/c mice of each experimental group were isolated at the time of sacrifice and were subjected to immunohistochemical staining by employing anti-MIP-2 antibody (2 μg/ml) and H&E staining. Toluidine blue staining was also performed to determine the number of degranulated mast cells. Closed triangle represents degranulated mast cells. ∗∗∗p < 0.0005.
FIGURE 6
FIGURE 6
Suppressor of cytokine signaling 1 (SOCS1) is necessary for DNCB-induced AD. (A) Skin tissue lysates of BALB/c mice of each experimental group were subjected to miRNA array analysis. (B) Shows the experimental time line to determine the effect of MIP-2 on AD (lower). Upper figure shows the effect of SOCS1 on clinical symptoms associated with AD. p < 0.05; ∗∗∗p < 0.0005. (C) Tissue lysates from the mice of each experimental group were subjected to western blot or immunoprecipitation by employing the indicated antibody (2 μg/ml). Tissue lysates from BALB/c mouse injected with scr. following the induction of AD was also immunoprecipitated with isotype-matched IgG antibody (2 μg/ml). (D) Tissue lysates from the mice of each experimental group were subjected to ß-hexosaminidase activity assays (left). Sera of BALB/c mice were employed for the determination of the amount of histamine released (middle) and IgE level (right). ∗∗p < 0.005; ∗∗∗p < 0.0005.
FIGURE 7
FIGURE 7
SOCS1 regulates the expression of miR-122a-5p and MIP-2. (A) Immunohistochemical staining by employing the indicated antibody was performed. Scale bar represents 10 μm. Skin tissues of BALB/c mice of each experimental group were isolated at the time of sacrifice and were also subjected to H&E staining. Toluidine blue staining was performed to determine the number of degranulated mast cells. Closed triangle represents degranulated mast cells. (B) Tissue lysates from mouse of each experimental group were subjected to qRT-PCR analysis. p < 0.05; ∗∗∗p < 0.0005. The number of degranulated mast cells was also determined. Closed triangle represents degranulated mast cells. Scale bars represent 100 μm.
FIGURE 8
FIGURE 8
miR-122a-5p mimic inhibits DNCB-induced AD. (A) Shows the experimental time line to determine the effect of miR-122a-5p mimic on AD (upper). Lower figure shows the effect of miR-122a-5p mimic on clinical symptoms associated with AD. p < 0.05; ∗∗∗p < 0.0005. (B) Tissue lysates from the mice of each experimental group were subjected to ß-hexosaminidase activity assays (left). Sera of BALB/c mice were employed for the determination of histamine release (middle) and IgE level (right). ∗∗p < 0.005; ∗∗∗p < 0.0005. (C) Tissue lysates from the mice of each experimental group were subjected to qRT-PCR analysis. ∗∗p < 0.005; ∗∗∗p < 0.0005. (D) Tissue lysates from the mice of each experimental group were subjected to western blot analysis (upper) or immunoprecipitation (lower) by employing the indicated antibody (2 μg/ml). Mast cell lysates from the skin tissue of the mice of each experimental group were also subjected to western blot analysis (upper right). Tissue lysates from BALB/c mouse injected with control (ctrl.) mimic following the induction of AD by DNCB were immunoprecipitated with isotype-matched IgG antibody (2 μg/ml).
FIGURE 9
FIGURE 9
miR-122a-5p mimic negatively regulates the expression of SOCS1, MIP-2, and the number of degranulated mast cells. (A) Immunohistochemical staining by employing the indicated antibody was performed. Scale bar represents 100 μm. H&E staining was also performed. (B) Skin tissues of BALB/c mice of each experimental group were isolated at the time of sacrifice and were subjected to toluidine blue staining to determine the number of degranulated mast cells. Closed triangle represents degranulated mast cells. Scale bar represents 100 μm. p < 0.05.
FIGURE 10
FIGURE 10
Chemokine (C-X-C motif) ligand 13 (CXCL13) is necessary for DNCB-induced AD. (A) Serum of BALB/c mouse of each experimental group was subjected to cytokine array analyses. Serum was obtained at the time of sacrifice. (B) Shows the experimental time line to determine the effect of CXCL13 on AD. (C) At the indicated day after the induction of AD, clinical scores of BALB/c mice of each experimental group were determined. ∗∗p < 0.005; ∗∗∗p < 0.0005. (D) Tissue lysates from the mice of each experimental group were subjected to ß-hexosaminidase activity assays. ∗∗∗p < 0.0005. (E) Sera of mice of each experimental group were employed for the determination of PGE2 level, IgE level, and the amount of histamine released. p < 0.05. (F) Tissue lysates from the mice of each experimental group were subjected to western blot analysis and immunoprecipitation by employing the indicated antibody (2 μg/ml).
FIGURE 11
FIGURE 11
DNCB-induced AD regulates the expression of markers of activated macrophages. (A) Immunohistochemical staining by employing the indicated antibody was performed. Scale bar represents 100 μm. Skin tissues of BALB/c mice of each experimental group were isolated at the time of sacrifice and were also subjected to H&E staining. (B) Toluidine blue staining was performed to determine the number of degranulated mast cells. Closed triangle represents degranulated mast cells. ∗∗p < 0.005; ∗∗∗p < 0.0005.
FIGURE 12
FIGURE 12
CXCL13 mediates passive cutaneous anaphylaxis. (A) Passive cutaneous anaphylaxis was performed as described. After 1 h of Evans blue solution injection, the dye was eluted from the ear in 700 μl of formamide at 63°C. The absorbance was measured at 620 nm. Representative images from four animals of each experimental group are shown. ∗∗∗p < 0.0005. (B) Ear tissue lysates from BALB/c mouse of each experimental group were subjected to β-hexosaminidase activity assay. ∗∗p < 0.005; ∗∗∗p < 0.0005. (C) Same as (B) except that western blot and immunoprecipitation were performed.
FIGURE 13
FIGURE 13
miR-122a-5p-SOCS1 negative feedback loop regulates TH1/TH2 and regulatory T (Treg) response during AD. (A,D) Tissue lysates from the mice of each experimental group were subjected to western blot analysis. (C) Skin tissues of BALB/c mice of each experimental group were subjected to immunohistochemical staining. Scale bar represents 100 μm. (B,E) Tissue lysates from the mice of each experimental group were subjected to qRT-PCR analysis.p < 0.05; ∗∗p < 0.005; ∗∗∗p < 0.0005.
FIGURE 14
FIGURE 14
Mast cell activation of macrophages occurs in AD. (A) Skin mast cells were isolated from BALB/c mice of each experimental group as described. The conditioned medium of mast cells isolated from BALB/c mouse of each experimental group was added to lung macrophages for 8 h, followed by western blot analysis (left). The conditioned medium of mast cells isolated from BALB/c mouse of each experimental group was subjected to PGE2 level assays and histamine release assays (right). ∗∗p < 0.005. C.M., conditioned medium. (B) Same as (A) except that rat basophilic leukemia cells, equivalent of mouse mast cells, were employed. Western blot and immunoprecipitation were performed. Tissue lysates from BALB/c mouse injected with ctrl. mimic following the induction of AD by DNCB were immunoprecipitated with isotype-matched IgG antibody (2 μg/ml). (C) Same as (B) except that ß-hexosaminidase activity assays were performed. ∗∗∗p < 0.0005. (D) Skin tissues of BALB/c mice of each experimental group were subjected to immunohistochemical staining. Scale bar represents 100 μm.
FIGURE 15
FIGURE 15
The conditioned medium of AdMSCs inhibits the features of allergic inflammation. (A) The IgE (100 ng/ml)-sensitized RBL2H3 cells were treated without or with the conditioned medium of HDFs or AdMSCs for 48 h, followed by stimulation with DNP-HSA (100 ng/ml) for 1 h. The ß-hexosaminidase activity assays were performed. ∗∗∗p < 0.0005. (B) Same as (A) except that PGE2 level and the amount of histamine released were determined by using the conditioned medium of RBL2H3 cells. p < 0.05; ∗∗p < 0.005. (C) The IgE (100 ng/ml)-sensitized RBL2H3 cells were treated without or with the conditioned medium of HDFs or AdMSCs for the indicated time, followed by stimulation with DNP-HSA (100 ng/ml) for 1 h. Western blot was performed. For immunoprecipitation, lysates from RBL2H3 cells treated without or with conditioned medium for 48 h were employed. (D) BALB/c mice were given an intradermal injection of IgE (0.5 μg/kg) and intravenous injection of the conditioned medium of HDFs or AdMSCs (each at 200 μl/mouse). Representative images from four animals of each experimental group are shown. Ear tissue lysates from BALB/c mouse of each experimental group were subjected to β-hexosaminidase activity assays. ∗∗p < 0.005; ∗∗∗p < 0.0005. (E) Ear tissue lysates were subjected to western blot analysis.

Similar articles

Cited by

References

    1. Ahmadi M., Rahbarghazi R., Soltani S., Aslani M. R., Keyhanmanesh R. (2016). Contributory anti-inflammatory effects of mesenchymal stem cells, not conditioned media, on ovalbumin-induced asthmatic changes in male rats. Inflammation 39 1960–1971. 10.1007/s10753-016-0431-2 - DOI - PubMed
    1. Ano S., Morishima Y., Ishii Y., Yoh K., Yageta Y., Ohtsuka S., et al. (2013). Transcription factors GATA-3 and RORγt are important for determining the phenotype of allergic airway inflammation in a murine model of asthma. J. Immunol. 190 1056–1065. 10.4049/jimmunol.1202386 - DOI - PubMed
    1. Asari S., Itakura S., Ferreri K., Liu C. P., Kuroda Y., Kandeel F., et al. (2009). Mesenchymal stem cells suppress B-cell terminal differentiation. Exp. Hematol. 37 604–615. 10.1016/j.exphem.2009.01.005 - DOI - PMC - PubMed
    1. Chimenti I., Smith R. R., Li T. S., Gerstenblith G., Messina E., Giacomello A., et al. (2010). Relative roles of direct regeneration versus paracrine effects of human cardiosphere-derived cells transplanted into infarcted mice. Circ. Res. 106 971–980. 10.1161/CIRCRESAHA.109.210682 - DOI - PMC - PubMed
    1. Cho B. S., Kim J. O., Ha D. H., Yi Y. W. (2018). Exosomes derived from human adipose tissue-derived mesenchymal stem cells alleviate atopic dermatitis. Stem Cell Res. Ther. 9:187. 10.1186/s13287-018-0939-5 - DOI - PMC - PubMed