. 2018 Nov 6:9:611.
doi: 10.3389/fendo.2018.00611. eCollection 2018.

Tissue-Based Mapping of the Fathead Minnow (Pimephales promelas) Transcriptome and Proteome

Affiliations

Tissue-Based Mapping of the Fathead Minnow (Pimephales promelas) Transcriptome and Proteome

Candice Lavelle et al. Front Endocrinol (Lausanne). .

Abstract

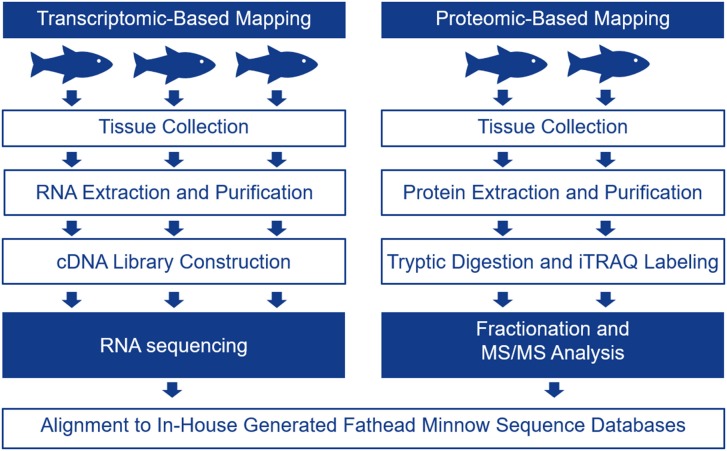
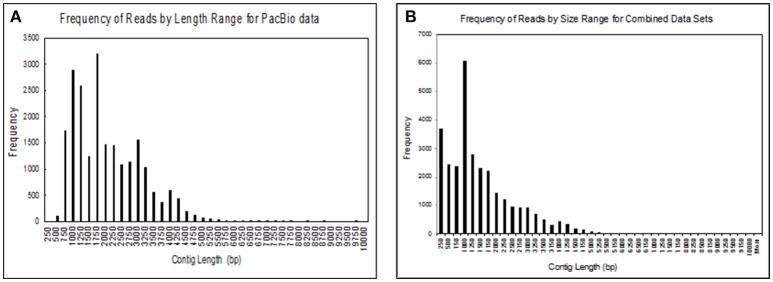
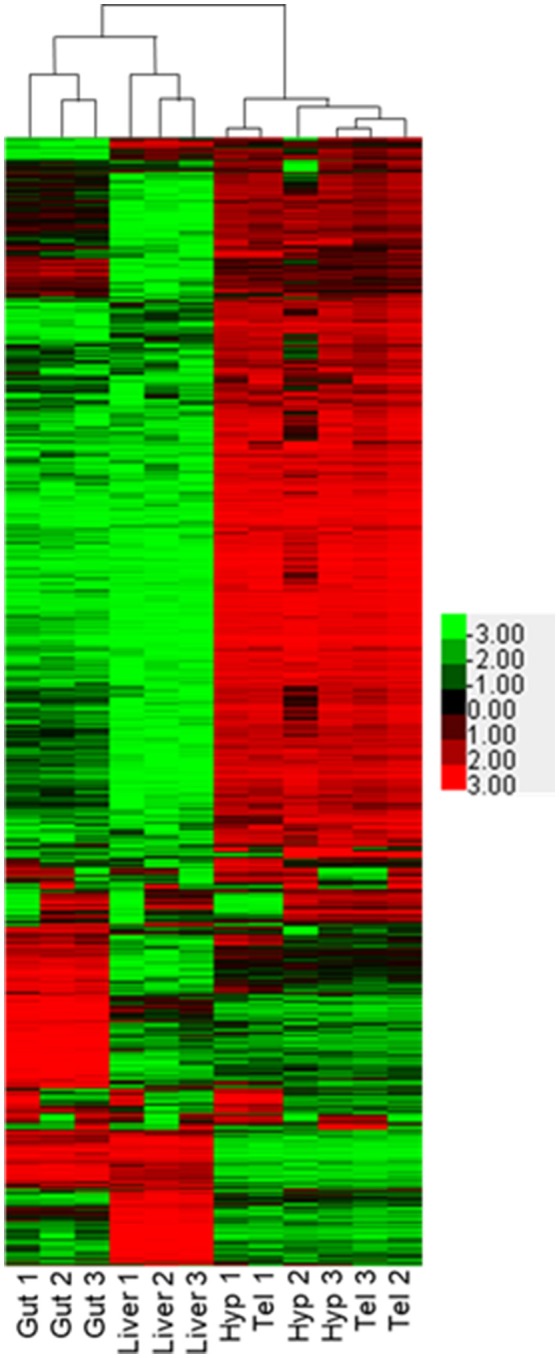
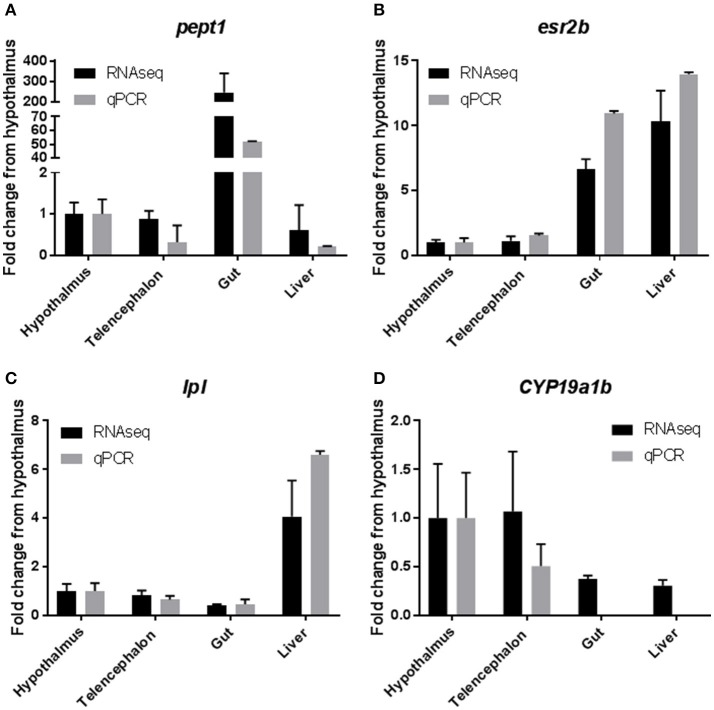
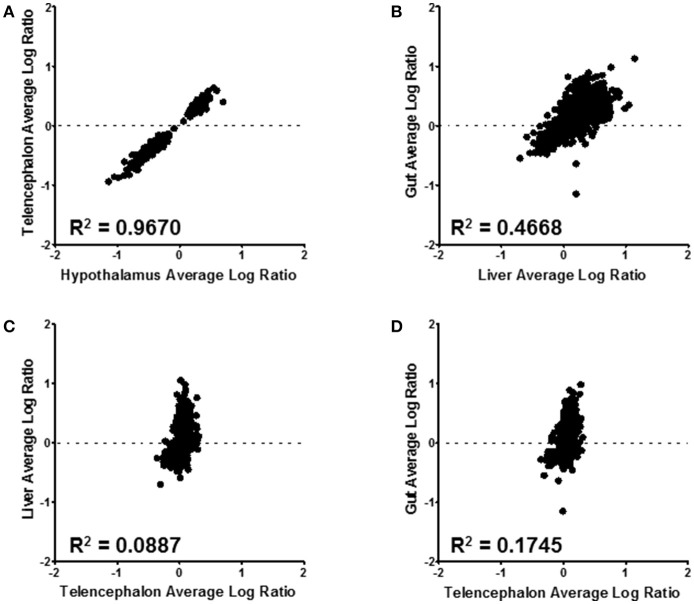
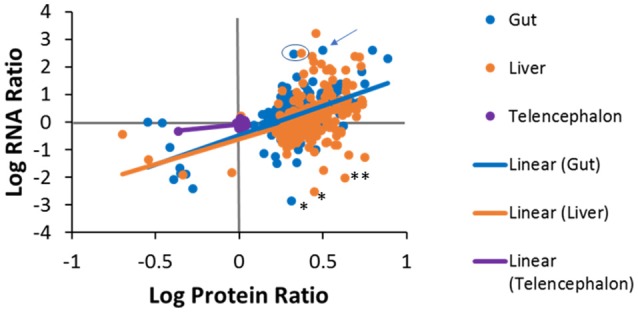
Omics approaches are broadly used to explore endocrine and toxicity-related pathways and functions. Nevertheless, there is still a significant gap in knowledge in terms of understanding the endocrine system and its numerous connections and intricate feedback loops, especially in non-model organisms. The fathead minnow (Pimephales promelas) is a widely used small fish model for aquatic toxicology and regulatory testing, particularly in North America. A draft genome has been published, but the amount of available genomic or transcriptomic information is still far behind that of other more broadly studied species, such as the zebrafish. Here, we used a proteogenomics approach to survey the tissue-specific proteome and transcriptome profiles in adult male fathead minnow. To do so, we generated a draft transcriptome using short and long sequencing reads from liver, testis, brain, heart, gill, head kidney, trunk kidney, and gastrointestinal tract. We identified 30,378 different putative transcripts overall, with the assembled contigs ranging in size from 264 to over 9,720 nts. Over 17,000 transcripts were >1,000 nts, suggesting a robust transcriptome that can be used to interpret RNA sequencing data in the future. We also performed RNA sequencing and proteomics analysis on four tissues, including the telencephalon, hypothalamus, liver, and gastrointestinal tract of male fish. Transcripts ranged from 0 to 600,000 copies per gene and a large portion were expressed in a tissue-specific manner. Specifically, the telencephalon and hypothalamus shared the most expressed genes, while the gastrointestinal tract and the liver were quite distinct. Using protein profiling techniques, we identified a total of 4,045 proteins in the four tissues investigated, and their tissue-specific expression pattern correlated with the transcripts at the pathway level. Similarly to the findings with the transcriptomic data, the hypothalamus and telencephalon had the highest degree of similarity in the proteins detected. The main purpose of this analysis was to generate tissue-specific omics data in order to support future aquatic ecotoxicogenomic and endocrine-related studies as well as to improve our understanding of the fathead minnow as an ecological model.

Keywords: endocrine system; fathead minnow; proteogenomics; proteome; tissue-specific; transcriptome.


Figures

Figure 1
Figure 1
Schematic showing the experimental protocol followed to generate tissue-specific mRNA and protein data for four tissues including the telencephalon, hypothalamus, liver, and gut. Tissue-specific mRNA expression was evaluated with RNA-seq using 3 male biological replicates while tissue-specific protein expression was evaluated using iTRAQ in 2 male biological replicates.
Figure 2
Figure 2
Size distribution of contigs obtained from (A) sequences obtained from the Pac Bio instrument for brain, liver, gut, testes, heart, gill, head kidney, and trunk kidney from one male fathead minnow; (B) assembled sequences from the PacBio data with several Illumina RNAseq datasets including the one performed in this study. The assembled sequences include transcripts from male and female fathead minnows obtained in various other experiments.
Figure 3
Figure 3
Comparison of transcriptional profiles for gut, liver, hypothalamus, and telencephalon. Heat map depicts Log2 (FPKM) of transcripts identified with at least 50 counts in at least three samples and a Max Value-Min Value >5. Hierarchical clustering was performed using Cluster 3.0 and visualized using Java Treeview.
Figure 4
Figure 4
Pathway studio representation of expression targets identified for (A) gut, (B), liver, and (C) brain. All of the expression targets identified in any tissue were mapped by pathway studio to their cellular location by the GO categories. The ID's for the expression targets are found in Supplementary Table 6.
Figure 5
Figure 5
Confirmation of RNAseq results with quantitative PCR. Selected genes from the RNAseq data set were used to confirm the results by qPCR. Results are presented as mean ± standard deviation fold change from the hypothalamus tissue. (A) Peptide Transporter 1 (pept1). (B) Estrogen Receptor 2b (esr2b). (C) Lipoprotein Lipase (lpl). (D) Cytochrome P450 19a1b (cyp19a1b).
Figure 6
Figure 6
Tissue level comparisons of all confidently quantified protein ratios. All tissue comparisons had a p-value ≤ 0.001. Hypothalmus to telencephalon correlation was made by using the liver as the denominator of the ratio calculation (A); while the gut to liver (B), liver to telencephalon (C), and gut to telencephalon (D) were made using the hypothalamus as the normalizing tissue. The R2 value for each correlation is displayed on the corresponding graph.
Figure 7
Figure 7
Tissue specific correlations between protein log ratios and RNA log ratios for genes that were identified in both experiments. Solid lines are tissue-specific regression lines. Examples discussed in the manuscript text are denoted with the following symbols; * fatty acid binding protein 7 (fabp7), ** (gapdh), the arrow points to dipeptidase 1 (dpep1) and the blue circle encloses carboxypeptidase A1 (cpa1) in the liver and the gut.
Figure 8
Figure 8
Subnetwork enrichment analysis of the transcriptome for the gut. The figure represents the joining of 4 top pathways identified by the analysis. Genes encircled in green were also found to be enriched in the gut in the proteomics experiment. ABCA1, ATP-binding cassette, sub-family A (ABC1), member 1; ABCB1, ATP-binding cassette, sub-family B (MDR/TAP), member 1; ABCB4, ATP-binding cassette, sub-family B (MDR/TAP), member 4; ABCC2, ATP-binding cassette, sub-family C (CFTR/MRP), member 2; ABCG5, ATP-binding cassette, sub-family G (WHITE), member 5; ABCG8, ATP-binding cassette, sub-family G (WHITE), member 8; ACSL1, acyl-CoA synthetase long-chain family member 1; ANPEP, alanyl (membrane) aminopeptidase; APOE, apolipoprotein E; CASP3, caspase 3, apoptosis-related cysteine peptidase; CCL20, chemokine (C-C motif) ligand 20; CD36, CD36 molecule (thrombospondin receptor); CD4, CD4 molecule; CDX1, caudal type homeobox 1; CFD, complement factor D (adipsin); CYP7A1, cytochrome P450, family 7, subfamily A, polypeptide 1; DAB2, disabled homolog 2, mitogen-responsive phosphoprotein; DGAT1, diacylglycerol O-acyltransferase 1; DGAT2, diacylglycerol O-acyltransferase 2; EFNA1, ephrin-A1; EPCAM, epithelial cell adhesion molecule; F11R, F11 receptor; FABP2, fatty acid binding protein 2, intestinal; GATA4, GATA binding protein 4; GCG, glucagon; GHRL, ghrelin/obestatin prepropeptide; GUCY2C, guanylate cyclase 2C (heat stable enterotoxin receptor); KRT8, keratin 8; LDLR, low density lipoprotein receptor; LSS, lanosterol synthase (2,3-oxidosqualene-lanosterol cyclase); MOGAT2, monoacylglycerol O-acyltransferase 2; MOGAT3, monoacylglycerol O-acyltransferase 3; NFE2L2, nuclear factor (erythroid-derived 2)-like 2; NR1H4, nuclear receptor subfamily 1, group H, member 4; NR1I2, nuclear receptor subfamily 1, group I, member 2; OCLN, occludin, PPARA, peroxisome proliferator-activated receptor alpha; PTGS2, prostaglandin-endoperoxide synthase 2 (prostaglandin G/H synthase and cyclooxygenase), SCARB1, scavenger receptor class B, member 1; SLC27A4, solute carrier family 27 (fatty acid transporter), member 4; SLC6A4, solute carrier family 6 (neurotransmitter transporter, serotonin), member 4; SLC9A2, solute carrier family 9, subfamily A (NHE2, cation proton antiporter 2), member 2; SOAT1, sterol O-acyltransferase 1; ST14, suppression of tumorigenicity 14 (colon carcinoma); TACR3, tachykinin receptor 3, TGFA, transforming growth factor, alpha; TNFRSF1A, tumor necrosis factor receptor superfamily, member 1A, UCP1, uncoupling protein 1 (mitochondrial, proton carrier), ZFPM1, zinc finger protein, multitype 1.
Figure 9
Figure 9
Subnetwork enrichment analysis of the transcriptome for the liver. The figure represents the joining of 3 top pathways identified by the analysis. Genes encircled in green were also found to be enriched in the liver in the proteomics experiment. ABCC2, ATP-binding cassette, sub-family C (CFTR/MRP), member 2; AMBP, alpha-1-microglobulin/bikunin precursor; AOC1, amiloride binding protein 1 [amine oxidase (copper-containing)]; ARG1,arginase, liver; BAX, BCL2-associated X protein; CAT, catalase; CYP2A, cytochrome P450, family 2, subfamily A; CYP7A1, cytochrome P450, family 7, subfamily A, polypeptide 1; EDNRA, endothelin receptor type A; ENPP2, ectonucleotide pyrophosphatase/phosphodiesterase 2; EPCAM, epithelial cell adhesion molecule; ERRFI1, ERBB receptor feedback inhibitor 1; F10, coagulation factor X; F2, coagulation factor II (thrombin); F5, coagulation factor V (proaccelerin, labile factor); FGF19, fibroblast growth factor 19; FN1, fibronectin 1; FOXA1, forkhead box A1; FPGS, olylpolyglutamate synthase; G0S2, G0/G1switch 2; GALK1, galactokinase 1; GATA4, GATA binding protein 4; GATA5, GATA binding protein 5; GCG, glucagon; GCK, glucokinase (hexokinase 4); GHR, growth hormone receptor; GNMT, glycine N-methyltransferase; GYS2, glycogen synthase 2 (liver); HAMP, hepcidin antimicrobial peptide; HHEX, hematopoietically expressed homeobox; HMGCR, 3-hydroxy-3-methylglutaryl-CoA reductase; HMOX1, heme oxygenase (decycling) 1; HNF1B, HNF1 homeobox B; HPD, 4-hydroxyphenylpyruvate dioxygenase; HSD3B1, hydroxy-delta-5-steroid dehydrogenase, 3 beta- and steroid delta-isomerase 1; IGF2, insulin-like growth factor 2 (somatomedin A); IGFBP1, insulin-like growth factor binding protein 1; IL6R, interleukin 6 receptor; IRS2, insulin receptor substrate 2; ITGA2B, integrin, alpha 2b (platelet glycoprotein IIb of IIb/IIIa complex, antigen CD41); LDLR, low density lipoprotein receptor; LPL, lipoprotein lipase; LRP5, low density lipoprotein receptor-related protein 5; MET, met proto-oncogene (hepatocyte growth factor receptor); MST1, macrophage stimulating 1 (hepatocyte growth factor-like); MYC, v-myc myelocytomatosis viral oncogene homolog (avian); NPR1, natriuretic peptide receptor A/guanylate cyclase A (atrionatriuretic peptide receptor A); NR0B1, nuclear receptor subfamily 0, group B, member 1; NR0B2, nuclear receptor subfamily 0, group B, member 2; NR1H4, nuclear receptor subfamily 1, group H, member 4; NR1I2, nuclear receptor subfamily 1, group I, member 2; OCLN, occludin; PCK2, phosphoenolpyruvate carboxykinase 2 (mitochondrial); PCYT2, phosphate cytidylyltransferase 2, ethanolamine; PLIN2, perilipin 2; RBPJ, recombination signal binding protein for immunoglobulin kappa J region; SERPINA1, serpin peptidase inhibitor, clade A (alpha-1 antiproteinase, antitrypsin), member 1; SERPINF2, serpin peptidase inhibitor, clade F (alpha-2 antiplasmin, pigment epithelium derived factor), member 2; SLC13A5, solute carrier family 13 (sodium-dependent citrate transporter), member 5; SLC2A2, solute carrier family 2 (facilitated glucose transporter), member 2; SNX7, sorting nexin 7; SOD1, superoxide dismutase 1, soluble; TAT, tyrosine aminotransferase; TM4SF4, transmembrane 4 L six family member 4; TNFSF10, tumor necrosis factor (ligand) superfamily, member 10; TOB1, transducer of ERBB2, 1; TXNIP, thioredoxin interacting protein; VTN, vitronectin.
Figure 10
Figure 10
Subnetwork enrichment analysis of the transcriptome for the brain. The figure represents the joining of 5 top pathways identified by the analysis. Genes encircled in green were also found to be enriched in the brain in the proteomics experiment. ADRA2A, adrenoceptor alpha 2A; ARHGEF25, Rho guanine nucleotide exchange factor (GEF) 25; ARL4D, ADP-ribosylation factor-like 4D; BSX, brain-specific homeobox; CALB2, calbindin 2; DGKZ, diacylglycerol kinase, zeta 104kDa; ESM1, endothelial cell-specific molecule 1; GATA2, GATA binding protein 2; GFRA1, GDNF family receptor alpha 1; HDC, histidine decarboxylase; HTRA1, HtrA serine peptidase 1; LGI3, leucine-rich repeat LGI family, member 3; LHX1, LIM homeobox 1; MCAM, melanoma cell adhesion molecule; NEFL, neurofilament, light polypeptide; NEFM, neurofilament, medium polypeptide; NR5A1, nuclear receptor subfamily 5, group A, member 1; PCP4, Purkinje cell protein 4; PLP1, proteolipid protein 1; POMC, proopiomelanocortin; PRRX1, paired related homeobox 1; S100B, S100 calcium binding protein B; SATB2, SATB homeobox 2; SIX6, SIX homeobox 6; SLC18A2, solute carrier family 18 (vesicular monoamine), member 2; TAC1, tachykinin, precursor 1; TFAP2B, transcription factor AP-2 beta (activating enhancer binding protein 2 beta); TH, tyrosine hydroxylase; TWIST1,Twist homolog 1.

Similar articles

Cited by

References

    1. Garcia-Reyero N, Perkins EJ. Systems biology: leading the revolution in ecotoxicology. Environ Toxicol Chem. (2011) 30:265–73. 10.1002/etc.401 - DOI - PubMed
    1. Williams TD, Turan N, Diab AM, Wu H, Mackenzie C, Bartie KL, et al. . Towards a system level understanding of non-model organisms sampled from the environment: a network biology approach. PLoS Comput Biol. (2011) 7:e1002126. 10.1371/journal.pcbi.1002126 - DOI - PMC - PubMed
    1. Armengaud J, Trapp J, Pible O, Geffard O, Chaumot A, Hartmann EM. Non-model organisms, a species endangered by proteogenomics. J Proteomics (2014) 105:5–18. 10.1016/j.jprot.2014.01.007 - DOI - PubMed
    1. Uhlen M, Fagerberg L, Hallstrom BM, Lindskog C, Oksvold P, Mardinoglu A, et al. . Proteomics. Tissue-based map of the human proteome Science (2015) 347:1260419. 10.1126/science.1260419 - DOI - PubMed
    1. Garcia-Reyero N, Griffitt RJ, Liu L, Kroll KJ, Farmerie WG, Barber DS, et al. . Construction of a robust microarray from a non-model species (largemouth bass) using pyrosequencing technology. J Fish Biol. (2008) 72:2354–76. 10.1111/j.1095-8649.2008.01904.x - DOI - PMC - PubMed