

Delineating species along shifting shorelines: Tropheus (Teleostei, Cichlidae) from the southern subbasin of Lake Tanganyika
- PMID: 30459820
- PMCID: PMC6234679
- DOI: 10.1186/s12983-018-0287-4
Delineating species along shifting shorelines: Tropheus (Teleostei, Cichlidae) from the southern subbasin of Lake Tanganyika
Abstract
Background: Species delineation is particularly challenging in taxa with substantial intra-specific variation. In systematic studies of fishes, meristics and linear measurements that describe shape are often used to delineate species. Yet, little is known about the taxonomic value of these two types of morphological characteristics. Here, we used Tropheus (Teleostei, Cichlidae) from the southern subbasin of Lake Tanganyika to test which of these types of characters best matched genetic lineages that could represent species in this group of stenotypic rock-dwelling cichlids. We further investigated intra-population variation in morphology. By linking this to a proxy of a population's age, we could assess the evolutionary stability of different kinds of morphological markers.
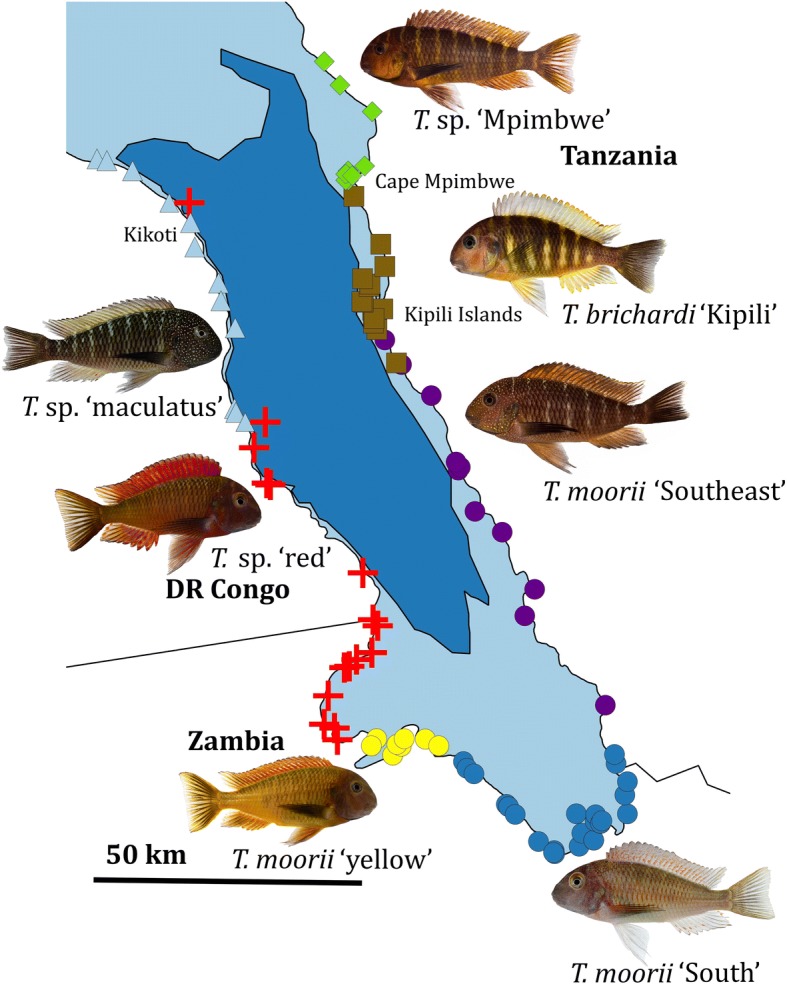
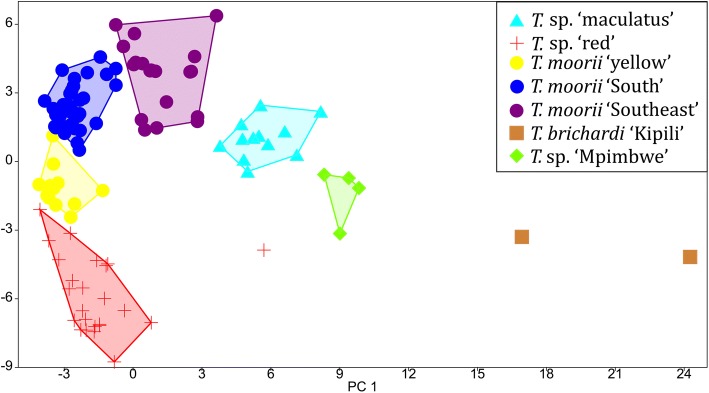
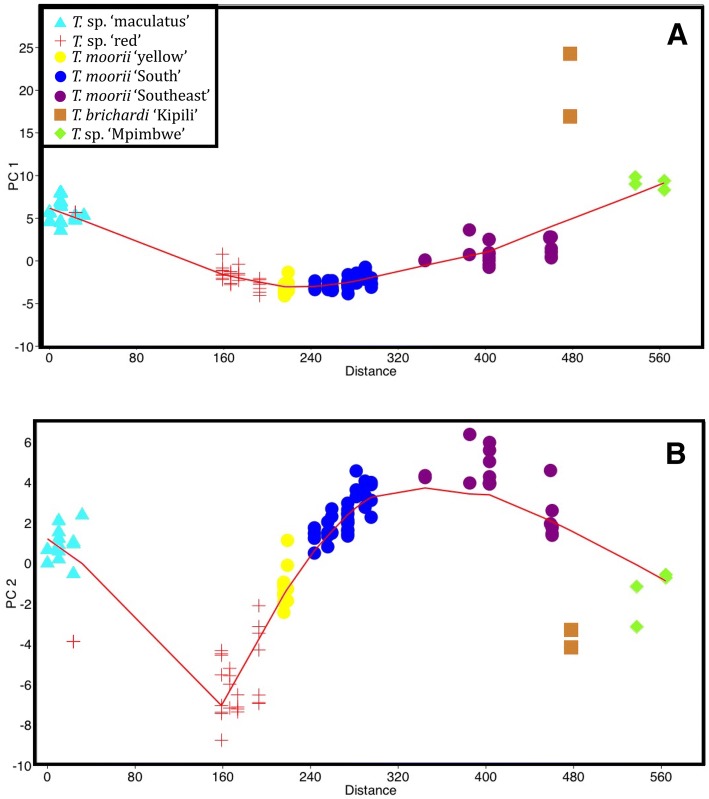
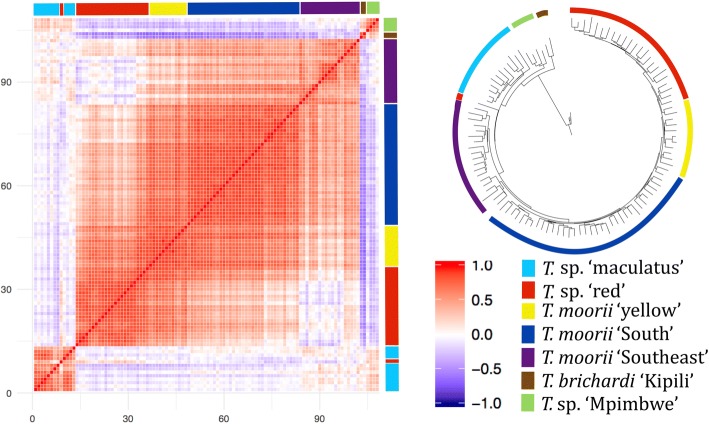
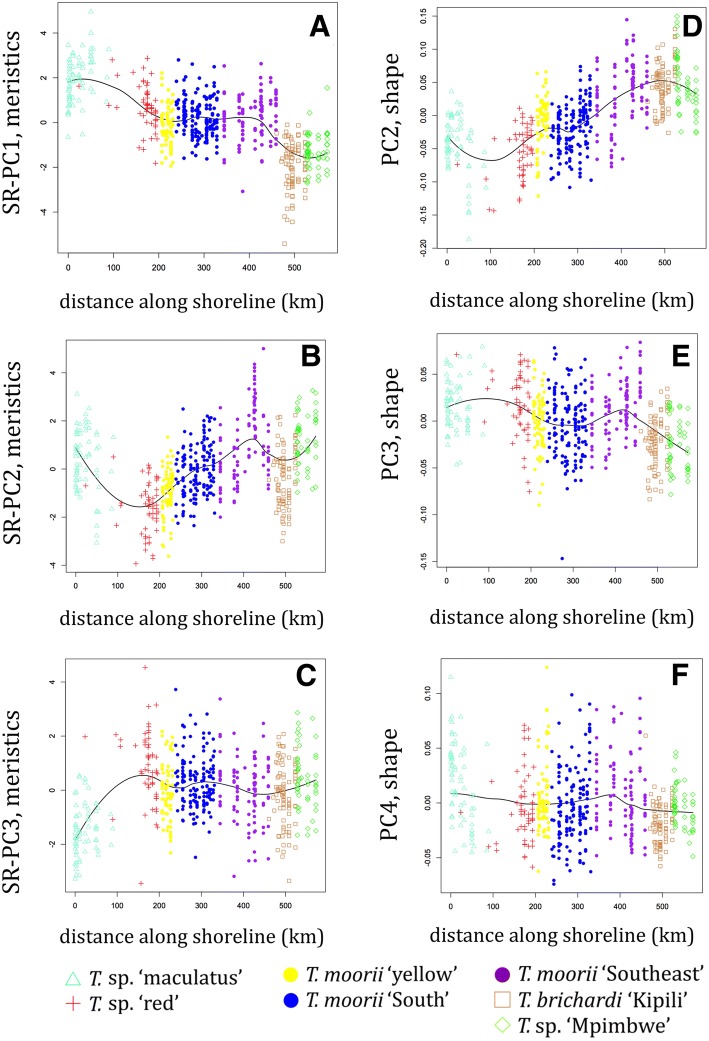
Results: Morphological data was collected from 570 specimens originating from 86 localities. An AFLP approach revealed the presence of five lineages in the southern subbasin: T. moorii, T. brichardi, T. sp. 'maculatus', T. sp. 'Mpimbwe' and T. sp. 'red', which we consider to represent distinct species. Although both types of morphological data supported this classification, a comparison of PST-values that describe inter-population morphological differentiation, revealed a better correspondence between the taxon delineation based on AFLP data and the patterns revealed by an analysis of meristics than between the AFLP-based taxon delineation and the patterns revealed by an analysis of shape. However, classifying southern populations of Tropheus was inherently difficult as they contained a large amount of clinal variation, both in genetic and in morphological data, and both within and among species. A scenario is put forward to explain the current-day distribution of the species and colour varieties and the observed clinal variation across the subbasin's shoreline. Additionally, we observed that variation in shape was larger in populations from shallow shores whereas populations from steep shores were more variable in meristics. This difference is explained in terms of the different timescales at which small and large scale lake level fluctuations affected populations of littoral cichlids at steep and shallow shores.
Conclusions: Our results showed meristics to be more evolutionary stable, and of higher taxonomic value for species delimitation in Tropheus, than linear measurements that describe shape. These results should be taken into account when interpreting morphological differences between populations of highly stenotypic species, such as littoral cichlids from the Great East African Lakes.
Keywords: AFLP; Africa; Body shape; Clinal variation; Evolution; Meristics; Morphology; PST; Population differentiation; Species delimitation.
Conflict of interest statement
The authors declare that they have no competing interests.Not applicable.Not applicable.Springer Nature remains neutral with regard to jurisdictional claims in published maps and institutional affiliations.
Figures

References
-
- Mayr E. The growth of biological thought: diversity, evolution and inheritance. Cambridge: Harvard University Belknap Press; 1982.
-
- de Queiroz K. Species concepts and species delimitation. Syst Biol. 2007;56:8798886. - PubMed
-
- Kaufman LS, Chapman LJ, Chapman CA. Evolution in fast forward: haplochromine fishes of the Lake Victoria region. Endeavour. 1997;21:23–30. doi: 10.1016/S0160-9327(96)10034-X. - DOI
-
- Snoeks J. How well known is the ichthyodiversity of the large east African lakes? Adv Ecol Res. 2000;31:17–38. doi: 10.1016/S0065-2504(00)31005-4. - DOI
LinkOut - more resources
Full Text Sources
