Novel peptide dermaseptin-PS1 exhibits anticancer activity via induction of intrinsic apoptosis signalling
- PMID: 30461197
- PMCID: PMC6349196
- DOI: 10.1111/jcmm.14032
Novel peptide dermaseptin-PS1 exhibits anticancer activity via induction of intrinsic apoptosis signalling
Abstract
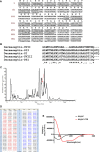
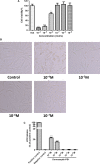
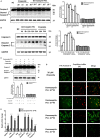
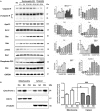
Antimicrobial peptides (AMP) secreted by the granular glands of frog skin have been widely reported to exhibit strong bacteriostatic and bactericidal activities. Many of them have been documented with potent antiproliferative effects on multiple cancer cells, many studies also suggested that AMPs exert their functions via disrupting cell membranes. However, whether and how other cell death induction mechanism is involved in mammalian cancer cells has rarely been investigated. In this study, a novel AMP named Dermaseptin-PS1 was isolated and identified from Phyllomedusa sauvagei, it showed strong antimicrobial activities against three types of microorganisms. In vitro antiproliferative studies on human glioblastoma U-251 MG cells indicated that Dermaseptin-PS1 disrupted cell membranes at the concentrations of 10-5 M and above, while the cell membrane integrity was not affected when concentrations were decreased to 10-6 M or lower. Further examinations revealed that, at the relatively low concentration (10-6 M), Dermaseptin-PS1 induced apoptosis through mitochondrial-related signal pathway in U-251 MG cells. Thus, for the first time, we report a novel frog skin derived AMP with anticancer property by distinct mechanisms, which largely depends on its concentration. Together, our study provides new insights into the mechanism-illustrated drug design and the optimisation of dose control for cancer treatment in clinic.
Keywords: antimicrobial peptides; apoptosis; concentration; dermaseptin; mitochondria.
© 2018 The Authors. Journal of Cellular and Molecular Medicine published by Foundation for Cellular and Molecular Medicine and John Wiley & Sons Ltd.
Figures


Similar articles
-
Two Novel Dermaseptin-Like Antimicrobial Peptides with Anticancer Activities from the Skin Secretion of Pachymedusa dacnicolor.Toxins (Basel). 2016 May 12;8(5):144. doi: 10.3390/toxins8050144. Toxins (Basel). 2016. PMID: 27187467 Free PMC article.
-
Evaluating the Bioactivity of a Novel Antimicrobial and Anticancer Peptide, Dermaseptin-PS4(Der-PS4), from the Skin Secretion of Phyllomedusa sauvagii.Molecules. 2019 Aug 16;24(16):2974. doi: 10.3390/molecules24162974. Molecules. 2019. PMID: 31426323 Free PMC article.
-
Dermaseptin-PH: A Novel Peptide with Antimicrobial and Anticancer Activities from the Skin Secretion of the South American Orange-Legged Leaf Frog, Pithecopus (Phyllomedusa) hypochondrialis.Molecules. 2017 Oct 24;22(10):1805. doi: 10.3390/molecules22101805. Molecules. 2017. PMID: 29064402 Free PMC article.
-
Dermaseptins as models for the elucidation of membrane-acting helical amphipathic antimicrobial peptides.Curr Pharm Biotechnol. 2011 Aug;12(8):1184-93. doi: 10.2174/138920111796117319. Curr Pharm Biotechnol. 2011. PMID: 21470155 Review.
-
The dermaseptin superfamily: a gene-based combinatorial library of antimicrobial peptides.Biochim Biophys Acta. 2009 Aug;1788(8):1537-50. doi: 10.1016/j.bbamem.2008.09.006. Epub 2008 Sep 26. Biochim Biophys Acta. 2009. PMID: 18929530 Review.
Cited by
-
Bioinspired Bola-Type Peptide Dendrimers Inhibit Proliferation and Invasiveness of Glioblastoma Cells in a Manner Dependent on Their Structure and Amphipathic Properties.Pharmaceutics. 2020 Nov 18;12(11):1106. doi: 10.3390/pharmaceutics12111106. Pharmaceutics. 2020. PMID: 33217976 Free PMC article.
-
Exploration of the Structure-Function Relationships of a Novel Frog Skin Secretion-Derived Bioactive Peptide, t-DPH1, through Use of Rational Design, Cationicity Enhancement and In Vitro Studies.Antibiotics (Basel). 2021 Dec 14;10(12):1529. doi: 10.3390/antibiotics10121529. Antibiotics (Basel). 2021. PMID: 34943741 Free PMC article.
-
MiR-210 inhibits hypoxia-induced apoptosis of smooth muscle cells via targeting MEF2C.Int J Clin Exp Pathol. 2019 May 1;12(5):1846-1858. eCollection 2019. Int J Clin Exp Pathol. 2019. PMID: 31934008 Free PMC article.
-
Mechanistic role of long non-coding RNAs in the pathogenesis of metabolic dysfunction-associated steatotic liver disease and fibrosis.eGastroenterology. 2024 Nov;2(4):e100115. doi: 10.1136/egastro-2024-100115. Epub 2024 Nov 18. eGastroenterology. 2024. PMID: 39872125 Free PMC article.
-
Recent Advances in Multifunctional Antimicrobial Peptides as Immunomodulatory and Anticancer Therapy: Chromogranin A-Derived Peptides and Dermaseptins as Endogenous versus Exogenous Actors.Pharmaceutics. 2022 Sep 22;14(10):2014. doi: 10.3390/pharmaceutics14102014. Pharmaceutics. 2022. PMID: 36297449 Free PMC article. Review.
References
-
- Wen PY, Kesari S. Malignant gliomas in adults. N Engl J Med. 2008;359:492‐507. - PubMed
-
- Westphal M, Lamszus K. The neurobiology of gliomas: from cell biology to the development of therapeutic approaches. Nat Rev Neurosci. 2011;12:495‐508. - PubMed
-
- Capello A, Krenning EP, Bernard BF, Breeman WA, Erion JL, de Jong M. Anticancer activity of targeted proapoptotic peptides. J Nucl Med. 2006;47:122‐129. - PubMed
-
- de Kroon AI, Dolis D, Mayer A, Lill R, de Kruijff B. Phospholipid composition of highly purified mitochondrial outer membranes of rat liver and Neurospora crassa. Is cardiolipin present in the mitochondrial outer membrane? Biochim Biophys Acta. 1997;1325:108‐116. - PubMed
-
- Horvath SE, Daum G. Lipids of mitochondria. Prog Lipid Res. 2013;52:590‐614. - PubMed
Publication types
MeSH terms
Substances
LinkOut - more resources
Full Text Sources
Medical
Molecular Biology Databases

