. 2019 Feb 1;316(2):H314-H325.
doi: 10.1152/ajpheart.00580.2018. Epub 2018 Nov 21.

Disruption of cardiac Med1 inhibits RNA polymerase II promoter occupancy and promotes chromatin remodeling

Affiliations

Disruption of cardiac Med1 inhibits RNA polymerase II promoter occupancy and promotes chromatin remodeling

Duane D Hall et al. Am J Physiol Heart Circ Physiol. .

Abstract

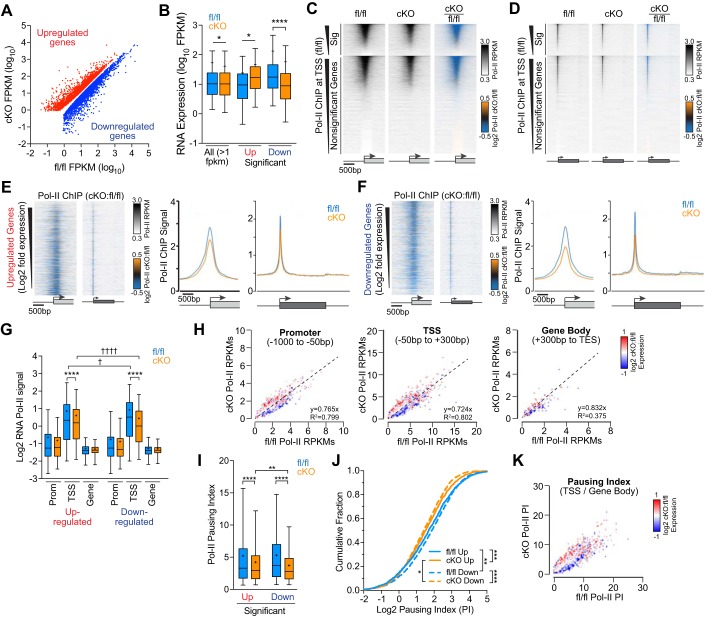
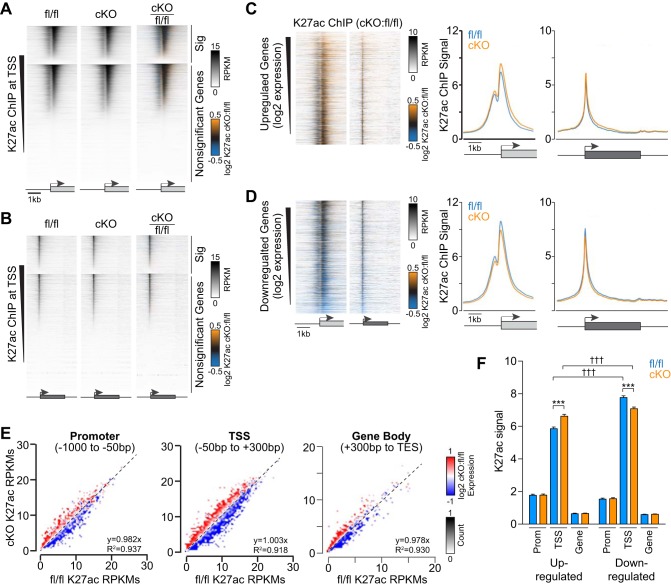
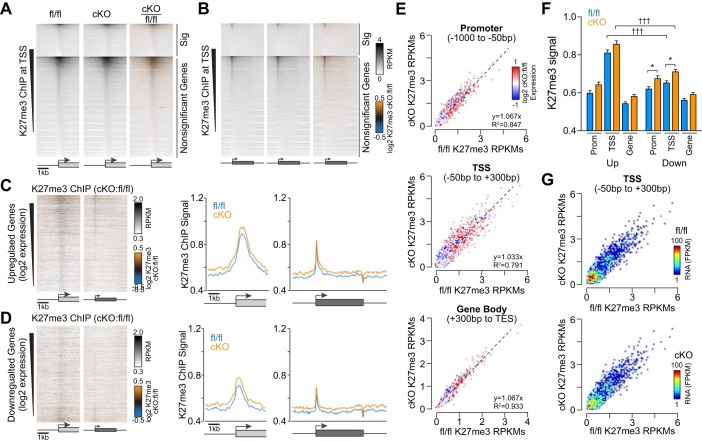
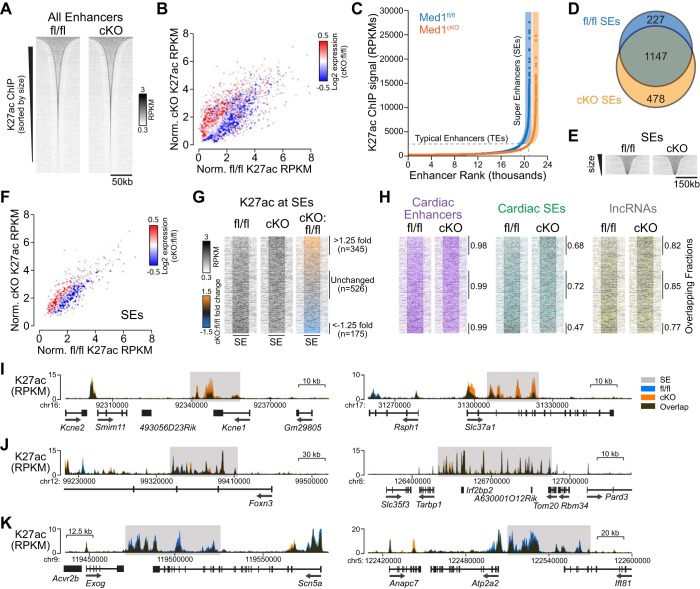
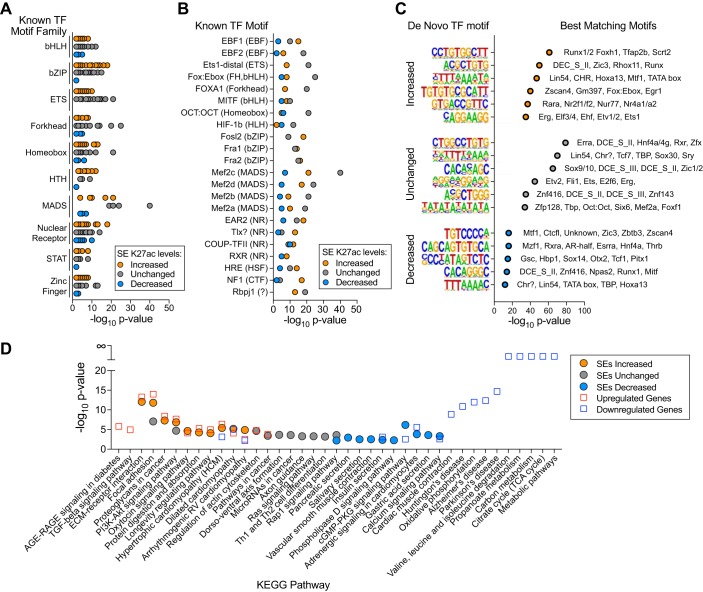
The Mediator coactivator complex directs gene-specific expression by binding distal enhancer-bound transcription factors through its Med1 subunit while bridging to RNA polymerase II (Pol II) at gene promoters. In addition, Mediator scaffolds epigenetic modifying enzymes that determine local DNA accessibility. Previously, we found that deletion of Med1 in cardiomyocytes deregulates more than 5,000 genes and promotes acute heart failure. Therefore, we hypothesized that Med1 deficiency disrupts enhancer-promoter coupling. Using chromatin immunoprecipitation-coupled deep sequencing (ChIP-seq; n = 3/ChIP assay), we found that the Pol II pausing index is increased in Med1 knockout versus floxed control mouse hearts primarily due to a decrease in Pol II occupancy at the majority of transcriptional start sites without a corresponding increase in elongating species. Parallel ChIP-seq assays reveal that Med1-dependent gene expression correlates strongly with histone H3 K27 acetylation, which is indicative of open and active chromatin at transcriptional start sites, whereas H3 K27 trimethylated levels, representing condensed and repressed DNA, are broadly increased and inversely correlate with absolute expression levels. Furthermore, Med1 deletion leads to dynamic changes in acetyl-K27 associated superenhancer regions and their enriched transcription factor-binding motifs that are consistent with altered gene expression. Our findings suggest that Med1 is important in establishing enhancer-promoter coupling in the heart and supports the proposed role of Mediator in establishing preinitiation complex formation. We also found that Med1 determines chromatin accessibility within genes and enhancer regions and propose that the composition of transcription factors associated with superenhancer changes to direct gene-specific expression. NEW & NOTEWORTHY Based on our previous findings that transcriptional homeostasis and cardiac function are disturbed by cardiomyocyte deletion of the Mediator coactivator Med1 subunit, we investigated potential underlying changes in RNA polymerase II localization and global chromatin accessibility. Using chromatin immunoprecipitation sequencing, we found that disrupted transcription arises from a deficit in RNA polymerase II recruitment to gene promoters. Furthermore, active versus repressive chromatin marks are redistributed within gene loci and at enhancer regions correlated with gene expression changes.

Keywords: RNA polymerase II; chromatin immunoprecipitation-coupled deep sequencing; enhancer; heart; histone H3 lysine 27; mediator.


Conflict of interest statement

No conflicts of interest, financial or otherwise, are declared by the authors.

Figures

Fig. 1.
Fig. 1.
RNA polymerase II (Pol II) occupancy at transcription start sites (TSSs) and Pol II traveling into gene bodies is decreased in Med1 knockout hearts. A: scatterplot of significant differentially expressed upregulated (red) and downregulated (blue) genes from RNA-seq analysis of Med1 fl/fl versus Med1 cardiac-specific knockout (cKO) hearts [fragments per kilobase per million mapped reads (FPKM), n = 5, false discovery rate < 0.05) (46). B: box plot of summary data from A including average FPKM values for all gene expressed at >1 FPKM in either genotype. *P < 0.05 and ****P < 0.0001 by two-way ANOVA (n = 2,852–11,941, P < 0.0001) with Sidak’s multiple-comparison test. C and D: Pol II chromatin immunoprecipitation (ChIP) signal heat maps at TSSs (C) and across genes normalized for size (D) from Med1 fl/fl (left) and cKO (middle) hearts with ratiometric differences pseudocolored (right) as indicated. Genes were segregated for significant differential gene expression based on RNA sequencing and ranked in descending order of Pol II occupancy by ChIP-coupled deep sequencing (ChIP-seq). Boxes and arrows under the heat map widows denote genes and TSSs, respectively. RPKM, normalized reads per kilobase of sequence regions per million mapped reads. E and F, left: ratiometric heat maps of Pol II ChIP signals at TSSs and genes for significantly upregulated (E) and downregulated (F) genes >1.5-fold and sorted by descending log2 cKO:fl/fl fold changes in expression. E and F, right: average Pol II ChIP signals at TSSs and along gene bodies for up- and downregulated genes. G: box plot summary data of normalized Pol II ChIP-seq signal intensities at promoters (−1,000 to −50 bp), TSSs (−50 to +300 bp), and gene bodies [+300 bp to the transcriptional end site (TES)] for genes with 1.5-fold differential expression. n = 1,978–2,178. ****P < 0.0001 for fl/fl vs. cKO; †P < 0.05 and ††††P < 0.0001 for >1.5-fold up- vs. downregulated genes by two-way ANOVA with Sidak’s multiple-comparison test. H: scatterplots of normalized Pol II ChIP signals at promoters (left), TSSs (middle), and gene bodies (right) from Med1 fl/fl and cKO hearts ratiometric colored for relative gene expression. IK: Pol II pausing index (PI) computed as the Pol II ChIP intensity ratio at TSSs versus gene bodies displayed as boxes and whiskers (n = 1,978–2,178, P < 0.0001 by one-way ANOVA with Tukey’s multiple comparisons test; I], cumulative values (by Kolmogorov-Smirnov tests; J), and scatter plots (K). *P < 0.05; **P < 0.01; ***P < 0.001; ****P < 0.0001.
Fig. 2.
Fig. 2.
Med1 deletion promotes the redistribution of active histone H3 K27 acetylation at genes to coincide with expression. A and B: heat maps of K27ac chromatin immunoprecipitation (ChIP) signal intensities from Med1 fl/fl and cardiac-specific knockout (cKO) ventricles within a 5-kb window flanking the transcriptional start site (TSS; A) and across gene bodies normalized for length (B). Genes were segregated for significant differential gene expression based on RNA sequencing and ranked by descending acetylation signal by ChIP-coupled deep sequencing (ChIP-seq). C and D, left: ratiometric heat maps of K27ac ChIP signals at TSSs and genes for upregulated (C) and downregulated (D) genes sorted by decreasing expression by RNA-seq. C and D, right: averaged K27ac ChIP signals at TSSs and along gene bodies for genes with >1.5-fold increase (C) or decrease (D) in gene expression. E: scatterplots of K27ac ChIP signals at promoters (left), TSSs (middle), and gene bodies (right) from fl/fl and cKO hearts ratiometric colored for relative gene expression. F: box plot summary data for normalized K27ac ChIP-seq signal intensities at promoters, TSSs, and gene bodies for genes with 1.5-fold differential expression. n = 1,978–2,178. ***P < 0.001 for fl/fl vs. cKO and †††P < 0.001 for up- vs. downregulated genes by two-way ANOVA (P < 0.0001) with Sidak’s multiple-comparison test.
Fig. 3.
Fig. 3.
Repressive histone H3 K27 trimethylation (K27me3) increases at gene loci after Med1 deletion. A and B.:K27me3 chromatin immunoprecipitation (ChIP) signal heat maps at transcriptional start sites (TSSs; A) and across genes normalized for size (B) from Med1 fl/fl and cardiac-specific knockout (cKO) hearts. Genes were segregated for significant differential gene expression based on RNA sequencing and ranked by descending methylation by ChIP-coupled deep sequencing (ChIP-seq). C and D, left: ratiometric heat maps of K27me3 ChIP signals at TSSs and genes for upregulated (C) and downregulated (D) genes sorted by decreasing expression. C and D, right: averaged K27ac ChIP signals at TSSs and along gene bodies for genes with >1.5-fold increase (C) or decrease (D) in gene expression. E: scatterplots of K27me3 ChIP signals at promoters (top), TSSs (middle), and gene bodies (bottom) from Med1 fl/fl and cKO hearts ratiometric colored for relative gene expression. F: box plot summary data for K27me3 ChIP-seq signal intensities at promoters, TSSs, and gene bodies for genes with 1.5-fold differential expression. n = 1,978–2,178. *P < 0.05 for fl/fl vs. cKO and †††P < 0.001 for up- vs. downregulated genes by two-way ANOVA (P < 0.0001) with Sidak’s multiple-comparison test. G: scatterplots of K27me3 ChIP-seq RPKMs at TSSs and ratiometric colored for RNA-seq reads of associated genes in Med1 fl/fl (top) and cKO (bottom) hearts.
Fig. 4.
Fig. 4.
Cardiac Med1 depletion leads to superenhancer (SE) switching. A: heat map size distribution of Med1 fl/fl and cardiac-specific knockout (cKO) enhancers identified by concatenating K27ac chromatin immunoprecipitation-coupled deep sequencing (ChIP-seq) peaks residing >2.5 kb from transcriptional start sites (TSSs) and within 12.5 kb of one another. B: scatterplot of normalized K27ac ChIP-seq reads of enhancers and psuedocolored log2 fold change expression of the nearest gene determined by RNA-seq. C: rank order distribution of enhancer K27ac ChIP-seq peaks. SEs are distinguished from typical enhancers by those peaks with the greatest signal as defined by Whyte et al. (49). D: Venn diagram of the Med1 fl/fl and cKO SE overlap. E: heat map size distribution of SEs. Note that the window size was 3 times of that in A. F: scatterplot for normalized SE K27ac reads and pseudocolored by the differential expression of the nearest gene. G: heat map representation of SEs sorted by the log2 ratio of cKO to fl/fl SE K27ac intensity. SEs > 1.25-fold, less than −1.25-fold, and without changes in K27ac ChIP intensities after Med1 cKO are indicated. H: heat maps as in G indicating SEs that overlap with previously reported cardiac developmental enhancers (magenta) (12), cardiac SEs (green) (27), and long noncoding RNAs (ENCODE; yellow). IK: example genomic tracks of SEs with stronger (I), unchanged (J), and weaker (K) K27ac ChIP-seq peak intensities after Med1 deletion.
Fig. 5.
Fig. 5.
Med1-sensitive superenhancer (SE) regions differentially affect transcription factor (TF) DNA-binding motifs and correlated with the Med1 cardiac-specific knockout (cKO) phenotype. A and B: DNA-binding motif enrichments for known TFs within SEs of 1.25-fold increased, unchanged, and 1.25-fold decreased cKO-to-fl/fl K27ac chromatin immunoprecipitation (ChIP) ratios displayed by TF family (A) or individually (B). C: significantly enriched de novo TF motifs within SEs and their closest matching known TF motifs. D: KEGG pathway enrichment results for genes with >2-fold differential expression and nearest to SEs after Med1 deletion. The top 10 hits for each category are shown.

Similar articles

Cited by

References

    1. Acevedo ML, Kraus WL. Mediator and p300/CBP-steroid receptor coactivator complexes have distinct roles, but function synergistically, during estrogen receptor alpha-dependent transcription with chromatin templates. Mol Cell Biol 23: 335–348, 2003. doi:10.1128/MCB.23.1.335-348.2003. - DOI - PMC - PubMed
    1. Ai S, Yu X, Li Y, Peng Y, Li C, Yue Y, Tao G, Li C, Pu WT, He A. Divergent requirements for EZH1 in heart development versus regeneration. Circ Res 121: 106–112, 2017. doi:10.1161/CIRCRESAHA.117.311212. - DOI - PMC - PubMed
    1. Anand P, Brown JD, Lin CY, Qi J, Zhang R, Artero PC, Alaiti MA, Bullard J, Alazem K, Margulies KB, Cappola TP, Lemieux M, Plutzky J, Bradner JE, Haldar SM. BET bromodomains mediate transcriptional pause release in heart failure. Cell 154: 569–582, 2013. doi:10.1016/j.cell.2013.07.013. - DOI - PMC - PubMed
    1. Aranda-Orgilles B, Saldaña-Meyer R, Wang E, Trompouki E, Fassl A, Lau S, Mullenders J, Rocha PP, Raviram R, Guillamot M, Sánchez-Díaz M, Wang K, Kayembe C, Zhang N, Amoasii L, Choudhuri A, Skok JA, Schober M, Reinberg D, Sicinski P, Schrewe H, Tsirigos A, Zon LI, Aifantis I. MED12 regulates HSC-specific enhancers independently of mediator kinase activity to control hematopoiesis. Cell Stem Cell 19: 784–799, 2016. doi:10.1016/j.stem.2016.08.004. - DOI - PMC - PubMed
    1. Baskin KK, Grueter CE, Kusminski CM, Holland WL, Bookout AL, Satapati S, Kong YM, Burgess SC, Malloy CR, Scherer PE, Newgard CB, Bassel-Duby R, Olson EN. MED13-dependent signaling from the heart confers leanness by enhancing metabolism in adipose tissue and liver. EMBO Mol Med 6: 1610–1621, 2014. doi:10.15252/emmm.201404218. - DOI - PMC - PubMed

Publication types

Substances