. 2019 Feb 1;121(2):672-689.
doi: 10.1152/jn.00788.2017. Epub 2018 Nov 21.

Intersegmental coordination patterns are differently affected in Parkinson's disease and cerebellar ataxia

Affiliations

Intersegmental coordination patterns are differently affected in Parkinson's disease and cerebellar ataxia

Simon D Israeli-Korn et al. J Neurophysiol. .

Abstract

The law of intersegmental coordination (Borghese et al. 1996) may be altered in pathological conditions. Here we investigated the contribution of the basal ganglia (BG) and the cerebellum to lower limb intersegmental coordination by inspecting the plane's orientation and other parameters pertinent to this law in patients with idiopathic Parkinson's disease (PD) or cerebellar ataxia (CA). We also applied a mathematical model that successfully accounts for the intersegmental law of coordination observed in control subjects (Barliya et al. 2009). In the present study, we compared the planarity index (PI), covariation plane (CVP) orientation, and CVP orientation predicted by the model in 11 PD patients, 8 CA patients, and two groups of healthy subjects matched for age, height, weight, and gender to each patient group (Ctrl_PD and Ctrl_CA). Controls were instructed to alter their gait speed to match those of their respective patient group. PD patients were examined after overnight withdrawal of anti-parkinsonian medications (PD-off-med) and then on medication (PD-on-med). PI was above 96% in all gait conditions in all groups suggesting that the law of intersegmental coordination is preserved in both BG and cerebellar pathology. However, the measured and predicted CVP orientations rotated in PD-on-med and PD-off-med compared with Ctrl_PD and in CA vs. Ctrl_CA. These rotations caused by PD and CA were in opposite directions suggesting differences in the roles of the BG and cerebellum in intersegmental coordination during human locomotion. NEW & NOTEWORTHY Kinematic and muscular synergies may have a role in overcoming motor redundancies, which may be reflected in intersegmental covariation. Basal ganglia and cerebellar networks were suggested to be involved in crafting and modulating synergies. We thus compared intersegmental coordination in Parkinson's disease and cerebellar disease patients and found opposite effects in some aspects. Further research integrating muscle activities as well as biomechanical and neural control modeling are needed to account for these findings.

Keywords: Parkinson’s disease; cerebellar ataxia; intersegmental coordination.


Conflict of interest statement

No conflicts of interest, financial or otherwise, are declared by the authors.

Figures
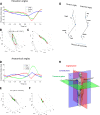
Fig. 1.
Fig. 1.
Elevation angles but not anatomical angles show planar covariation. This figure shows data from a healthy subject walking straight ahead, eyes open. A shows the time course of the three elevation angles: thigh, shank, and foot, of one gait cycle from heel strike to heel strike in one representative healthy subject. The dotted lines represent the raw data points and the continuous lines represent the curve fit function using a Fourier series up to the third harmonics from which the phase and amplitude parameters for the oscillators-based model were derived (see Eq. 6 in the methods section). B shows the same data represented in three dimensions whereby each data point comprises the elevation angle of each segment at a given point in time. The position of heel strike in the three-dimensional covariation loop in B is at the top right point and progression in time is counterclockwise. The units of all axes are degrees. C is equivalent to B but with a rotated viewing angle to demonstrate the high degree of planarity in the statistical structure of the data. D to F are equivalent to A to C only for the anatomical angles hip, knee and ankle. In contrast to elevation angles, there is no planar covariation of anatomical angles. In subplots B, C, E, and F, the u3 parameter is a unit vector orthogonal to the covariation plane. G and H demonstrate the distinction between elevation and anatomical angles. Note that anatomical angles are defined relative to the limb segment proximal and distal to the anatomical joint and, in contrast to elevation angles, without any relation to neither gravity nor the direction of locomotion.
Fig. 2.
Fig. 2.
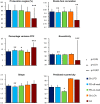
Basic gait parameters. Speed is well matched for all groups apart from PD-on-med where the matched controls walked slightly too slowly. Stride length is shorter in CA than CA controls, cycle duration was shorter for all patient groups than their controls, and stance width was narrower in PD-off-med and PD-on-med but wider in CA. Bars represent the means and error bars represent the standard deviations. CA, cerebellar ataxia; Ctrl_CA, control subjects matched for CA; Ctrl_PD, control subjects matched for Parkinson's disease; PD-off-med, Parkinson’s disease in off-medication state; PD-on-med, Parkinson’s disease in on-medication state. The P-values relate to the comparison between each patient group and their respective control group, namely: PD-off-med vs. Ctrl_PD, PD-on-med vs. Ctrl_PD and CA vs. Ctrl_CA.
Fig. 3.
Fig. 3.
Planarity index, shank-foot correlation, and covariation loop width. The law of intersegmental coordination is essentially preserved across all groups. Only in CA there is a reduced planarity index for the CA group which may be reflected by the reduced shank-foot correlation. Increased covariation loop width is reflected by an increase in the percentage variance of the 2nd principal component and a decrease in eccentricity. The contour of the covariation loop is “smoother” in PD-off-med as reflected by the lower “shape” parameter and less regular in CA (not significant). Bars represent the means and error bars represent the standard deviations. CA, cerebellar ataxia; Ctrl_CA, control subjects matched for CA; Ctrl_PD, control subjects matched for Parkinson's disease; PI, planarity index; PD-off-med, Parkinson’s disease in off-medication state; PD-on-med, Parkinson’s disease in on-medication state. The P-values relate to the comparison between each patient group and their respective control group, namely: PD-off-med vs. Ctrl_PD, PD-on-med vs. Ctrl_PD and CA vs. Ctrl_CA.
Fig. 4.
Fig. 4.
Parameters relating to predicted and actual plane orientation. The orientation of the CVP and parameters relating to the oscillators-based mathematical model predicting the CVP orientation. There is a large rotation effect in CA and a smaller rotation effect in PD in the opposite direction. Parameters relating to the mathematical model show group differences accordingly. In particular, there may be a scaling element as well as a phase shift element as reflected by the A1sA1f product to the CVP rotation effect in CA. The model error is less than 2° for all groups (P > 0.05). CA, cerebellar ataxia; Ctrl_CA, control subjects matched for CA; Ctrl_PD, control subjects matched for Parkinson's disease; CVP, covariation plane; PD-off-med, Parkinson’s disease in off-medication state; PD-on-med, Parkinson’s disease in on-medication state. The P-values relate to the comparison between each patient group and their respective control group, namely: PD-off-med vs. Ctrl_PD, PD-on-med vs. Ctrl_PD and CA vs. Ctrl_CA.
Fig. 5.
Fig. 5.
Illustration of the relationship between the elevation angle time courses and the covariation loop orientation of representative subjects from each subject group. A: PD-off-med, straight ahead, eyes open. B: Ctrl_PD, straight ahead, eyes open. C: CA, straight ahead, eyes open. D: Ctrl_CA, straight ahead, eyes open. CA, cerebellar ataxia; Ctrl_CA, control subjects matched for CA; Ctrl_PD, control subjects matched for Parkinson's disease; PD-off-med, Parkinson’s disease in off-medication state. The dotted lines in the top subplot for each subject represent the raw data points and the continuous lines represent the curve fit function using a Fourier series up to the third harmonics from which the phase and amplitude parameters for the oscillators-based model were derived (see Eq. 6 in the methods section).
Fig. 6.
Fig. 6.
The distribution of the orientation of the CVP and parameters relating to the oscillators-based mathematical model predicting the CVP orientation. Each curve represents the group-level distribution of the mean values per subject per condition pooled across subjects and conditions (A) and for the eyes open, straight ahead condition only (B), i.e., not from individual gait cycles. Each curve in C represents the distribution of the data from one subject for all gait cycles across all conditions without averaging. The curves in all the subplots represent the von Mises fit to the histogram data which is equivalent to the normal distribution for angular data, with the exception of the bottom-left subplot (A1sA1f product) which assumes a normal distribution. CA, cerebellar ataxia; Ctrl_CA, control subjects matched for CA; Ctrl_PD, control subjects matched for Parkinson's disease; CVP, covariation plane; PD-off-med, Parkinson’s disease in off-medication state; PD-on-med, Parkinson’s disease in on-medication state.
Fig. 7.
Fig. 7.
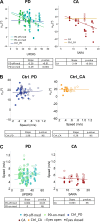
Relationship between disease severity, speed, and CVP orientation. Scatter plots and linear regression analysis of 1) 1st row: CVP orientation (u3t) vs. clinical score of disease severity (UPDRS part III for PD and SARA for CA), 2) 2nd row: CVP orientation (u3t) vs. gait speed for control groups only and 3) 3rd row gait speed vs. disease severity for patient groups only. One regression is performed per subject group on the pooled data from all conditions: inside, straight ahead and outside in separate subplots and eyes open and eyes closed overlaid. The inserted table shows the slope of the regression and the P-value. CA, cerebellar ataxia; Ctrl_CA, control subjects matched for CA; Ctrl_PD, control subjects matched for Parkinson's disease; CVP, covariation plane; PD, Parkinson's disease; PD-off-med, Parkinson’s disease in off-medication state; PD-on-med, Parkinson’s disease in on-medication state; SARA, Scale for the Assessment and Rating of Ataxia; UPDRS, Unified PD Rating Scale.
Fig. 8.
Fig. 8.
Correlation between gait speed and CVP orientation. At low speeds there is minimal or no correlation between gait speed and CVP orientation. We show here our data (unfilled circles, with color code according to subject group as shown in the key) superimposed on an adapted figure from Bianchi et al. (1998b). Over the whole range of gait speeds in the Bianchi data set (filled black circles) there is a negative correlation between gait speed and u3t (blue regression line). At lower speeds, however, energy expended is independent of plane orientation in both data sets. Note that the units of the y-axis scale are radians, 0.5 radians is ~29°. CA, cerebellar ataxia; Ctrl_CA, control subjects matched for CA; Ctrl_PD, control subjects matched for Parkinson's disease; CVP, covariation plane; PDOFF, Parkinson’s disease in off-medication state; PDON, Parkinson’s disease in on-medication state.

Similar articles

Cited by

References

    1. Amano S, Kegelmeyer D, Hong SL. Rethinking energy in parkinsonian motor symptoms: a potential role for neural metabolic deficits. Front Syst Neurosci 8: 242, 2015. doi:10.3389/fnsys.2014.00242. - DOI - PMC - PubMed
    1. Appel-Cresswell S, de la Fuente-Fernandez R, Galley S, McKeown MJ. Imaging of compensatory mechanisms in Parkinson’s disease. Curr Opin Neurol 23: 407–412, 2010. doi:10.1097/WCO.0b013e32833b6019. - DOI - PubMed
    1. Barliya A, Omlor L, Giese MA, Berthoz A, Flash T. Expression of emotion in the kinematics of locomotion. Exp Brain Res 225: 159–176, 2013. doi:10.1007/s00221-012-3357-4. - DOI - PubMed
    1. Barliya A, Omlor L, Giese MA, Flash T. An analytical formulation of the law of intersegmental coordination during human locomotion. Exp Brain Res 193: 371–385, 2009. doi:10.1007/s00221-008-1633-0. - DOI - PubMed
    1. Bastian AJ, Martin TA, Keating JG, Thach WT. Cerebellar ataxia: abnormal control of interaction torques across multiple joints. J Neurophysiol 76: 492–509, 1996. doi:10.1152/jn.1996.76.1.492. - DOI - PubMed

Publication types