

High-Resolution Chest Computed Tomography Imaging of the Lungs: Impact of 1024 Matrix Reconstruction and Photon-Counting Detector Computed Tomography
- PMID: 30461437
- PMCID: PMC6363870
- DOI: 10.1097/RLI.0000000000000524
High-Resolution Chest Computed Tomography Imaging of the Lungs: Impact of 1024 Matrix Reconstruction and Photon-Counting Detector Computed Tomography
Abstract
Objectives: The aim of this study was to evaluate if a high-resolution photon-counting detector computed tomography (PCD-CT) system with a 1024×1024 matrix reconstruction can improve the visualization of fine structures in the lungs compared with conventional high-resolution CT (HRCT).
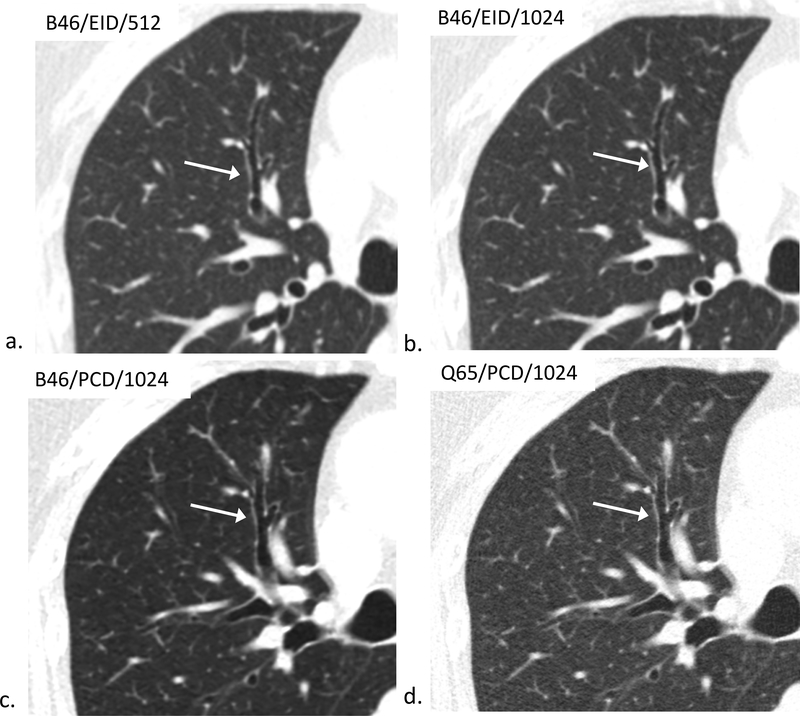
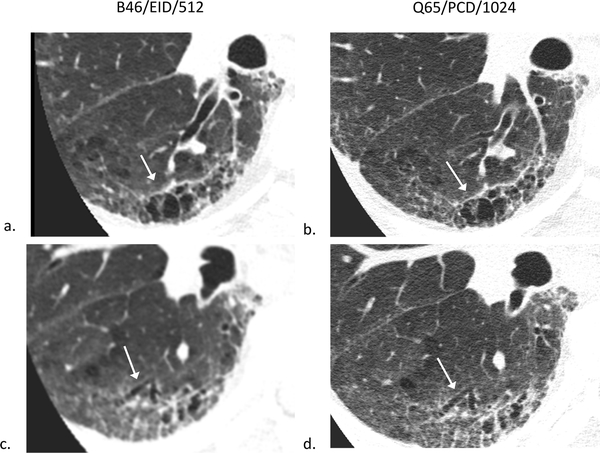
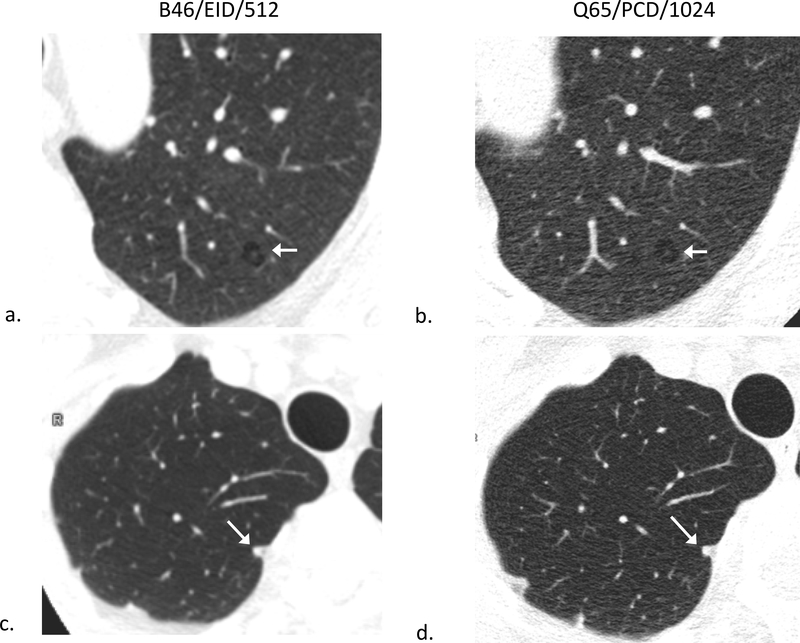
Materials and methods: Twenty-two adult patients referred for clinical chest HRCT (mean CTDI vol, 13.58 mGy) underwent additional dose-matched PCD-CT (mean volume CT dose index, 13.37 mGy) after written informed consent. Computed tomography images were reconstructed at a slice thickness of 1.5 mm and an image increment of 1 mm with our routine HRCT reconstruction kernels (B46 and Bv49) at 512 and 1024 matrix sizes for conventional energy-integrating detector (EID) CT scans. For PCD-CT, routine B46 kernel and an additional sharp kernel (Q65, unavailable for EID) images were reconstructed at 1024 matrix size. Two thoracic radiologists compared images from EID and PCD-CT noting the highest level bronchus clearly identified in each lobe of the right lung, and rating bronchial wall conspicuity of third- and fourth-order bronchi. Lung nodules were also compared with the B46/EID/512 images using a 5-point Likert scale. Statistical analysis was performed using a Wilcoxon signed rank test with a P < 0.05 considered significant.
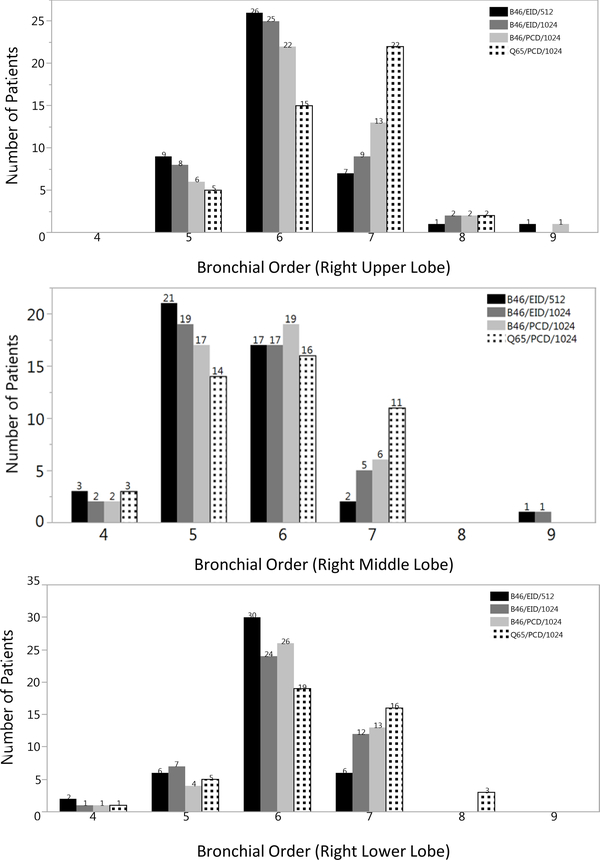
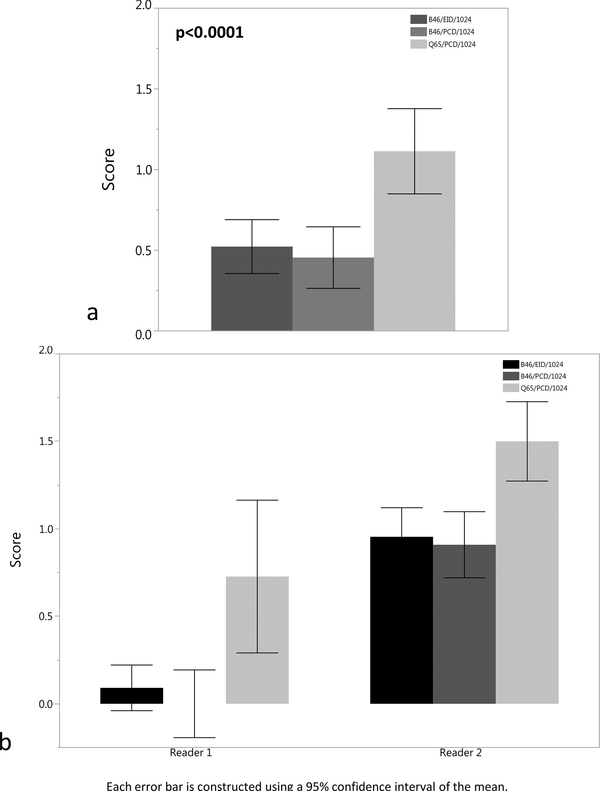
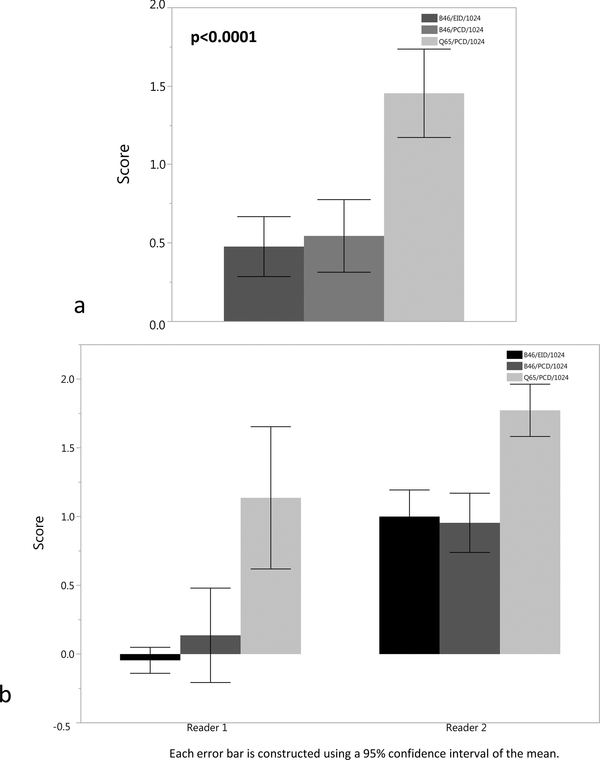
Results: Compared with B46/EID/512, readers detected higher-order bronchi using B46/PCD/1024 and Q65/PCD/1024 images for every lung lobe (P < 0.0015), but in only the right middle lobe for B46/EID/1024 (P = 0.007). Readers were able to better identify bronchial walls of the third- and fourth-order bronchi better using the Q65/PCD/1024 images (mean Likert scores of 1.1 and 1.5), which was significantly higher compared with B46/EID/1024 or B46/PCD/1024 images (mean difference, 0.8; P < 0.0001). The Q65/PCD/1024 images had a mean nodule score of 1 ± 1.3 for reader 1, and -0.1 (0.9) for reader 2, with one reader having improved nodule evaluation scores for both PCD kernels (P < 0.001), and the other reader not identifying any increased advantage over B46/EID/1024 (P = 1.0).
Conclusions: High-resolution lung PCD-CT with 1024 image matrix reconstruction increased radiologists' ability to visualize higher-order bronchi and bronchial walls without compromising nodule evaluation compared with current chest CT, creating an opportunity for radiologists to better evaluate airway pathology.
Figures
References
-
- Walsh SL, Hansell DM. High-resolution CT of interstitial lung disease: a continuous evolution. Semin Respir Crit Care Med. 2014;35(1):129–44. - PubMed
-
- Criado E, Sanchez M, Ramirez J, et al. Pulmonary sarcoidosis: typical and atypical manifestations at high-resolution CT with pathologic correlation. Radiographics. 2010;30(6):1567–86. - PubMed
-
- Gamsu G, Salmon CJ, Warnock ML, Blanc PD. CT quantification of interstitial fibrosis in patients with asbestosis: a comparison of two methods. AJR Am J Roentgenol. 1995;164(1):63–8. - PubMed
-
- Hackx M, Bankier AA, Gevenois PA. Chronic obstructive pulmonary disease: CT quantification of airways disease. Radiology. 2012;265(1):34–48. - PubMed
