. 2019 Apr 15;28(8):1244-1259.
doi: 10.1093/hmg/ddy405.

Dynamic transcriptomic analysis reveals suppression of PGC1α/ERRα drives perturbed myogenesis in facioscapulohumeral muscular dystrophy

Affiliations

Dynamic transcriptomic analysis reveals suppression of PGC1α/ERRα drives perturbed myogenesis in facioscapulohumeral muscular dystrophy

Christopher R S Banerji et al. Hum Mol Genet. .

Abstract

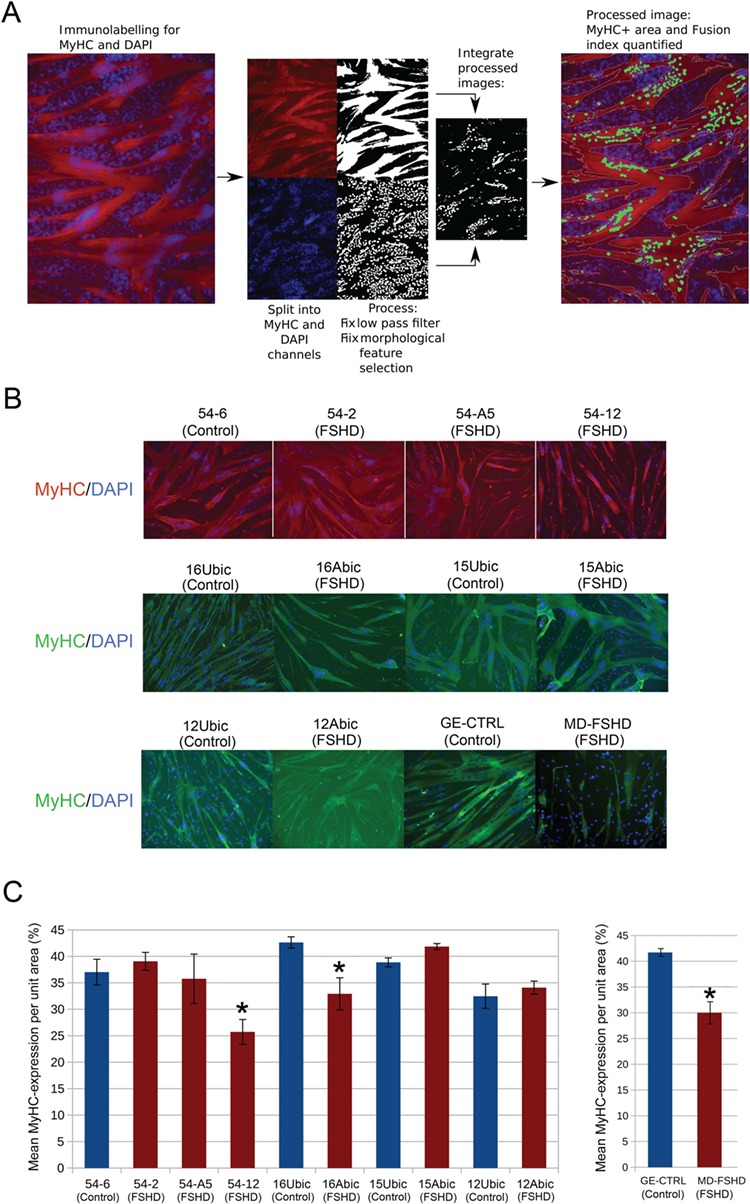
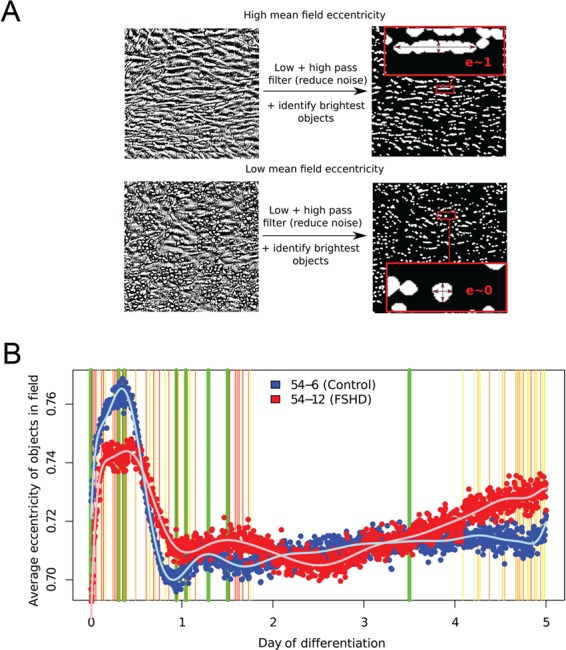
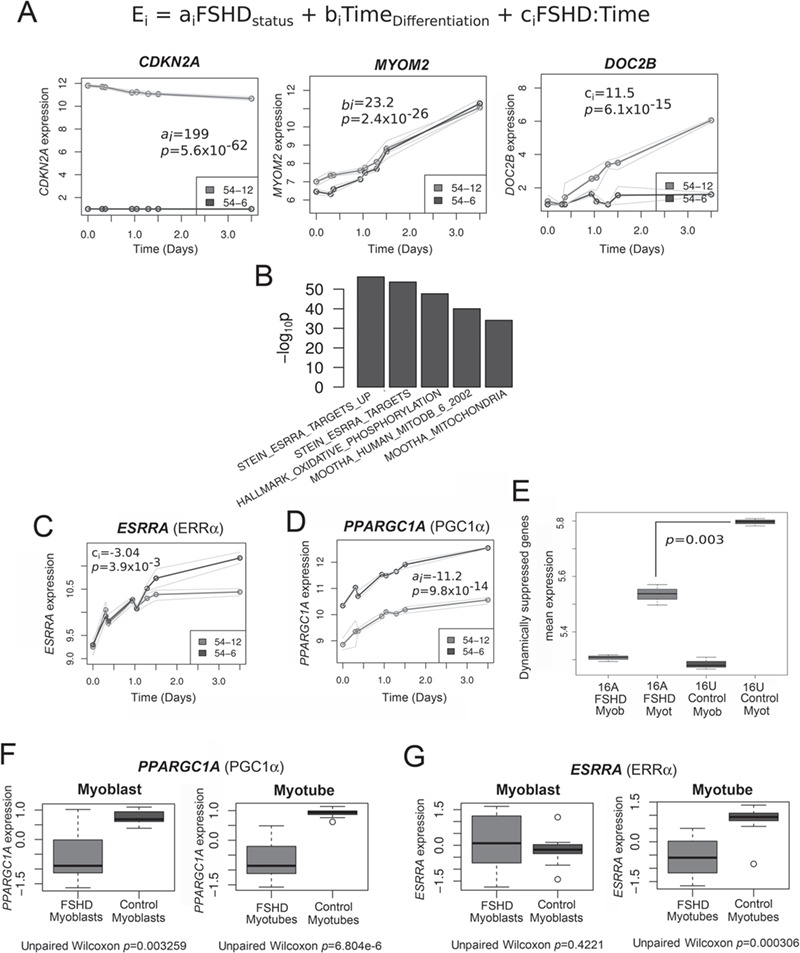
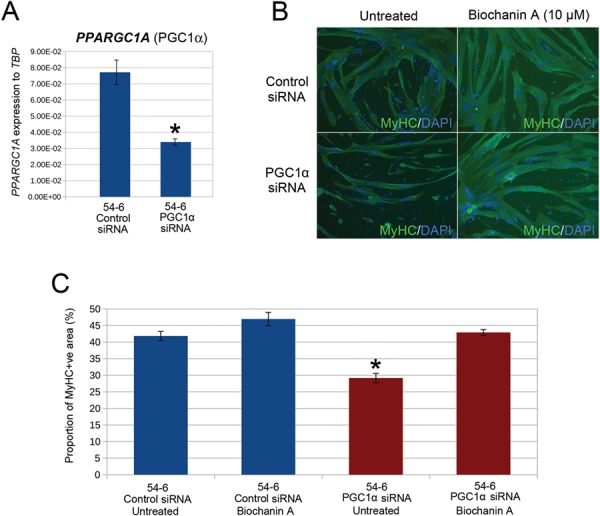
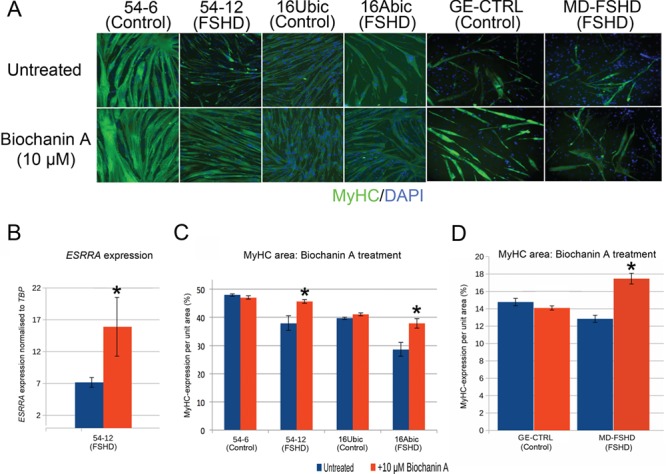
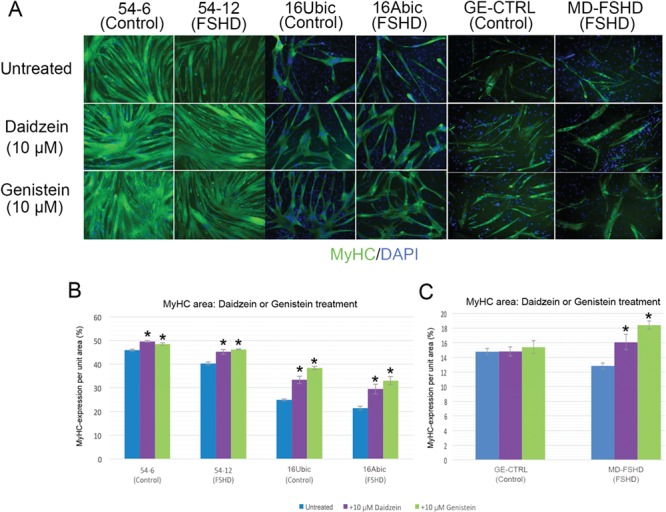
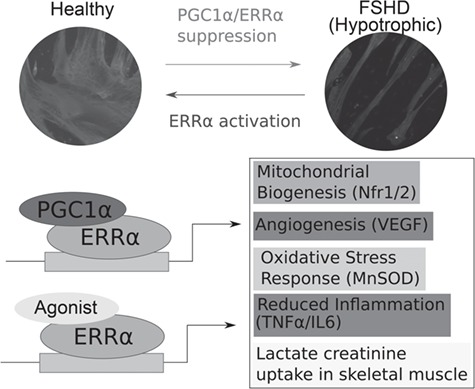
Facioscapulohumeral muscular dystrophy (FSHD) is a prevalent, incurable myopathy, linked to epigenetic derepression of D4Z4 repeats on chromosome 4q, leading to ectopic DUX4 expression. FSHD patient myoblasts have defective myogenic differentiation, forming smaller myotubes with reduced myosin content. However, molecular mechanisms driving such disrupted myogenesis in FSHD are poorly understood. We performed high-throughput morphological analysis describing FSHD and control myogenesis, revealing altered myogenic differentiation results in hypotrophic myotubes. Employing polynomial models and an empirical Bayes approach, we established eight critical time points during which human healthy and FSHD myogenesis differ. RNA-sequencing at these eight nodal time points in triplicate, provided temporal depth for a multivariate regression analysis, allowing assessment of interaction between progression of differentiation and FSHD disease status. Importantly, the unique size and structure of our data permitted identification of many novel FSHD pathomechanisms undetectable by previous approaches. For further analysis here, we selected pathways that control mitochondria: of interest considering known alterations in mitochondrial structure and function in FSHD muscle, and sensitivity of FSHD cells to oxidative stress. Notably, we identified suppression of mitochondrial biogenesis, in particular via peroxisome proliferator-activated receptor gamma coactivator 1-α (PGC1α), the cofactor and activator of oestrogen-related receptor α (ERRα). PGC1α knock-down caused hypotrophic myotubes to form from control myoblasts. Known ERRα agonists and safe food supplements biochanin A, daidzein or genistein, each rescued the hypotrophic FSHD myotube phenotype. Together our work describes transcriptomic changes in high resolution that occur during myogenesis in FSHD ex vivo, identifying suppression of the PGC1α-ERRα axis leading to perturbed myogenic differentiation, which can effectively be rescued by readily available food supplements.


Figures

Figure 1
Figure 1
Automated image analysis demonstrates that FSHD 54-12, 16Abic and MD-FSHD cells form smaller myotubes. (A) Schema showing how image analysis software performs an automated image preprocessing of an MyHC immunolabelled image counterstained with DAPI and quantifies the MyHC+ve area. (B) Six FSHD myoblast cell lines (54-2, 54-A5, 54-12, 16Abic, 15Abic and 12Abic) and matched controls (54-6, 16Ubic, 15Ubic and 12Ubic) were plated in triplicate at 25 000 cells per well of a 96 well plate and induced to differentiate for 3 days. Primary FSHD cells MD-FSHD and controls GE-CTRL were similarly analysed. Following culture, myotubes were fixed and immunolabelled for MyHC and counterstained with DAPI to identify nuclei (Magnification: ×100). (C) At least three fields were imaged per well and mean MyHC+ve area was quantified from three wells/line using the automated image analysis software. FSHD 54-12, 16Abic and MD-FSHD demonstrated significantly reduced mean MyHC+ve area relative to matched controls 54-6, 16Ubic and GE-CTRL, respectively. Data is mean ± SEM (n = 3 wells per line), where an asterisk denotes significant difference between the MyHC+ve area in FSHD lines to matched controls (P < 0.05) using an unpaired two-tailed t-test.
Figure 2
Figure 2
High-throughput time course imaging reveals morphological differences between myogenesis in FSHD and control myoblasts. (A) Schema showing how image analysis software processes and quantifies the eccentricity/elongation of cells in a phase contrast image of differentiating myoblasts. (B) FSHD 54-12 and matched control 54-6 myoblasts were plated in triplicate in 96 well plates and induced to differentiate over 5 days. Cells were imaged every 5 min over the differentiation process and the images processed by our software. Mean eccentricities for each cell line are plotted and a polynomial curve of best fit is shown. An empirical Bayes approach was employed to ascertain time points that showed significant differences in eccentricities control 54-6 and FSHD 54-12 cell lines. Thin vertical lines show time points that reached significance at the 5% level, and are coloured yellow to red in order of significance. Thick vertical green lines correspond to time points selected for investigation by RNA-sequencing. After day 3.5 (last vertical green line) myotubes began contracting and detaching from the plates.
Figure 3
Figure 3
Transcriptomic analysis of FSHD myogenesis reveals suppression of PGC1α and ERRα. (A) A multivariate regression model was fit to the time course RNA-seq data describing the control 54-6 and FSHD 54-12 myoblasts during myogenesis. Coefficient ai attains positive values if gene i is up-regulated in FSHD versus controls and negative values if down-regulated. Coefficient bi attains positive values if gene i is up-regulated during myogenic differentiation and negative values if down-regulated. Coefficient ci attains positive values if gene i is up-regulated during differentiation in FSHD and negative values if down-regulated. As an example, time course expression plots are shown for the genes with the highest coefficient values for coefficient ai (CDKN2A), bi (MYOM2) and ci (DOC2B), where thick lines represent mean expression across triplicates and thin lines denote maximum and minimum expression values observed across triplicates. (B) Bar plot displays log10 enrichment P-values for the top 5 enriched gene sets among the 500 genes with the most negative ci coefficient (i.e. those suppressed in FSHD myogenesis). We see clear enrichment for target genes of ERRα and genes involved in mitochondrial processes. (C) Expression of ESRRA (ERRα) in FSHD 54-12 and matched control 54-6 myoblasts from RNA-seq analysis. Significant repression in FSHD myogenesis begins from day 1 of differentiation. Thick lines represent mean expression across triplicates and thin lines denote maximum and minimum expression values observed across triplicates. (D) Expression of PPARGC1A (PGC1α) in FSHD 54-12 and matched control 54-6 myoblasts from RNA-seq analysis. Significant repression in FSHD myoblasts occurs at all time points analysed. Thick lines represent mean expression across triplicates and thin lines denote maximum and minimum expression values observed across triplicates. (E) The 500 genes with the most negative ci coefficient (i.e. those suppressed in FSHD myogenesis) identified in the data set of the FSHD 54-12 and control 54-6 myoblasts were tested on RNA-seq data from FSHD 16Abic and control 16Ubic at time 0, confluent myoblasts (myob) and time 5040 min, mature myotubes (Myot). Box-plots demonstrate that the mean expression of these 500 genes with the most negative ci coefficient was also significantly lower in 16Abic FSHD myotubes versus 16Ubic control myotubes. The box represents the interquartile range (IQR), with the median indicated by a line. Whiskers denote min [1.5*IQR, max (observed value)]; values were tested using an unpaired two-tailed t-test. (F) Expression of PPARGC1A (PGC1α) is suppressed in RNA-seq from FSHD 16Abic, 12Abic, 54-2 and 54-A5 cell lines at both time 0, confluent myoblasts and time 5040 min, mature myotube stage, compared to control 16Ubic, 12Ubic, 54-A10 cell lines. The box represents the IQR, with the median indicated by a line. Whiskers denote min [1.5*IQR, max (observed value)]; values were z-normalised within FSHD-control groups and tested using an unpaired Wilcoxon test. (G) Expression of ESRRA (ERRα) is suppressed only in RNA-seq from FSHD 16Abic, 12Abic, 54-2 and 54-A5 cell lines at the time 5040 min mature myotube stage, compared to control 16Ubic, 12Ubic and 54-A10 cell lines. The box represents the IQR, with the median indicated by a line. Whiskers denote min [1.5*IQR, max (observed value)]; values were z-normalised within FSHD-control groups and tested using an unpaired Wilcoxon test.
Figure 4
Figure 4
siRNA-mediated knock-down of PGC1α is sufficient to cause the hypotrophic FSHD myotube phenotype, which can be rescued by the ERRα agonist biochanin A. (A) RT-qPCR demonstrates that four combined siRNAs against PGC1α successfully suppresses PGC1α (PPARGC1A) in control 54-6 myoblasts. Data expressed as mean ± SEM where an asterisk denotes significant difference (P < 0.05) using an unpaired two-tailed t-test. (B) Control 54-6 myoblasts were transfected with a mixture of four siRNAs against PGC1α or a scrambled siRNA control and induced to differentiate for 3 days. Control 54-6 myoblasts were also transfected with combined siRNAs against PGC1α or a scrambled siRNA control but also exposed to 10 μm biochanin A during 3 days of differentiation. Myotubes were then immunolabelled for MyHC and all nuclei counterstained with DAPI (Magnification: ×100). (C) PGC1α knock-down significantly reduced MyHC+ve area. However, this PGC1α knock-down mediated reduction in MyHC+ve area could be rescued to control levels by administration of 10 μm biochanin A to the differentiation medium. Data expressed as mean ± SEM (n = 3 wells per line) where an asterisk denotes significant difference between the MyHC+ve area in 54-6 control siRNA/untreated versus treated conditions (P < 0.05) using an unpaired two-tailed t-test.
Figure 5
Figure 5
ERRα agonist biochanin A rescues the FSHD hypotrophic myotube phenotype. (A) FSHD 54-12 and 16Abic myoblast lines and primary MD-FSHD alongside matched controls 54-6, 16Ubic and GE-CTRL were induced to differentiate with/without 10 μm biochanin A for 3 days, fixed and immunolabelled for MyHC and nuclei counterstained with DAPI (Magnification: ×100). (B) RT-qPCR demonstrates that 10 μm biochanin A significantly increases expression of ESRRA in FSHD 54-12 myotubes. Data expressed as mean ± SEM (n = 3 wells per line) where an asterisk denotes significant difference (P < 0.05) using an unpaired two-tailed t-test. (C and D) FSHD myoblast lines 54-12 and 16Abic and primary FSHD cells MD-FSHD alongside matched controls 54-6, 16Ubic and GE-CTRL were induced to differentiate with/without 10 μm biochanin A for 3 days, fixed, immunolabelled for MyHC and MyHC+ve area quantified. All three FSHD cell lines demonstrated increased MyHC+ve area with biochanin A, whilst control myotubes were unaffected. Data expressed as mean ± SEM (n = 3–5 wells per line), where an asterisk denotes significant difference between the MyHC+ve area in untreated versus biochanin A treated myotubes (P < 0.05) using an unpaired two-tailed t-test.
Figure 6
Figure 6
ERRα agonists daidzein or genistein rescue the FSHD hypotrophic myotube phenotype. (A) FSHD myoblast lines 54-12 and 16Abic and primary FSHD cells MD-FSHD alongside matched controls 54-6, 16Ubic and GE-CTRL were induced to differentiate with/without 10 μm daidzein or 10 μm genistein for 3 days, myotubes were then fixed, immunolabelled for MyHC and nuclei counterstained with DAPI (Magnification: ×100). (BC) Quantifying MyHC+ve area showed that daidzein or genistein increased MyHC+ area in myotubes of all FSHD cell lines, as well as in myotubes of the control 54-6 and 16Ubic lines, but not in primary control myotubes. Data expressed as mean ± SEM (n = 3 wells per line) where an asterisk denotes significant difference from untreated (P < 0.05) using an unpaired two-tailed t-test.
Figure 7
Figure 7
Suppression of PGC1α/ERRα expression in FSHD and rescue by ERRα agonists. Schematic summarising that PGC1α/ERRα suppression in FSHD drives an FSHD hypotrophic phenotype that can be rescued by ERRα agonists biochanin A, daidzein or genistein. Suppression of the ERRα/PGC1α pathway in FSHD patients could also contribute to know features of FSHD pathology including oxidative stress sensitivity, aberrant vasculature and inflammation.

References

    1. Deenen J.C.W., Arnts H., Maarel S.M., Padberg G.W., Verschuuren J.J.G.M., Bakker E., Weinreich S.S., Verbeek A.L.M. and Engelen B.G.M. (2014) Population-based incidence and prevalence of facioscapulohumeral dystrophy. Neurology, 83, 1056–1059. - PMC - PubMed
    1. Orrell R.W. (2011) Facioscapulohumeral dystrophy and scapuloperoneal syndromes. Handb Clin Neurol., 101, 167–180. - PubMed
    1. Tawil R., Maarel S.M. and Tapscott S.J. (2014) Facioscapulohumeral dystrophy: the path to consensus on pathophysiology. Skelet. Muscle, 4, 12. - PMC - PubMed
    1. Osborne R.J., Welle S., Venance S.L., Thornton C.A. and Tawil R. (2007) Expression profile of FSHD supports a link between retinal vasculopathy and muscular dystrophy. Neurology, 68, 569–577. - PubMed
    1. Fitzsimons R.B. (2011) Retinal vascular disease and the pathogenesis of facioscapulohumeral muscular dystrophy. A signalling message from Wnt? Neuromuscul. Disord., 21, 263–271. - PubMed

Publication types

MeSH terms

Substances