. 2019 Feb;18(1):e12848.
doi: 10.1111/acel.12848. Epub 2018 Nov 21.

The bystander effect contributes to the accumulation of senescent cells in vivo

Affiliations

The bystander effect contributes to the accumulation of senescent cells in vivo

Paulo F L da Silva et al. Aging Cell. 2019 Feb.

Abstract

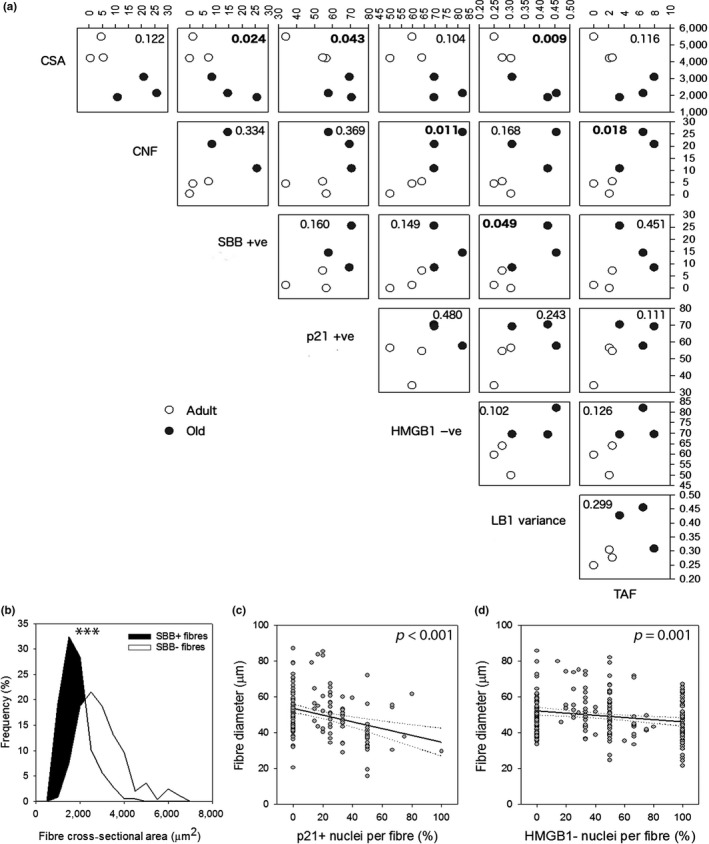
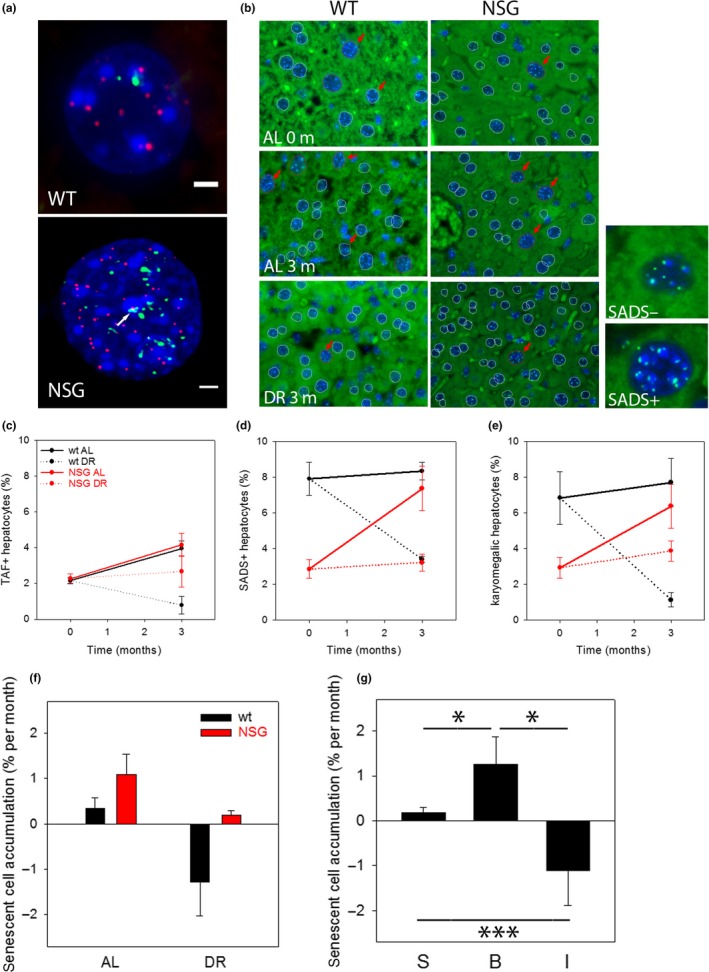
Senescent cells accumulate with age in multiple tissues and may cause age-associated disease and functional decline. In vitro, senescent cells induce senescence in bystander cells. To see how important this bystander effect may be for accumulation of senescent cells in vivo, we xenotransplanted senescent cells into skeletal muscle and skin of immunocompromised NSG mice. 3 weeks after the last transplantation, mouse dermal fibroblasts and myofibres displayed multiple senescence markers in the vicinity of transplanted senescent cells, but not where non-senescent or no cells were injected. Adjacent to injected senescent cells, the magnitude of the bystander effect was similar to the increase in senescence markers in myofibres between 8 and 32 months of age. The age-associated increase of senescence markers in muscle correlated with fibre thinning, a widely used marker of muscle aging and sarcopenia. Senescent cell transplantation resulted in borderline induction of centrally nucleated fibres and no significant thinning, suggesting that myofibre aging might be a delayed consequence of senescence-like signalling. To assess the relative importance of the bystander effect versus cell-autonomous senescence, we compared senescent hepatocyte frequencies in livers of wild-type and NSG mice under ad libitum and dietary restricted feeding. This enabled us to approximate cell-autonomous and bystander-driven senescent cell accumulation as well as the impact of immunosurveillance separately. The results suggest a significant impact of the bystander effect for accumulation of senescent hepatocytes in liver and indicate that senostatic interventions like dietary restriction may act as senolytics in immunocompetent animals.

Keywords: aging; bystander; muscle; senescence; skin.


Figures

Figure 1
Figure 1
A senescent phenotype in aged myofibres. (a) Representative images of H&E‐stained cryosections of gastrocnemius muscle from C57Bl6 mice at 8 (left) and 32 (right) months of age. Scale bar 50 μm. Arrows indicate centrally nucleated fibres (CNF). (b) Frequency distributions of myofibre cross‐sectional areas in adult and old mice. Averages are different with p < 0.001 (Mann–Whitney U test). (c) Representative p21 immunofluorescence images. Red: p21, blue: DAPI, green autofluorescence. Arrows indicate examples of positive nuclei. Bar equals 15 μm. (d) Frequencies of p21‐positive nuclei in adult and old muscles. (e) Immuno‐FISH staining for telomeres (red) and γH2AX (green). Signal co‐localization (TAF) is marked by an arrow. Scale bar 2 μm. (f) Frequencies of TAF‐positive nuclei. (g) lamin B1 immunofluorescence. Red: lamin B1, blue: DAPI. Bar equals 20 μm. (h) Normalized pixel‐to‐pixel variation of laminar LB1 fluorescence intensity. (i) HMGB1 immunofluorescence (red). Blue: DAPI. Arrows indicate examples of HMBG1‐negative nuclei. Scale bar 20 μm. (j) Frequencies of HMGB1‐positive nuclei. (k) SBB plus Nuclear Fast Red‐stained cryosections. SBB‐positive fibres appear dark (examples indicated by arrows). Scale bar 50 μm. (l) Frequencies of SBB‐positive fibres. All data are mean ± SD, three animals/group. *p < 0.05
Figure 2
Figure 2
Nuclear and cytoplasmic markers of myofibre senescence are associated with fibre thinning. (a) Inter‐individual Pearson product moment correlations between muscle aging markers (cross‐sectional area CSA, frequency of centrally nucleated fibres CNF) and senescence markers (SBB + fibres, p21 + nuclei, HMGB1‐ nuclei, LB1 variance over nuclear lamina and TAF+ nuclei). p values are shown (p values below 0.05 in bold). Open circles: adult; filled circles: old animals. (b) Frequency distributions of cross‐sectional area of SBB‐positive and SBB‐negative myofibres in old muscles. p < 0.001 for difference between means (Mann–Whitney U test). (c) and (d) Correlations between frequencies of p21+ nuclei (c) or HMGB1‐ nuclei (d) per fibre cross‐section and minimum Feret diameter of the fibre. Regression line and 95% confidence interval (dotted) are shown, and p values for the correlations are indicated
Figure 3
Figure 3
A xenotransplant model to study effects of senescent cells in vivo. (a) 7.5 × 104 luciferase‐expressing senescent human fibroblasts were transplanted sc and im into one flank of NSG mice (aged 5 months) and were visualized after 24 hr (left) or 14 days (right) by chemoluminescence. (b) Chemoluminescence intensity from xenotransplanted senescent and young cells at sc and im sites at the indicated times after transplantation. Data are mean ± SE from five animals. (c) Representative fluorescence tilescan from a skin cryosection showing two depots of EGFP‐positive xenotransplanted senescent cells between dermis and subcutaneous tissue 3 weeks postinjection (boxed areas). Bar equals 100 μm. (d) Box 2 from c at higher magnification. Bar equals 30 μm. (e) Fluorescence tilescan from gastrocnemius muscle showing a single depot of EGFP‐positive xenotransplanted senescent cells (boxed area) 3 weeks postinjection. Bar equals 100 μm. (f) Boxed area from e at higher magnification. Bar equals 40 μm
Figure 4
Figure 4
Transplanted senescent cells induce senescence in adjacent myofibres in vivo. (a) Representative p21 immunofluorescence images of muscles transplanted as indicated. Xenotransplanted fibroblasts appear yellow being both GFP (green)‐positive and p21(red)‐positive (arrows). Blue: DAPI. Scale bar 100 μm, except non‐inj: 30 μm. (b) Frequencies of p21‐positive nuclei. Xenotransplanted senescent cells (black bar), myocyte nuclei next to transplanted senescent cells (less than 100 μm away, dark grey) and more than 100 μm away (light grey) as well as myocyte nuclei close to proliferating xenotransplanted cells (P‐INJ, white bar) and from the non‐injected flank (N‐INJ, white bar). (c) Overlay of fluorescence images showing transplanted cells (green, arrow) and nuclei (blue, DAPI) with bright field images showing SBB‐positive myofibres (dark). Scale bar 50 μm. (d) Frequencies of SBB‐positive myofibres in relation to transplanted cells. Labels as in a. (e) TAF staining on myofibre nuclei in the vicinity (or not) to xenotransplanted cells. Red: telomeres, green: γH2AX. Arrow indicates a TAF. Bars equal 2 μm. (f) Frequencies of TAF‐positive myofibre nuclei in relation to xenotransplanted cells. (h) Representative LB1 immunofluorescence (red). Transplanted cells appear yellow (arrows). Blue: DAPI. The circle marks the area closer than 100 μm to the xenotransplanted cells. Insets highlight individual nuclei at higher magnification. Bars 75 μm. (i) Normalized pixel‐to‐pixel variation of laminar LB1 fluorescence intensity in myocyte nuclei in relation to xenotransplanted cells. All data are mean ± SD from five mice in the SEN‐INJ and P‐INJ groups and from two to 10 mice in the N‐INJ group. *p < 0.05 (one‐way ANOVA)
Figure 5
Figure 5
The bystander effect is a major driver of senescent cell accumulation with age in mouse liver. (a) Immuno‐FISH staining for telomeres (red) and γH2AX (green) in hepatocytes from wt and NSG livers. Signal co‐localization (TAF) is marked by an arrow. Scale bar equals 2 μm. (b) SADS and karyomegaly in liver from wt and NSG livers. Red arrows mark SADS‐positive hepatocytes (with four or more decondensation events, examples of SADS+ and SADS− nuclei at higher magnification on the right), outlines mark hepatocyte nuclei (red: karyomegalic, white: non‐karyomegalic). AL; ad libitum fed, DR: dietary restricted for 3 months. (c) Frequencies of TAF‐positive hepatocytes in wt (C57Bl6, black)) and NSG mice (red) at start of the experiment and after 3 months AL or DR feeding. (d) Frequencies of SADS‐positive hepatocytes. (e) Frequencies of hepatocytes showing karyomegaly. Data in (c) – (e) are mean ± SE from five mice per group. Differences between AL and DR at the end of the experiments are significant (p < 0.05, t test) for all markers except TAF in NSG. (f) Net senescent hepatocyte accumulation rates in wt and NSG mice. Data are averages ± SD from the three markers shown in (c) – (e). A two‐way ANOVA shows significant differences between wt and NSG (p = 0.003) and between AL and DR (p = 0.001) with no significant interaction between both factors. (g) Data given in (f) were used to calculate the impact of “spontaneous” senescence (S), the bystander effect (B) and immunosurveillance (I) on senescent hepatocyte accumulation rates. S, B and I are all different from each other (p < 0.05, one‐way ANOVA, Holm–Sidak post hoc test)

References

    1. Acosta, J. C. , Banito, A. , Wuestefeld, T. , Georgilis, A. , Janich, P. , Morton, J. P. , … Gil, J. (2013). A complex secretory program orchestrated by the inflammasome controls paracrine senescence. Nature Cell Biology, 15, 978–990. 10.1038/ncb2784 - DOI - PMC - PubMed
    1. Aravinthan, A. D. , & Alexander, G. J. M. (2016). Senescence in chronic liver disease: Is the future in aging? Journal of Hepatology, 65, 825–834. 10.1016/j.jhep.2016.05.030 - DOI - PubMed
    1. Baar M. P., Brandt R. M., Putavet D. A., Klein J. D., Derks K. W., Bourgeois B. R., … De Keizer P. L. (2017) Targeted apoptosis of senescent cells restores tissue homeostasis in response to chemotoxicity and aging. Cell, 169, 132–147. e116. 10.1016/j.cell.2017.02.031 - DOI - PMC - PubMed
    1. Baker, D. J. , Childs, B. G. , Durik, M. , Wijers, M. E. , Sieben, C. J. , Zhong, J. , … van Deursen, J. M. (2016). Naturally occurring p16(Ink4a)‐positive cells shorten healthy lifespan. Nature, 530, 184–189. 10.1038/nature16932 - DOI - PMC - PubMed
    1. Baker, D. J. , Wijshake, T. , Tchkonia, T. , LeBrasseur, N. K. , Childs, B. G. , van de Sluis, B. , … van Deursen, J. M. (2011). Clearance of p16Ink4a‐positive senescent cells delays ageing‐associated disorders. Nature, 479, 232–236. 10.1038/nature10600 - DOI - PMC - PubMed

Publication types

LinkOut - more resources