

Abortion Surveillance - United States, 2014
- PMID: 30462631
- PMCID: PMC6290801
- DOI: 10.15585/mmwr.ss6625a1
Abortion Surveillance - United States, 2014
Abstract
Problem/condition: Since 1969, CDC has conducted abortion surveillance to document the number and characteristics of women obtaining legal induced abortions in the United States.
Period covered: 2014.
Description of system: Each year, CDC requests abortion data from the central health agencies of 52 reporting areas (the 50 states, the District of Columbia, and New York City). The reporting areas provide this information voluntarily. For 2014, data were received from 49 reporting areas. For trend analysis, abortion data were evaluated from 48 areas that reported data every year during 2005-2014. Census and natality data, respectively, were used to calculate abortion rates (number of abortions per 1,000 women aged 15-44 years) and ratios (number of abortions per 1,000 live births).
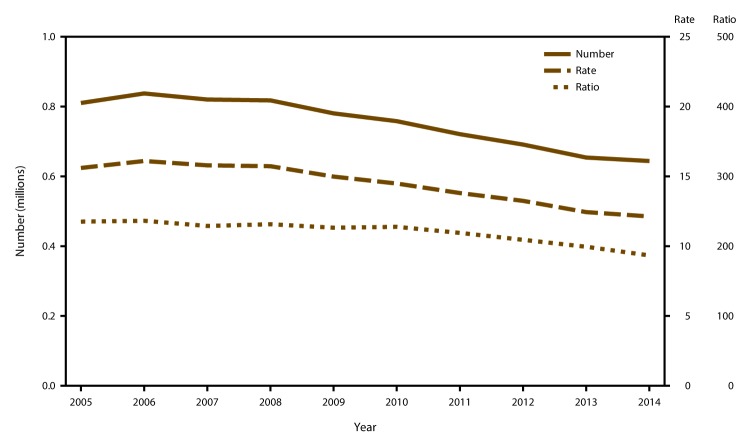
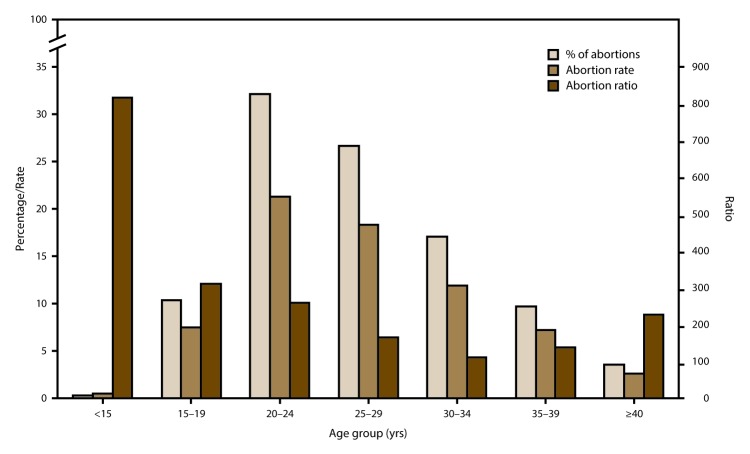
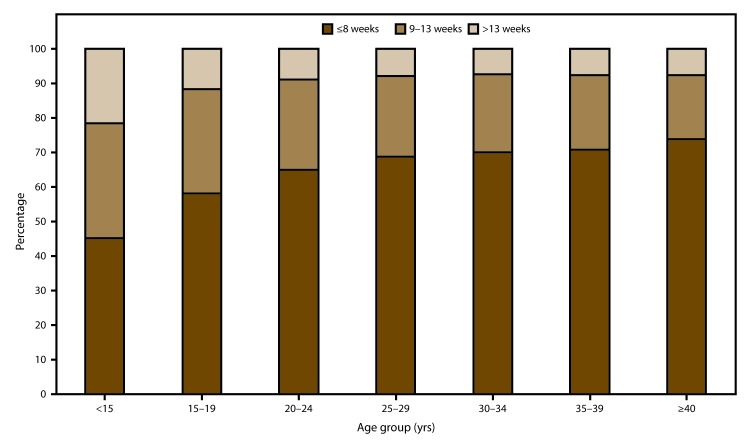
Results: A total of 652,639 abortions were reported to CDC for 2014. Of these abortions, 98.4% were from the 48 reporting areas that provided data every year during 2005-2014. Among these 48 reporting areas, the abortion rate for 2014 was 12.1 abortions per 1,000 women aged 15-44 years, and the abortion ratio was 193 abortions per 1,000 live births. From 2013 to 2014, the total number and rate of reported abortions decreased 2%, and the ratio decreased 3%. From 2005 to 2014, the total number, rate, and ratio of reported abortions decreased 21%, 22%, and 18%, respectively. In 2014, all three measures reached their lowest level for the entire period of analysis (2005-2014). In 2014 and throughout the period of analysis, women in their 20s accounted for the majority of abortions and had the highest abortion rates; women in their 30s and older accounted for a much smaller percentage of abortions and had lower abortion rates. In 2014, women aged 20-24 and 25-29 years accounted for 32.2% and 26.7% of all reported abortions, respectively, and had abortion rates of 21.3 and 18.4 abortions per 1,000 women aged 20-24 and 25-29 years, respectively. In contrast, women aged 30-34, 35-39, and ≥40 years accounted for 17.1%, 9.7%, and 3.6% of all reported abortions, respectively, and had abortion rates of 11.9, 7.2, and 2.6 abortions per 1,000 women aged 30-34 years, 35-39 years, and ≥40 years, respectively. From 2005 to 2014, the abortion rate decreased among women aged 20-24, 25-29, 30-34, and 35-39 years by 27%, 16%, 12%, and 5%, respectively, but increased 4% among women aged ≥40 years. In 2014, adolescents aged <15 and 15-19 years accounted for 0.3% and 10.4% of all reported abortions, respectively, and had abortion rates of 0.5 and 7.5 abortions per 1,000 adolescents aged <15 and 15-19 years, respectively. From 2005 to 2014, the percentage of abortions accounted for by adolescents aged 15-19 years decreased 38%, and their abortion rate decreased 49%. These decreases were greater than the decreases for women in any older age group. In contrast to the percentage distribution of abortions and abortion rates by age, abortion ratios in 2014 and throughout the entire period of analysis were highest among adolescents and lowest among women aged 30-39 years. Abortion ratios decreased from 2005 to 2014 for women in all age groups. In 2014, the majority (64.9%) of abortions were performed at ≤8 weeks' gestation, and nearly all (91.0%) were performed at ≤13 weeks' gestation. Few abortions were performed between 14 and 20 weeks' gestation (7.7%) or at ≥21 weeks' gestation (1.3%). During 2005-2014, the percentage of all abortions performed at ≤13 weeks' gestation remained consistently high (≥90.9%). Among abortions performed at ≤13 weeks' gestation, there was a shift toward earlier gestational ages, as the percentage performed at ≤6 weeks' gestation increased 9%, and the percentage of all other gestational ages at ≤13 weeks' gestation decreased 0%-12%. In 2014, among reporting areas that included medical (nonsurgical) abortion on their reporting form, 22.5% of all abortions were performed by early medical abortion (a nonsurgical abortion at ≤8 weeks' gestation), 66.9% were performed by surgical abortion at ≤13 weeks' gestation, and 9.1% were performed by surgical abortion at >13 weeks' gestation; all other methods were uncommon (<1.5%). Among abortions performed at ≤8 weeks' gestation that were eligible for early medical abortion on the basis of gestational age, 33.3% were completed by this method. In 2014, women with one or more previous live births accounted for 59.5% of abortions, and women with no previous live births accounted for 40.4%. Women with one or more previous induced abortions accounted for 44.9% of abortions, and women with no previous abortion accounted for 55.1%. Women with three or more previous births accounted for 13.8% of abortions, and women with three or more previous abortions accounted for 8.6% of abortions. Deaths of women associated with complications from abortion for 2014 are being assessed as part of CDC's Pregnancy Mortality Surveillance System. In 2013, the most recent year for which data were available, four women were identified to have died as a result of complications from legal induced abortion.
Interpretation: Among the 48 areas that reported data every year during 2005-2014, the decreases in the total number, rate, and ratio of reported abortions that occurred during 2010-2013 continued from 2013 to 2014, resulting in historic lows for all three measures of abortion.
Public health action: The data in this report can help program planners and policymakers identify groups of women with the highest rates of abortion. Unintended pregnancy is the major contributor to induced abortion. Increasing access to and use of effective contraception can reduce unintended pregnancies and further reduce the number of abortions performed in the United States.
Figures
Comment in
-
In Favor of Discussion on the Amendment of the "Abortion Prohibition Law" in Korea.J Korean Med Sci. 2019 May 20;34(19):e148. doi: 10.3346/jkms.2019.34.e148. J Korean Med Sci. 2019. PMID: 31099197 Free PMC article. No abstract available.
References
-
- Smith JC. Abortion surveillance report, hospital abortions, annual summary 1969. Atlanta, GA: US Department of Health, Education, and Welfare, Public Health Service, Health Services and Mental Health Administration, National Communicable Disease Center; 1970.
-
- Gamble SB, Strauss LT, Parker WY, Cook DA, Zane SB, Hamdan S. Abortion surveillance—United States, 2005. MMWR Surveill Summ 2008;57(No. SS-13). - PubMed
-
- Henshaw SK, Kost K. Trends in the characteristics of women obtaining abortions, 1974 to 2004. New York, NY: Guttmacher Institute; 2008. https://www.guttmacher.org/pubs/2008/09/23/TrendsWomenAbortions-wTables.pdf
-
- Pazol K, Gamble SB, Parker WY, Cook DA, Zane SB, Hamdan S; CDC. Abortion surveillance—United States, 2006. MMWR Surveill Summ 2009;58(No. SS-8). - PubMed
MeSH terms
LinkOut - more resources
Full Text Sources