. 2018 Nov 21;13(11):e0200432.
doi: 10.1371/journal.pone.0200432. eCollection 2018.

RAMP1 in Kupffer cells is a critical regulator in immune-mediated hepatitis

Affiliations

RAMP1 in Kupffer cells is a critical regulator in immune-mediated hepatitis

Tomoyoshi Inoue et al. PLoS One. .

Abstract

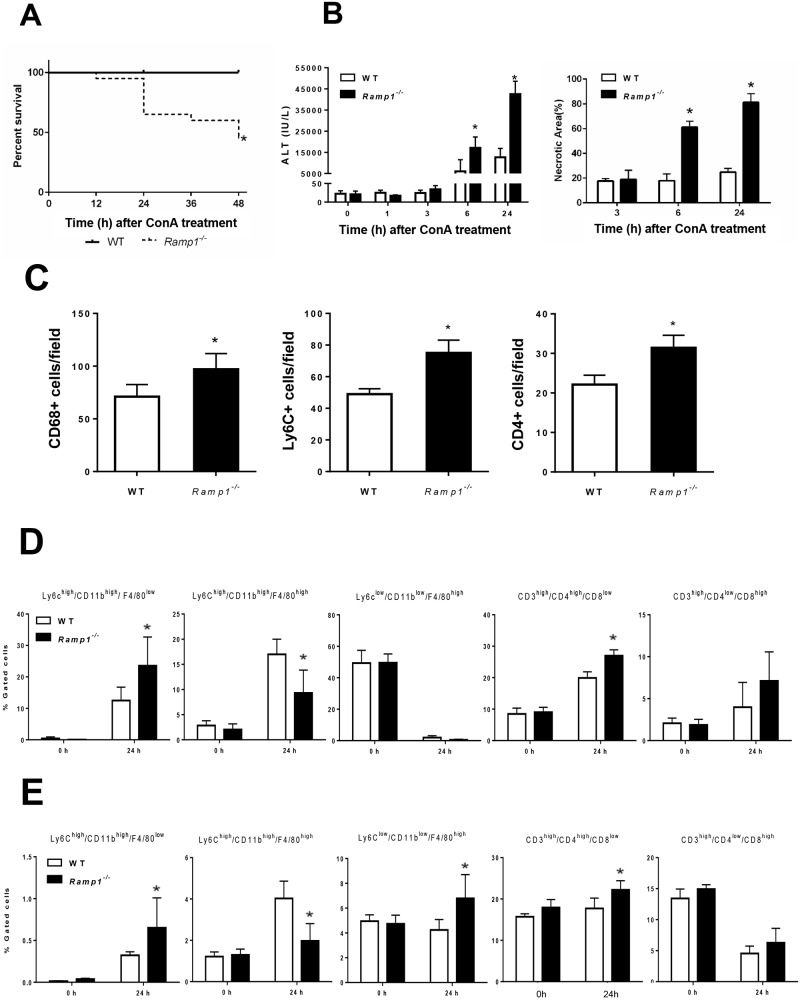
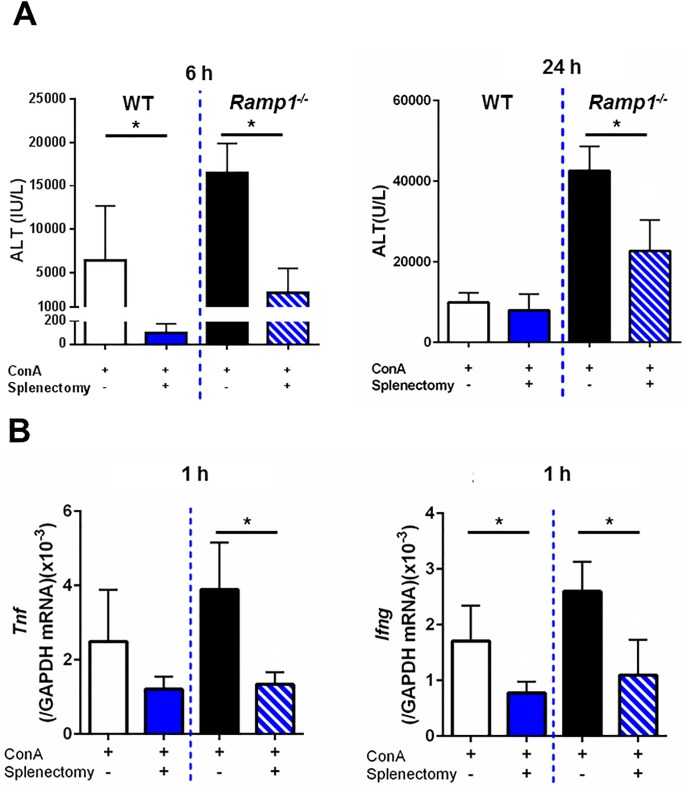
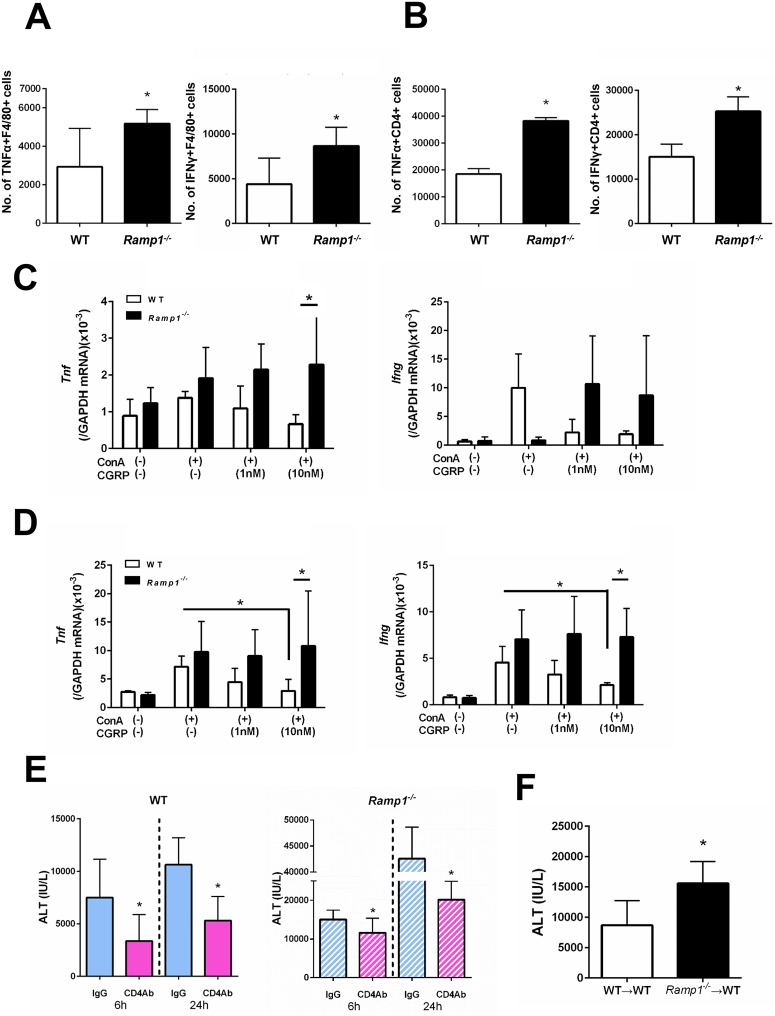
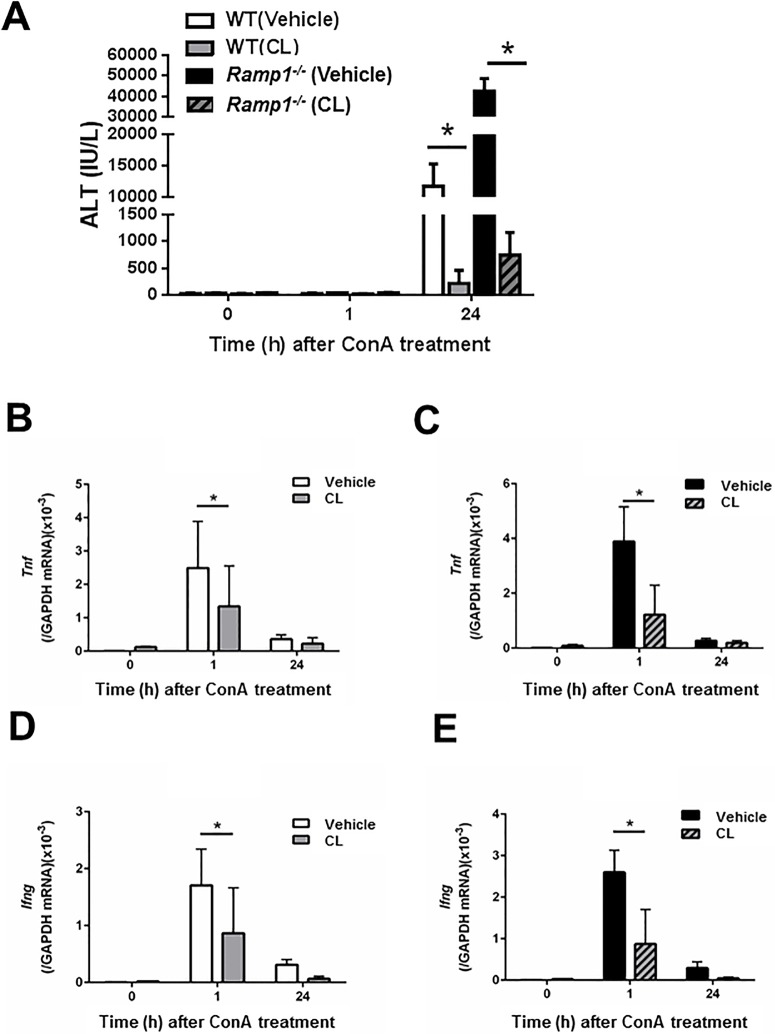
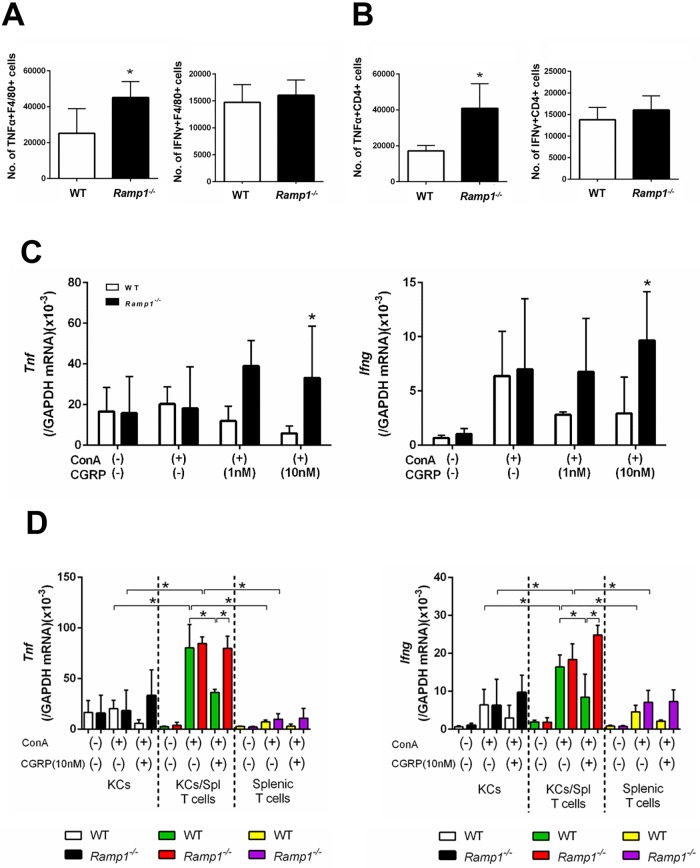
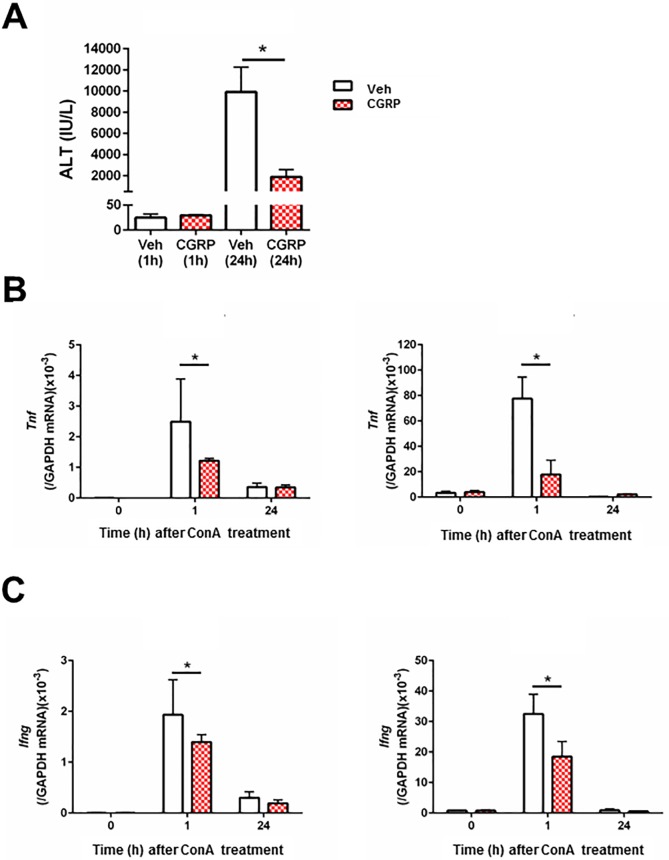
The significance of the relationship between the nervous and immune systems with respect to disease course is increasingly apparent. Immune cells in the liver and spleen are responsible for the development of acute liver injury, yet the regulatory mechanisms of the interactions remain elusive. Calcitonin gene-related peptide (CGRP), which is released from the sensory nervous system, regulates innate immune activation via receptor activity-modifying protein 1 (RAMP1), a subunit of the CGRP receptor. Here, we show that RAMP1 in Kupffer cells (KCs) plays a critical role in the etiology of immune-mediated hepatitis. RAMP1-deficient mice with concanavalin A (ConA)-mediated hepatitis, characterized by severe liver injury accompanied by infiltration of immune cells and increased secretion of pro-inflammatory cytokines by KCs and splenic T cells, showed poor survival. Removing KCs ameliorated liver damage, while depleting T cells or splenectomy led to partial amelioration. Adoptive transfer of splenic T cells from RAMP1-deficient mice led to a modest increase in liver injury. Co-culture of KCs with splenic T cells led to increased cytokine expression by both cells in a RAMP1-dependent manner. Thus, immune-mediated hepatitis develops via crosstalk between immune cells. RAMP1 in KCs is a key regulator of immune responses.


Conflict of interest statement

The authors have declared that no competing interests exist.

Figures

Fig 1
Fig 1. Deficient RAMP1 signaling exacerbates ConA-induced liver injury via infiltration of inflammatory cells into the liver.
Ramp1-/- and WT mice were administered ConA (20 mg/kg) by intraperitoneal (i.p.) injection. (A) Kaplan-Meier survival curves for Ramp1-/- mice (n = 20) and WT mice (n = 20) at various time points after receiving ConA. Survival data analyzed by log-rank test *p < 0.05 vs. WT mice. (B) Serum levels of ALT and the area of hepatic necrosis (expressed as a percentage) after ConA administration. Data are expressed as the mean ± SD (n = 6 mice per group). *p < 0.05 vs. WT mice. Serum samples at 0, 1, 3, 6, and 24 h after ConA administration were collected, and ALT levels were measured. (C) Numbers of hepatic Ly6C+ cells, CD68+ cells, and CD4+ cells at 24 h after ConA administration. Data are expressed as the mean ± SD of six mice per group. *p < 0.05 vs. WT mice. (D,E) Flow cytometry analysis of the percentage of Ly6Chigh/CD11bhigh/F4/80low cells, Ly6Chigh/CD11bhigh/F4/80high cells Ly6Clow/CD11blow/F4/80high cells, CD3high/CD4high/CD8low cells, and CD3high/CD4low/CD8high cells within the CD45+ cell population in the liver (D) and spleen (E) at 0 and 24 h after ConA treatment. Data are expressed as the mean ± SD of six mice per group. *p < 0.05 vs. WT mice.
Fig 2
Fig 2. Increased expression of pro-inflammatory cytokines in Ramp1-/- mice with ConA hepatitis.
Time course of changes in mRNA levels of Tnf and Ifng in the liver (A) and spleen (B) of WT and Ramp1-/- mice after ConA treatment. Data are expressed as the mean ± SD from six mice per group. *p < 0.05 vs. WT mice.
Fig 3
Fig 3. Effects of splenectomy on ALT and pro-inflammatory cytokines levels in mice with ConA hepatitis.
(A) Splenectomy reduced ALT levels in WT and Ramp1-/- mice at 6 h (left) and 24 h (right) after ConA treatment. ConA was administered immediately after splenectomy. Data are expressed as the mean ± SD from 4–6 mice per group. *p < 0.05. (B) Effect of splenectomy on Tnf and Ifng mRNA levels in liver from WT and Ramp1-/- mice at 1 h after ConA administration. ConA was administered immediately after splenectomy. Data are expressed as the mean ± SD from 4–6 mice per group. *p < 0.05.
Fig 4
Fig 4. RAMP1 signaling regulates expression of pro-inflammatory cytokines by splenic macrophages and T cells.
(A,B) The numbers of TNFα- and IFNγ-expressing cells within splenic F4/80+ cells (A) and splenic CD4+ T cells (B) populations from WT and Ramp1-/- mice at 1 h after ConA treatment. Expression of TNFα and IFNγ was analyzed by flow cytometry. Data are expressed as the mean ± SD from six mice per group. *p < 0.05 vs. WT mice. (C) Amounts of Tnf and Ifng mRNA expressed by splenic F4/80+ cells isolated from WT and Ramp1-/- mice. Isolated splenic macrophages were stimulated with CGRP (1 and 10 nM) with or without ConA for 3 h. Macrophages were isolated by magnetic-activated cell sorting (MACS). Data are expressed as the mean ± SD from 4–5 mice per group. *p < 0.05. (D) Expression of Tnf and Ifng mRNA by splenic CD4+ T cells isolated from WT and Ramp1-/- mice. Isolated splenic CD4+ T cells were stimulated with CGRP with or without ConA for 1 h. CD4+ T cells were isolated by magnetic-activated cell sorting (MACS). Data are expressed as the mean ± SD from 4–5 mice per group. *p < 0.05. (E) Serum ALT levels after deletion of CD4+ T cells from WT and Ramp1-/- mice during ConA hepatitis. Anti-CD4 antibodies or isotype IgG was administered 24 h before ConA treatment. Data are expressed as the mean ± SD from 3–6 mice per group. *p < 0.05 vs. IgG-treated mice. (F) Adoptive transfer of CD4+ T cells from Ramp1-/- mice into WT mice (Ramp1-/-→WT). Data are expressed as the mean ± SD from 3–6 mice per group. *p < 0.05 vs. WT→WT.
Fig 5
Fig 5. Deleting macrophages attenuates ConA-induced liver injury and decreases production of pro-inflammatory cytokines.
(A) ALT levels in WT mice and Ramp1-/- mice treated with clodronate liposomes (CL). Mice were treated with CL or vehicle (PBS) 48 h before ConA administration. Data are expressed as the mean ± SD from 3–6 mice per group. *p < 0.05. (B-E) Amounts of Tnf mRNA in WT mice (B) and Ramp1-/- mice (C) treated with CL, and amounts of Ifng mRNA in WT mice (D) and Ramp1-/- mice (E) treated with CL. Data are expressed as the mean ± SD from 3–6 mice per group. *p < 0.05.
Fig 6
Fig 6. RAMP1 signaling regulates expression of pro-inflammatory cytokines in hepatic macrophages and splenic T cells.
(A,B) The numbers of TNFα- and IFNγ-producing F4/80+ cells (A) and the numbers of TNFα- and IFNγ-producing CD4+ T cells (B) in the liver from WT and Ramp1-/- mice at 1 h after ConA treatment. Expression of TNFα and IFNγ was analyzed by flow cytometry. Data are expressed as the mean ± SD from six mice per group. *p < 0.05 vs. WT mice. (C) Amounts of Tnf and Ifng mRNA in KCs isolated from WT and Ramp1-/- mice. Isolated KCs were stimulated with CGRP (1 and 10 nM) with or without ConA for 3 h. KCs were isolated by magnetic-activated cell sorting (MACS). Data are expressed as the mean ± SD from 4–5 mice per group. *p < 0.05 vs. WT mice. (D) Amounts of Tnf and Ifng mRNA in KCs and/or splenic CD4+ T cells isolated from WT and Ramp1-/- mice. KCs co-cultured with splenic CD4+ T cells were stimulated with CGRP with or without ConA for 1 h. Data are expressed as the mean ± SD from 4–5 mice per group. *p < 0.05.
Fig 7
Fig 7. Effects of CGRP treatment on ALT and pro-inflammatory cytokine levels during ConA hepatitis.
CGRP or vehicle was administered 30 min before ConA treatment. (A) ALT levels in WT mice treated with CGRP at 1 h and 24 h after ConA administration. Veh, vehicle. Data are expressed as the mean ± SD from 4–6 mice per group. *p < 0.05. (B) Amount of Tnf mRNA in the liver and spleen after ConA administration. Data are expressed as the mean ± SD from 4–6 mice per group. *p < 0.05. (C) Amount of Ifng mRNA in liver and spleen after ConA administration. Data are expressed as the mean ± SD from 4–6 mice per group. *p < 0.05.

References

    1. Heymann F, Tacke F. Immunology in the liver—from homeostasis to disease. Nat Rev Gastroenterol Hepatol. 2016. February;13(2):88–110. 10.1038/nrgastro.2015.200 Epub 2016 Jan 13. Review. . - DOI - PubMed
    1. Jensen KJ, Alpini G, Glaser S. Hepatic nervous system and neurobiology of the liver. Compr Physiol. 2013. April;3(2):655–65. 10.1002/cphy.c120018 Review. - DOI - PMC - PubMed
    1. Stoyanova II, Gulubova MV. Immunocytochemical study on the liver innervation in patients with cirrhosis. Acta Histochem. 2000. November;102(4):391–402. 10.1078/0065-1281-00568 . - DOI - PubMed
    1. Jung WC, Levesque JP, Ruitenberg MJ. It takes nerve to fight back: The significance of neural innervation of the bone marrow and spleen for immune function. Semin Cell Dev Biol. 2017. January;61:60–70. 10.1016/j.semcdb.2016.08.010 Epub 2016 Aug 11. Review. . - DOI - PubMed
    1. Poyner DR, Sexton PM, Marshall I, Smith DM, Quirion R, Born W, et al. International Union of Pharmacology. XXXII. The mammalian calcitonin gene-related peptides, adrenomedullin, amylin, and calcitonin receptors. Pharmacol Rev. 2002. June;54(2):233–46. Review. . - PubMed

Publication types

MeSH terms