. 2019 Feb;32(2):e4030.
doi: 10.1002/nbm.4030. Epub 2018 Nov 21.

Mapping tissue water T1 in the liver using the MOLLI T1 method in the presence of fat, iron and B0 inhomogeneity

Affiliations

Mapping tissue water T1 in the liver using the MOLLI T1 method in the presence of fat, iron and B0 inhomogeneity

Ferenc E Mozes et al. NMR Biomed. 2019 Feb.

Abstract

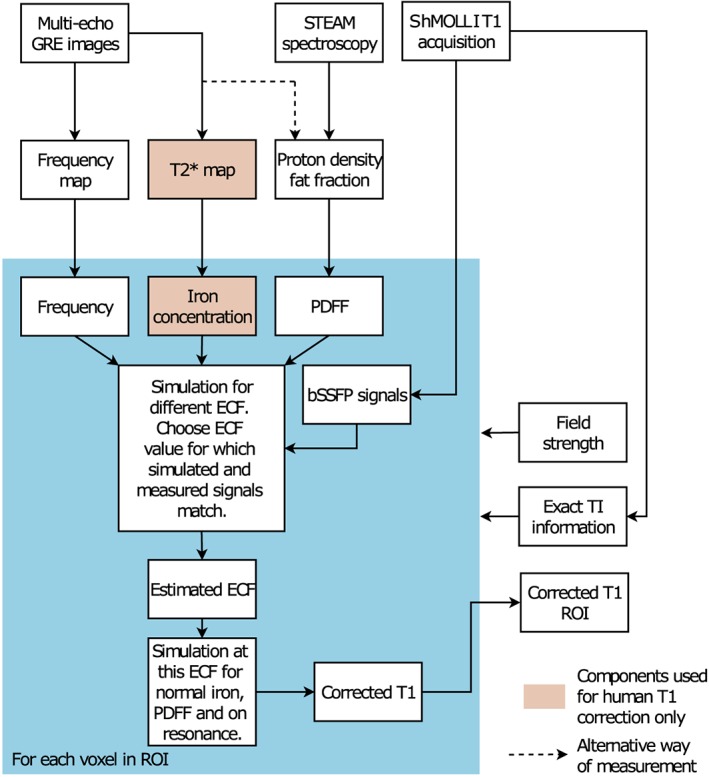
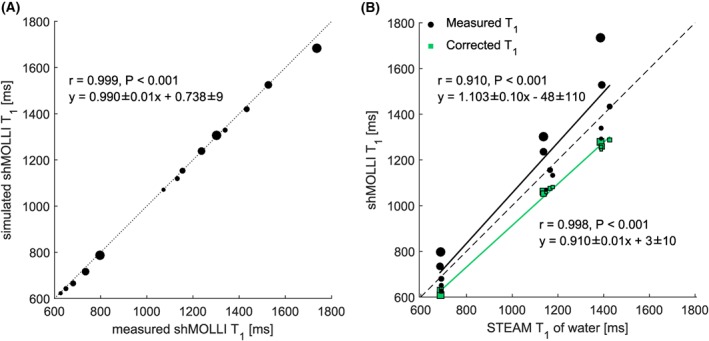
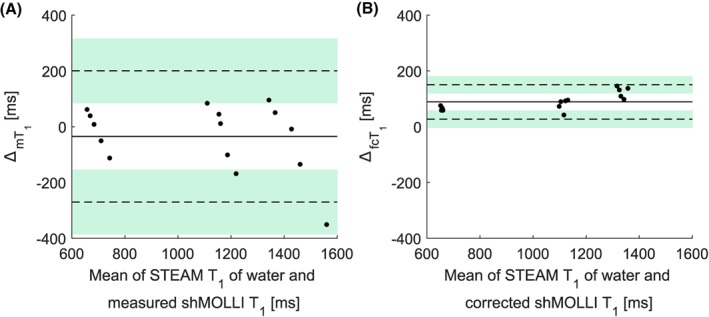
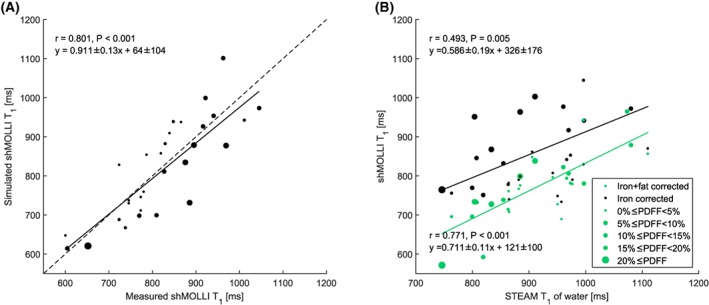
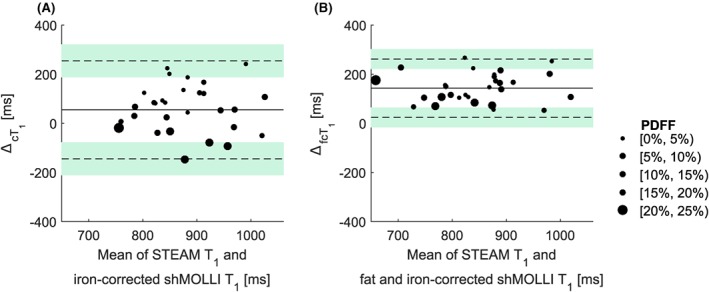
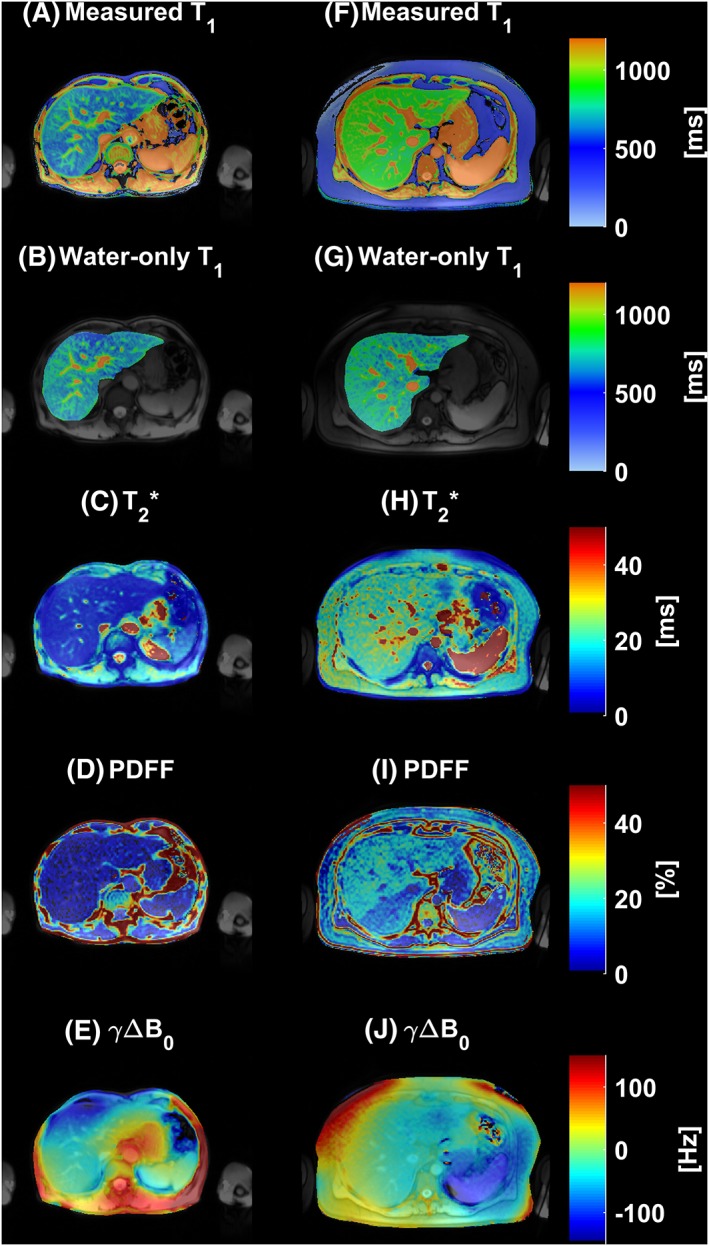
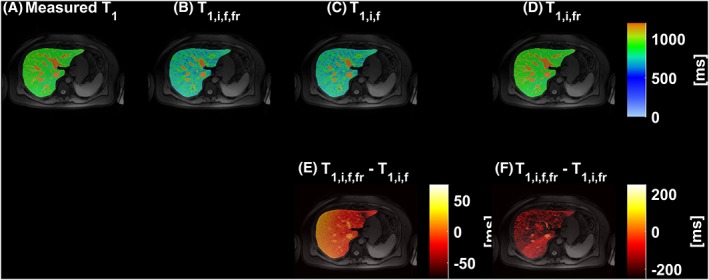
Modified Look-Locker inversion recovery (MOLLI) T1 mapping sequences can be useful in cardiac and liver tissue characterization, but determining underlying water T1 is confounded by iron, fat and frequency offsets. This article proposes an algorithm that provides an independent water MOLLI T1 (referred to as on-resonance water T1 ) that would have been measured if a subject had no fat and normal iron, and imaging had been done on resonance. Fifteen NiCl2 -doped agar phantoms with different peanut oil concentrations and 30 adults with various liver diseases, nineteen (63.3%) with liver steatosis, were scanned at 3 T using the shortened MOLLI (shMOLLI) T1 mapping, multiple-echo spoiled gradient-recalled echo and 1 H MR spectroscopy sequences. An algorithm based on Bloch equations was built in MATLAB, and water shMOLLI T1 values of both phantoms and human participants were determined. The quality of the algorithm's result was assessed by Pearson's correlation coefficient between shMOLLI T1 values and spectroscopically determined T1 values of the water, and by linear regression analysis. Correlation between shMOLLI and spectroscopy-based T1 values increased, from r = 0.910 (P < 0.001) to r = 0.998 (P < 0.001) in phantoms and from r = 0.493 (for iron-only correction; P = 0.005) to r = 0.771 (for iron, fat and off-resonance correction; P < 0.001) in patients. Linear regression analysis revealed that the determined water shMOLLI T1 values in patients were independent of fat and iron. It can be concluded that determination of on-resonance water (sh)MOLLI T1 independent of fat, iron and macroscopic field inhomogeneities was possible in phantoms and human subjects.

Keywords: MOLLI; NAFLD; fat; iron; off-resonance; shMOLLI.


Figures

Figure 1
Figure 1
Block diagram of the water shMOLLI T 1 determination algorithm. In addition to the shMOLLI T 1 map, a multiple‐echo GRE image set and a STEAM 1H spectrum were also collected to derive a B 0 field map of the imaged slice and the PDFF. When the algorithm was used to determine water shMOLLI T 1 values in patients, the GRE images were also used to generate T 2* values and thus HIC values. Knowledge of field strength was necessary for the correct modelling of lipid peaks and the effects of iron. The actual (heart‐rate‐dependent) inversion times were used as in the imaging experiments to eliminate possible errors caused by variable heart rates2
Figure 2
Figure 2
A, “Forward” shMOLLI simulation of the phantoms shows excellent agreement with measured shMOLLI T 1 values. B, Correlation between shMOLLI T 1 and spectroscopy‐based T 1 increases after removing the effects of fat. It is expected to obtain shMOLLI T 1 values lower than those obtained from spectroscopy after the determination of water shMOLLI T 1 values.32 Points on both graphs are size‐coded as a function of phantom PDFF
Figure 3
Figure 3
Bland–Altman plots showing phantom data before (A) and after (B) applying the water shMOLLI T 1 determination algorithm. The near‐zero bias in A is due to the increased shMOLLI T 1 values observed at high fat fractions, while a bias of 89 ms in B can be explained by the expected2 underestimation of T 1 values by the shMOLLI method. An F‐test performed on the two differences shown in A and B revealed that the variance of the measurements was statistically significantly decreased after removing the effects of fat, iron and off‐resonance frequency (F = 15.003, P < 0.001). ΔmT1 is the difference between STEAM T 1 and the measured shMOLLI T 1; ΔfcT1 is the difference between STEAM T 1 and the fat‐independent water shMOLLI T 1
Figure 4
Figure 4
A, “Forward” simulation of patient shMOLLI T 1 measurements. B, Correlation between water shMOLLI T 1 values and spectroscopically measured T 1 of the water in the liver increased after extending the initial iron‐only correction to remove the effects of iron, fat and off‐resonance
Figure 5
Figure 5
Bland–Altman plots of the iron‐corrected (A) and iron‐, fat‐ and off‐resonance‐independent (B) patient data reveal a statistically significant (F = 0.3448, p = 0.0023) reduction of the variance in the difference between STEAM T 1 and shMOLLI T 1 values after removing the effects of iron, fat and B 0 inhomogeneities and remove the systematic trend for higher fat to give higher shMOLLI T 1. As in the case of phantoms, the large bias in B is caused by the previously shown2 underestimation of T 1 values by the shMOLLI method. ΔcT1 is the difference between the STEAM T 1 of the water in the liver and the iron‐corrected shMOLLI T 1; ΔfcT1 is the difference between the STEAM T 1 of the water in the liver and the iron‐, fat‐ and off‐resonance‐independent water shMOLLI T 1
Figure 6
Figure 6
A, F, Two examples of liver shMOLLI T 1 maps affected by iron, fat and B 0 inhomogeneity. B, G, Normal liver T 1 maps resulted after removing the effects of fat, iron and B 0 inhomogeneity. C, H, The calculated T 2* maps show a homogeneous distribution of increased (mean HIC = 2.69 mg/g dry weight) (C) and normal iron concentrations (mean HIC = 1.16 mg/g dry weight) (H). D, E, I, J, Full PDFF (D, mean PDFF = 8.35%; I, mean PDFF = 15.83%) and B 0 field maps (E, mean γ ΔB0 = 1.78 Hz; J, mean γ ΔB0 = −8.81 Hz) are also shown
Figure 7
Figure 7
Three models were used in total to determine water‐only shMOLLI T 1 based on a measured shMOLLI T 1 map (A). In addition to the full model of iron, fat and off‐resonance effects (B), two additional models were implemented: one without accounting for B 0 inhomogeneity and another without accounting for fat. C, The resulting T 1 map after the effects of iron and fat have been removed; E, the difference between the T 1 map obtained by using the full model and this alternative corrected T 1 map. D, Removing the effects of iron and B 0 inhomogeneity only yields higher‐than‐normal T 1 values. The difference between this alternative T 1 map and the water shMOLLI T 1 map determined using the full model (F) is explained by the effects of the fat

References

    1. Messroghli DR, Radjenovic A, Kozerke S, Higgins DM, Sivananthan MU, Ridgway JP. Modified Look‐Locker inversion recovery (MOLLI) for high‐resolution T 1 mapping of the heart. Magn Reson Med. 2004;52(1):141‐146. 10.1002/mrm.20110 - DOI - PubMed
    1. Piechnik SK, Ferreira VM, Dall'Armellina E, et al. Shortened Modified Look‐Locker Inversion recovery (ShMOLLI) for clinical myocardial T1‐mapping at 1.5 and 3 T within a 9 heartbeat breathhold. J Cardiovasc Magn Reson. 2010;12(1):69 10.1186/1532-429X-12-69 - DOI - PMC - PubMed
    1. Salerno M, Janardhanan R, Jiji RS, et al. Comparison of methods for determining the partition coefficient of gadolinium in the myocardium using T1 mapping. J Magn Reson Imaging. 2013;38(1):217‐224. 10.1002/jmri.23875 - DOI - PMC - PubMed
    1. Roujol S, Weingärtner S, Foppa M, et al. Accuracy, precision, and reproducibility of four T1 mapping sequences: a head‐to‐head comparison of MOLLI, ShMOLLI, SASHA, and SAPPHIRE. Radiology. 2014;272(3):683‐689. 10.1148/radiol.14140296 - DOI - PMC - PubMed
    1. Ferreira VM, Piechnik SK, Robson MD, Neubauer S, Karamitsos TD. Myocardial tissue characterization by magnetic resonance imaging: novel applications of T1 and T2 mapping. J Thorac Imaging. 2014;29(3):147‐154. 10.1097/RTI.0000000000000077 - DOI - PMC - PubMed

Publication types