. 2018 Nov 20;25(8):1997-2007.e7.
doi: 10.1016/j.celrep.2018.10.072.

Heart Regeneration in the Mexican Cavefish

Affiliations

Heart Regeneration in the Mexican Cavefish

William T Stockdale et al. Cell Rep. .

Abstract

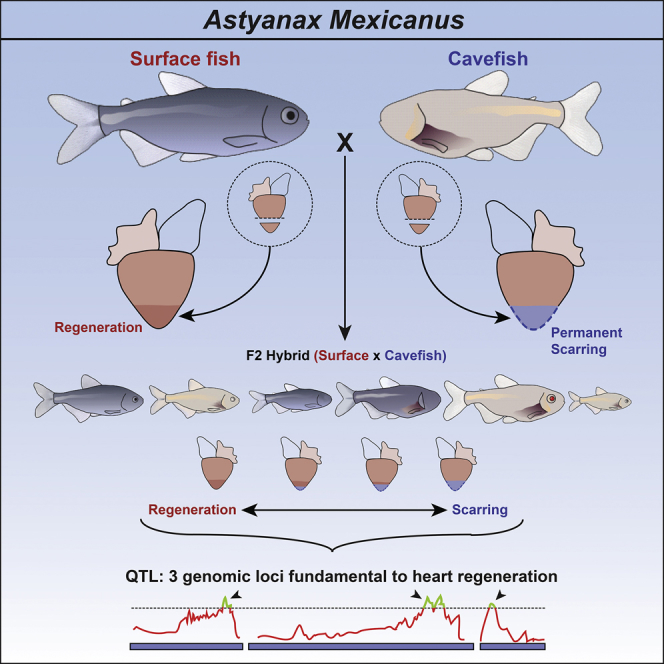
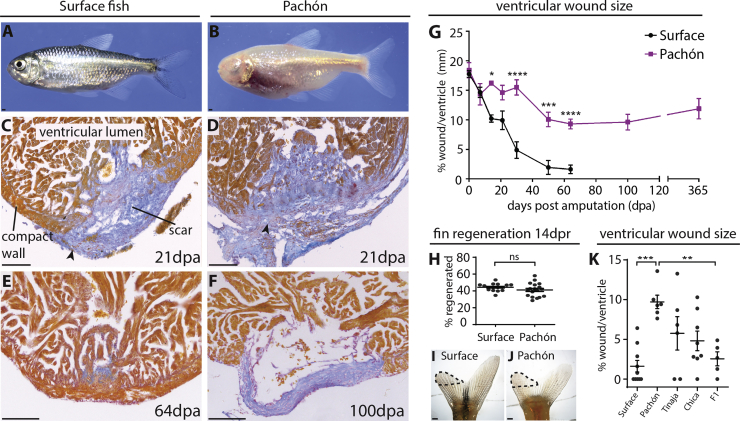
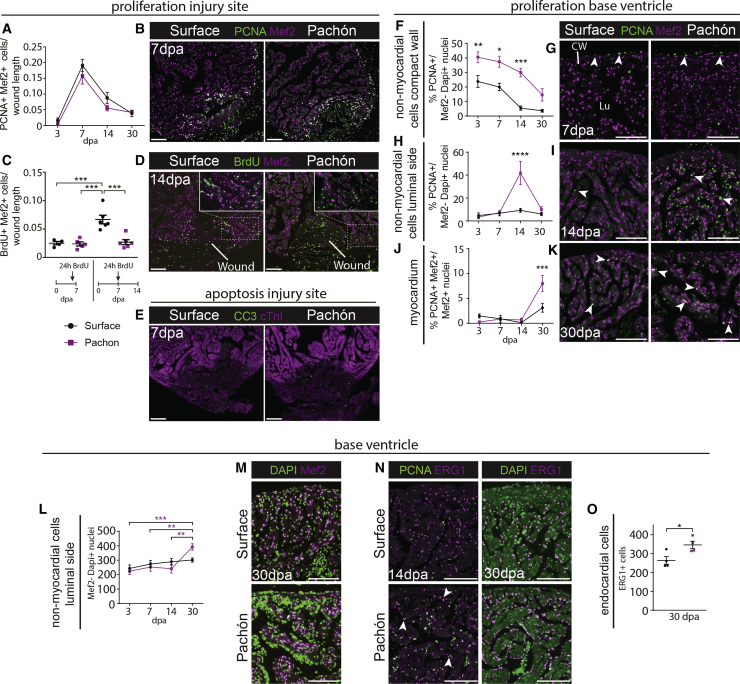
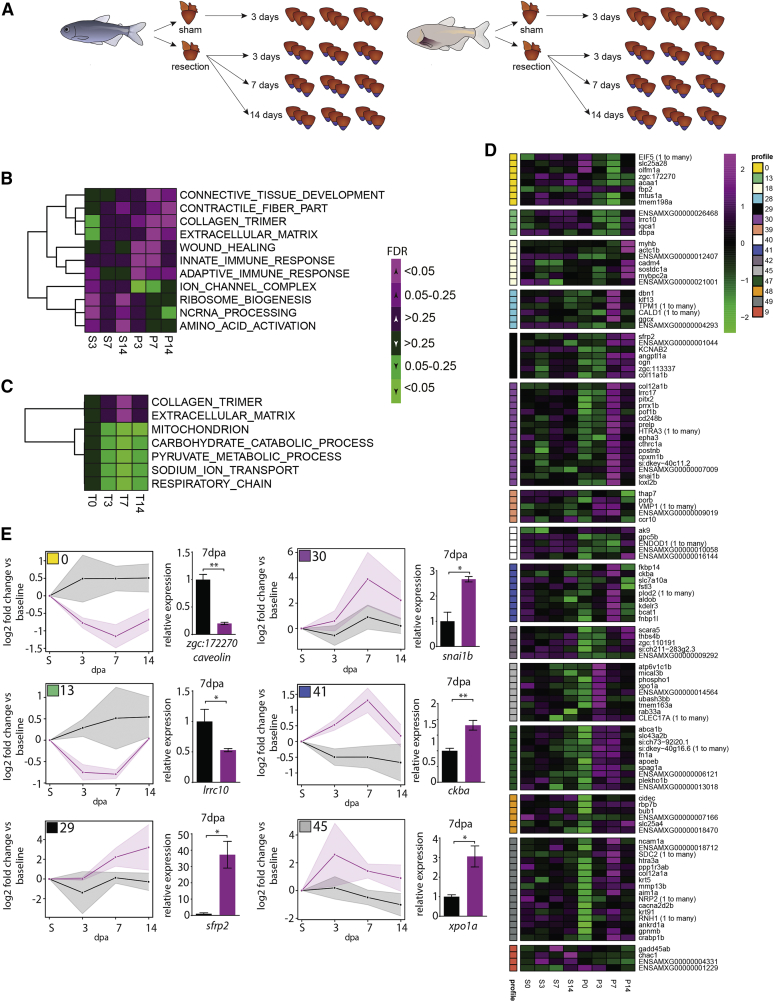
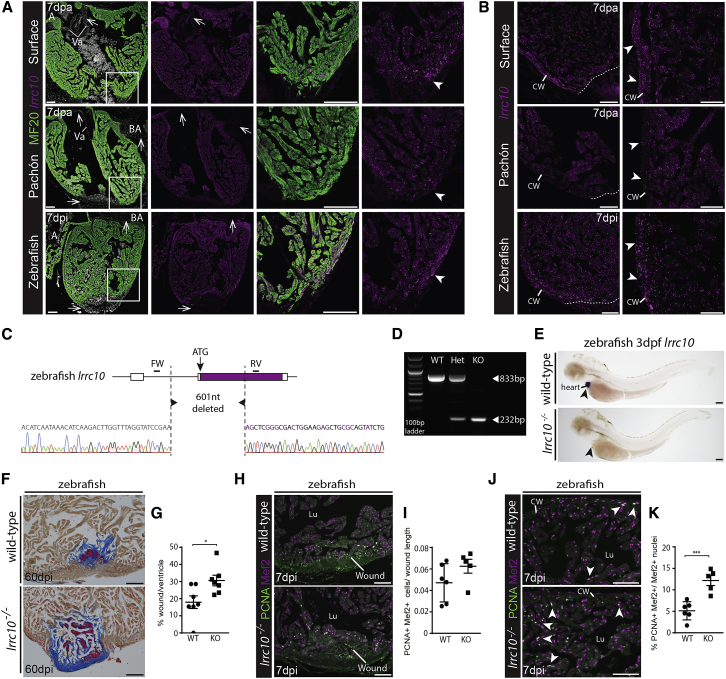
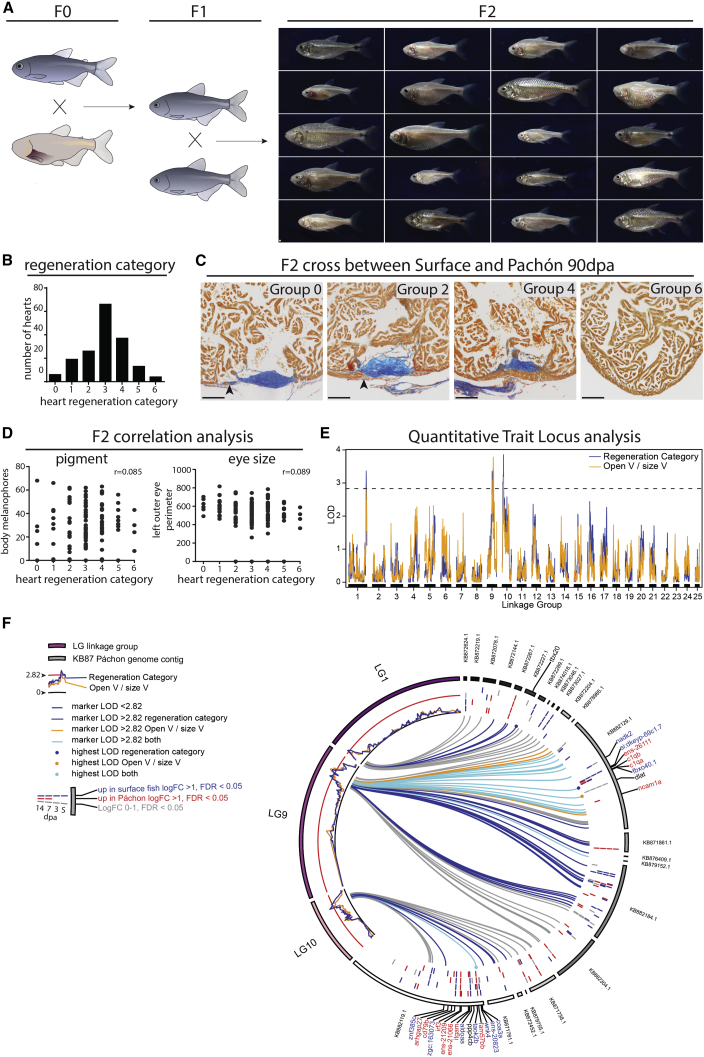
Although Astyanax mexicanus surface fish regenerate their hearts after injury, their Pachón cave-dwelling counterparts cannot and, instead, form a permanent fibrotic scar, similar to the human heart. Myocardial proliferation peaks at similar levels in both surface fish and Pachón 1 week after injury. However, in Pachón, this peak coincides with a strong scarring and immune response, and ultimately, cavefish cardiomyocytes fail to replace the scar. We identified lrrc10 to be upregulated in surface fish compared with Pachón after injury. Similar to cavefish, knockout of lrrc10 in zebrafish impairs heart regeneration without affecting wound cardiomyocyte proliferation. Furthermore, using quantitative trait locus (QTL) analysis, we have linked the degree of heart regeneration to three loci in the genome, identifying candidate genes fundamental to the difference between scarring and regeneration. Our study provides evidence that successful heart regeneration entails a delicate interplay between cardiomyocyte proliferation and scarring.

Keywords: Mexican cavefish; QTL; fibrotic scar; heart regeneration; lrrc10; myocardial proliferation.


Figures

None
Graphical abstract
Figure 1
Figure 1
Permanent Scar Formation after Ventricular Resection in the Pachón Cavefish (A and B) Adult surface (A) and Pachón cavefish (B). (C–F) AFOG staining of the ventricular apex after resection. AFOG staining is a technique that stains myocardium orange and collagen blue. Both populations form a collagen scar (C and D, arrowheads), which disappears in the surface fish around 64 dpa (E), but persists in the Pachón (F). (G) Time line showing the reducing wound size in the surface fish but persisting wound in the Pachón. n ≥ 3 per population per time point, two-way ANOVA with Sidak’s test. (H) No difference in fin regeneration between Pachón (n = 18) and surface fish (n = 16) at 14 days post resection (dpr). Unpaired t test. (I and J) Regenerating dorsal lobes of tail fins of surface fish (I) and Pachón (J) at 14 dpr. Dotted line indicates the regenerated part. (K) Wound size 64 dpa in surface fish (n = 10), Pachón (n = 7), Tinaja (n = 6), Chica (n = 8), and surface fish × Pachón F1 hybrids (n = 5). One-way ANOVA with Tukey’s test. Detailed numbers and statistics are reported in STAR Methods Results are presented as mean ± SEM. All scale bars, 100 μm.
Figure 2
Figure 2
Myocardial Proliferation but No Regeneration in Pachón Hearts (A and B) No significant difference in the number of PCNA/Mef2-positive cells surrounding the wound in Pachón compared with surface fish hearts (A). Myocardial proliferation is highest at 7 dpa in both fish (B). n ≥ 4 per population per time point, two-way ANOVA with Sidak or Tukey test. (C and D) Twenty-four-hour BrdU administration at 6 dpa with heart isolation at 7 dpa or 24 hr BrdU at 7 dpa with isolation at 14 dpa (C). No difference in the number of BrdU-positive cells at 7 dpa (Pachón n = 5, surface fish n = 4) but reduced labeling in the Pachón (n = 6) compared with surface fish (n = 6) at 14 dpa (D). Similar number of cells labeled in Pachón at 7 and 14 dpa. One-way ANOVA with Tukey’s test. (E) Comparable low levels of CC3-positive cells in surface fish and Pachón. cTnI, cardiac troponin I. (F–K) PCNA counts on the basal side of the ventricle. n ≥ 4 per population per time point, two-way ANOVA with Sidak or Tukey test. Increased non-myocardial proliferation at the epicardial layer after injury in the Pachón compared to surface fish (F), and representative image of non-myocardial proliferation 7dpa, indicated by PCNA-positive/Mef2-negative cells at the epicardial layer (G). Sharp increase in non-myocardial proliferation at 14 dpa in the luminal cells of the ventricle in the Pachón versus surface fish (H), with representative image of non-myocardial proliferation 14 dpa in the trabecular area/luminal side (I). Increased myocardial proliferation on the other side of the ventricle in Pachón compared to surface fish at 30 dpa (J), with representative image of myocardial proliferation basal side indicated by PCNA/Mef2-positive cells at 30 dpa in surface fish and Pachón (K). (L and M) Increased non-myocardial cells in the Pachón heart at 30 dpa (L). Representative DAPI and mef2 staining in Pachón and surface fish at the base of the ventricle, 30 dpa (M). n = 4 per fish per time point, two-way ANOVA with Sidak or Tukey test. (N and O) Proliferation in the non-myocardial luminal cells is mostly located in Erg1-positive endocardial cells (N), followed by an increase in endocardial cells in Pachón at 30 dpa (O). Unpaired, two-tailed, equal-variance t test, p = 0.0274. Detailed numbers and statistics are provided in STAR Methods. Results are presented as mean ± SEM. All scale bars, 100 μm. CW, compact wall; Lu, lumen.
Figure 3
Figure 3
Analysis of the Kinetics of Differential Expression in Response to Wounding Identifying lrrc10 (A) Experimental design. Three ventricles pooled per sample, three samples per time point. (B) Heatmap of signed false discovery rate (FDR) values for selected Gene Ontology (GO) terms significantly different by pre-ranked gene set enrichment analysis (GSEA; FDR < 0.05) between sham and at least at one time point per fish. (C) Heatmap of signed FDR values for selected GO terms significantly different between Pachón and surface fish per time point (pre-ranked GSEA FDR < 0.05 at least at one time point). (D) Heatmap of row-normalized gene expression with differential kinetics over the different time points grouped by profile. Profiles shown only if containing at least four genes. (E) Graphs showing median differences in kinetics of selected profiles (profile numbers and colors based on C) between surface fish (gray) and Pachón (magenta), as well as qPCR validation of one of the genes in the same profiles at 7 dpa. Shaded areas show median absolute deviation. For qPCRs, n = 3 for both Pachón and surface fish, unpaired two-tailed t test. Detailed statistics are provided in STAR Methods. Results are presented as mean ± SEM.
Figure 4
Figure 4
lrrc10 Is Required for Heart Regeneration in Zebrafish (A) RNAScope RNA expression analysis shows that lrrc10 is expressed specifically in all the MF20-positive myocardium at 7 dpa in surface fish and Pachón as well as in zebrafish at 7dpi. Arrows point to absent expression in non-myocardial tissues, such as the wound, valves, and bulbus arteriosus. Expression around the wound is higher in surface fish and zebrafish compared with Pachón (arrowheads). (B) lrrc10 is especially higher expressed in the compact myocardium (arrowheads) compared with the trabecular myocardium close to the wound (demarcated with line) in surface fish and zebrafish. This difference is absent in Pachón. (C) Zebrafish lrrc10 mutants were generated by removing 601 nucleotides, including the ATG start site using CRISPR/Cas9. (D) Genotyping with primers just outside the deleted region amplifies a product of 833 bp in wild-types and a product of 232 bp in mutants. (E) Whole-mount in situ hybridization using an lrrc10 antisense probe in 3 dpf (days post fertilization) lrrc10−/− (n = 12) and wild-type embryos (n = 25) shows that lrrc10 expression is specifically present in the wild-type heart (arrow) but absent in the mutant, confirming knockout of lrrc10. (F) AFOG staining showing large blue collagen scar in the lrrc10 mutant compared with the wild-type control at 60 dpi. (G) Wound size at 60 dpi in lrrc10−/− (n = 7) and wild-type controls (n = 7), unpaired two-tailed t test. (H) PCNA/Mef2 staining on lrrc10−/− and controls at 7dpi. (I) No significant difference in the number of PCNA/Mef2-positive cells surrounding the wound in lrrc10−/− (n = 5) compared with wild-type hearts (n = 6) at 7 dpi. Unpaired two-tailed t test, equal variance. (J) PCNA/Mef2 staining on lrrc10−/− and controls at 7dpi at the base of the ventricle. (K) Increased number of PCNA/Mef2-positive cells on the other side of the ventricle in lrrc10−/− (n = 5) compared with wild-type hearts (n = 6) at 7 dpi. Unpaired two-tailed t test, equal variance. All scale bars, 100 μm. BA, bulbus arteriosus; CW, compact wall; Lu, lumen; Va, valves. Results are presented as mean ± SEM.
Figure 5
Figure 5
Three Loci Associated with Heart Regeneration Identified by QTL Analysis (A) The second generation of a cross between surface fish and Pachón results in offspring ranging from large, pigmented fish with no eyes to small cavefish-like fish with black eyes. One hundred eighty-eight F2 hearts were isolated 90 days after resection. (B) Number of F2 generation hearts per heart regeneration class. (C) AFOG staining on F2 hearts. Examples of four of the seven groups used for correlation tests and QTL analysis. Group 0, clear scar, neither compact wall myocardial thickening nor overgrowth (arrowhead). Group 2, clear scar, compact myocardium has started to grow over the scar (arrowhead). Group 4, clear scar, compact myocardium closed. Group 6, no sign of injury left. (D) No correlation between body melanocyte number (r = 0.085) or eye size (r = 0.089) and heart regeneration. Pearson’s correlation. (E) LOD scores per LG, showing three loci above the genome-wide significance threshold of 2.82 (95th percentile of maximum LOD from permutation analysis). (F) Circos plot mapping markers within LOD score peaks on LG1, LG9, and LG10 to the cavefish genome contigs and showing significant log2 fold expression changes for genes overlapping those loci. Detailed numbers and statistics are provided in STAR Methods. All scale bars, 100 μm.

References

    1. Adameyko I.I., Mudry R.E., Houston-Cummings N.R.M., Veselov A.P., Gregorio C.C., Tevosian S.G. Expression and regulation of mouse SERDIN1, a highly conserved cardiac-specific leucine-rich repeat protein. Dev. Dyn. 2005;233:540–552. - PubMed
    1. Altschul S.F., Gish W., Miller W., Myers E.W., Lipman D.J. Basic local alignment search tool. J. Mol. Biol. 1990;215:403–410. - PubMed
    1. Aspiras A.C., Rohner N., Martineau B., Borowsky R.L., Tabin C.J. Melanocortin 4 receptor mutations contribute to the adaptation of cavefish to nutrient-poor conditions. Proc. Natl. Acad. Sci. U S A. 2015;112:9668–9673. - PMC - PubMed
    1. Barrallo-Gimeno A., Nieto M.A. The Snail genes as inducers of cell movement and survival: implications in development and cancer. Development. 2005;132:3151–3161. - PubMed
    1. Bolger A.M., Lohse M., Usadel B. Trimmomatic: a flexible trimmer for Illumina sequence data. Bioinformatics. 2014;30:2114–2120. - PMC - PubMed

Publication types

Substances