

Synaptic Convergence Patterns onto Retinal Ganglion Cells Are Preserved despite Topographic Variation in Pre- and Postsynaptic Territories
- PMID: 30463000
- PMCID: PMC6317877
- DOI: 10.1016/j.celrep.2018.10.089
Synaptic Convergence Patterns onto Retinal Ganglion Cells Are Preserved despite Topographic Variation in Pre- and Postsynaptic Territories
Abstract
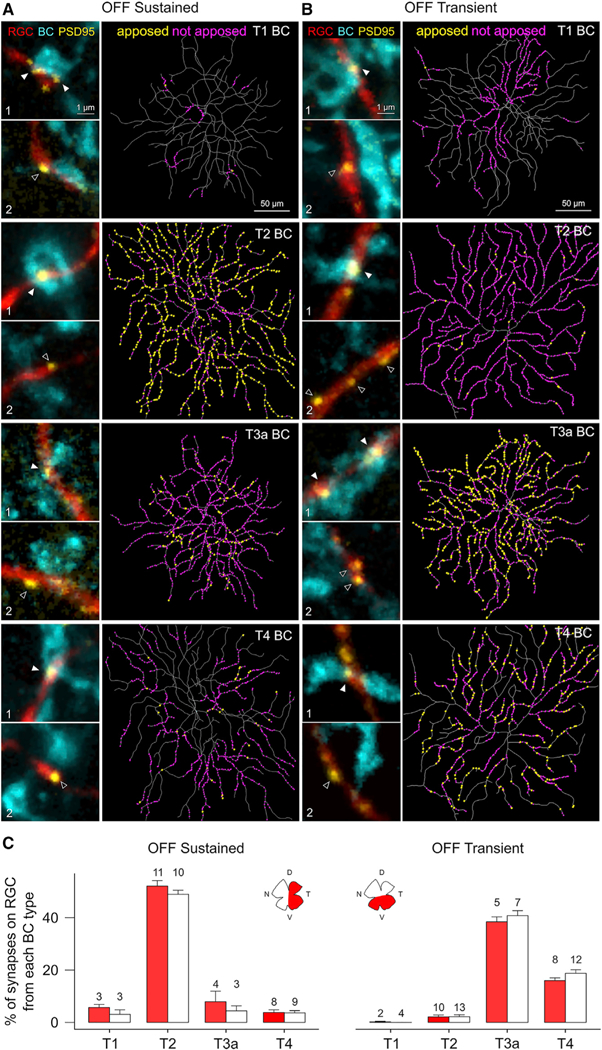
Sensory processing can be tuned by a neuron's integration area, the types of inputs, and the proportion and number of connections with those inputs. Integration areas often vary topographically to sample space differentially across regions. Here, we highlight two visual circuits in which topographic changes in the postsynaptic retinal ganglion cell (RGC) dendritic territories and their presynaptic bipolar cell (BC) axonal territories are either matched or unmatched. Despite this difference, in both circuits, the proportion of inputs from each BC type, i.e., synaptic convergence between specific BCs and RGCs, remained constant across varying dendritic territory sizes. Furthermore, synapse density between BCs and RGCs was invariant across topography. Our results demonstrate a wiring design, likely engaging homotypic axonal tiling of BCs, that ensures consistency in synaptic convergence between specific BC types onto their target RGCs while enabling independent regulation of pre- and postsynaptic territory sizes and synapse number between cell pairs.
Copyright © 2018 The Author(s). Published by Elsevier Inc. All rights reserved.
Conflict of interest statement
DECLARATION OF INTERESTS
The authors declare no competing interests.
Figures


Similar articles
-
Neurotransmission selectively regulates synapse formation in parallel circuits in vivo.Nature. 2009 Aug 20;460(7258):1016-20. doi: 10.1038/nature08236. Nature. 2009. PMID: 19693082 Free PMC article.
-
Distinct Developmental Mechanisms Act Independently to Shape Biased Synaptic Divergence from an Inhibitory Neuron.Curr Biol. 2020 Apr 6;30(7):1258-1268.e2. doi: 10.1016/j.cub.2020.01.080. Epub 2020 Feb 27. Curr Biol. 2020. PMID: 32109390 Free PMC article.
-
Spatial relationships between GABAergic and glutamatergic synapses on the dendrites of distinct types of mouse retinal ganglion cells across development.PLoS One. 2013 Jul 26;8(7):e69612. doi: 10.1371/journal.pone.0069612. Print 2013. PLoS One. 2013. PMID: 23922756 Free PMC article.
-
Dendritic and synaptic protection: is it enough to save the retinal ganglion cell body and axon?J Neuroophthalmol. 2008 Jun;28(2):144-54. doi: 10.1097/WNO.0b013e318177edf0. J Neuroophthalmol. 2008. PMID: 18562848 Review.
-
Neurotrophic regulation of retinal ganglion cell synaptic connectivity: from axons and dendrites to synapses.Int J Dev Biol. 2004;48(8-9):947-56. doi: 10.1387/ijdb.041883sc. Int J Dev Biol. 2004. PMID: 15558485 Review.
Cited by
-
Spike desensitisation as a mechanism for high-contrast selectivity in retinal ganglion cells.Front Cell Neurosci. 2024 Jan 10;17:1337768. doi: 10.3389/fncel.2023.1337768. eCollection 2023. Front Cell Neurosci. 2024. PMID: 38269116 Free PMC article.
-
Using optogenetics to dissect rod inputs to OFF ganglion cells in the mouse retina.Front Ophthalmol (Lausanne). 2023;3:1146785. doi: 10.3389/fopht.2023.1146785. Epub 2023 Mar 6. Front Ophthalmol (Lausanne). 2023. PMID: 37426783 Free PMC article.
-
Visual spatial location influences selection of instinctive behaviours in mouse.R Soc Open Sci. 2023 Apr 26;10(4):230034. doi: 10.1098/rsos.230034. eCollection 2023 Apr. R Soc Open Sci. 2023. PMID: 37122945 Free PMC article.
-
Serotonin regulates in a cell-type specific manner light-evoked response and synaptic activity in mouse retinal ganglion cells.Biol Res. 2025 Mar 4;58(1):11. doi: 10.1186/s40659-025-00594-6. Biol Res. 2025. PMID: 40033464 Free PMC article.
-
Transience of the Retinal Output Is Determined by a Great Variety of Circuit Elements.Cells. 2022 Feb 25;11(5):810. doi: 10.3390/cells11050810. Cells. 2022. PMID: 35269432 Free PMC article. Review.
References
-
- Baddeley A, Rubak E, and Turner R (2015). Spatial Point Patterns: Methodology and Applications with R (Chapman and Hall/CRC Press; ).
Publication types
MeSH terms
Substances
Grants and funding
LinkOut - more resources
Full Text Sources
Molecular Biology Databases
Miscellaneous
