. 2018 Nov 20;25(8):2083-2093.e4.
doi: 10.1016/j.celrep.2018.10.084.

The Molecular Signature of Megakaryocyte-Erythroid Progenitors Reveals a Role for the Cell Cycle in Fate Specification

Affiliations

The Molecular Signature of Megakaryocyte-Erythroid Progenitors Reveals a Role for the Cell Cycle in Fate Specification

Yi-Chien Lu et al. Cell Rep. .

Erratum in

Abstract

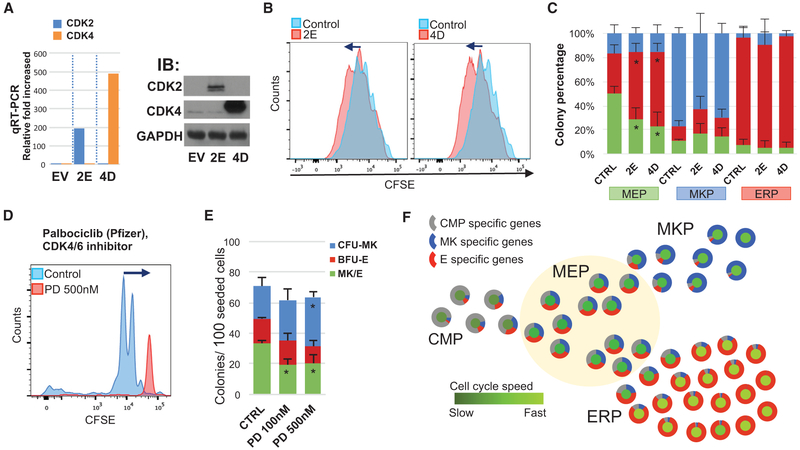
Megakaryocytic-erythroid progenitors (MEPs) give rise to the cells that produce red blood cells and platelets. Although the mechanisms underlying megakaryocytic (MK) and erythroid (E) maturation have been described, those controlling their specification from MEPs are unknown. Single-cell RNA sequencing of primary human MEPs, common myeloid progenitors (CMPs), megakaryocyte progenitors, and E progenitors revealed a distinct transitional MEP signature. Inferred regulatory transcription factors (TFs) were associated with differential expression of cell cycle regulators. Genetic manipulation of selected TFs validated their role in lineage specification and demonstrated coincident modulation of the cell cycle. Genetic and pharmacologic modulation demonstrated that cell cycle activation is sufficient to promote E versus MK specification. These findings, obtained from healthy human cells, lay a foundation to study the mechanisms underlying benign and malignant disease states of the megakaryocytic and E lineages.


Figures

Figure 1.
Figure 1.. Single-Cell Deep Sequencing of Primary CMPs, MEPs, MKPs, and ERPs Reveals Transcriptome Changes
Sorted CMPs, MEPs, MKPs, and ERPs were directly submitted for single-cell sequencing using the Fluidigm C1 platform, and aliquots of cells were functionally assayed using two colony-forming unit assays. (A) Dual megakaryocyte (MK)/erythroid (E) assay showing colonies per 100 cells plated. (B)Methylcellulose assay for colony-forming unit (CFU)-GEMM, CFU-G/M (including CFU-GM, CFU-G, and CFU-M), and BFU-E. See Figure S1A for the sorting strategy. (C)Heatmap of ICGS scRNA-seq gene expression results from donor 1 (D1)with subsequent k-nearest neighbor alignment of single cells from donor2(D2). The originating donor and cell gating methods are indicated below the heatmap (see also Figure S1B). (D)The number of differentially expressed genes for all pairwise group comparisons. (E)Left: Monocle2 trajectory plot showing similar clustering results as Altanalyze shown in Figure 1C. Right: pseudotime represents the computational differentiation progress according to the Monocle algorithm.
Figure 2.
Figure 2.. Gene Expression Patterns Reveal Unique Transitional Gene Expression in MEPs
(A) The 13 categories based on differential gene expression patterns assigned by the lmfit function of Linear Models for Microarray and RNA-Seq Data (LIMMA) (see also Figure S1C). The intensity of each red voxel corresponds to the number of displayed genes in each category. The total number of genes with each expression pattern and its opposite are indicated in the last column. (B) Representative genes for each category are shown as a cell expression amplitude combplot to indicate frequency differences in the expression of the selected genes in all of the individual cells from CMP (black), MEP (green), MKP (blue), and ERP (red). (C) Heatmap of inferred regulatory interactions from genomic states, illustrated from pairwise correlations between all cell population differentially expressed genes (xaxis) and differential transcription factors (TFs) (y axis). Selected marker genes are shown at the top of the plot, and the top statistically enriched Pathway Commons term (green) or progenitor population ICGS markers (blue) are displayed below the plot. Highlighted genes and TFs are bolded in red.
Figure 3.
Figure 3.. Induction of a Cell Cycle-Regulatory Program in MEP Transition to MKP and ERP
(A) GO analysis results for the five most abundant gene sets among the 13 gene categories in Figure 1F. (B) Gene set enrichment analyses (GSEA) for Hallmark and Reactome gene sets indicate the MYC pathway; cell cycle gene sets were enriched after specification, and the p53 pathway decreases during specification. (C) Schematic of the gene network, showing the predicted interaction of a set of key changed genes in MEP to MKP or MEP to ERP, derived using NetPerspective. Red arrows indicate putative transcriptional regulatory interactions derived from chromatin immunoprecipitation (ChIP) or other databases (PAZAR, Amadeus, and TRRUST). Grey arrows indicate protein-protein interactions. The key shows designations for genes that are significantly increased (red) or decreased (blue) in MKPs (left hemicircle) and/or ERPs (right hemicircle) compared with MEPs.
Figure 4.
Figure 4.. MYC and MAX Regulate the Cell Cycle and MEP Specification
(A) MYC and MAX are differently upregulated in ERP and MKP, respectively, in the scRNA-seq data. (B)Two shMAX retroviral constructs were used to suppress intrinsic MAX expression in HEK293T and CD34+cells. qRT-PCR for MAX shows gene suppression in CD34+ cells (top) (n = 3). Western blot (immunoblot [IB]) on transduced HEK293T cells (bottom) shows the protein decrease. (C) Transduced CD34+ cells were sorted for GFP+ MEPs, and proliferation was assessed by CFSE dilution. Both shMAX-1 and shMAX-2 suppress cell proliferation (primary data; Figure S3A). (D) Transduced cells with control or 2 different shRNAs targeting MAX gene were sorted for MEPs (green bar below), MKPs (blue), and ERPs (red) and then assayed for CFU-MK and/or E (n = 3). (E) shMYC decreases MYC RNA and protein (n = 3). (F) Transduced MEPs were selected with puromycin and labeled with CFSE. After 72 hr, cycling was significantly decreased compared with the scrambled shRNA control. (G) Transduced MEPs were assayed by CFU-MK and/or E (n = 4, primary data plot in Figure S3B). (H) shRNA knockdown of p53 reduces ~80% of RNA (left) and ~90% of protein (right) expression. (I) sh-p53-transduced MEPs have a slightly faster cell cycle after 72 hr. (J)sh-p53-transduced MEPs have increased E specification (primary data; Figure S3C). (K) CFSE-labeled MEPs were cultured in liquid medium for 72 hr. (L) After 72 hr, cells were stained with CD41 and CD36. (M) CFU-MK and/orEon fast, medium, and slowly proliferating cells sorted by FACS indicatesthat bipotent cells(green) were enriched inthe slowest-proliferating and E-specified (red) cells in the fastest-proliferating populations (n = 4). Error bars represent the SE; *p < 0.05, **p < 0.01.
Figure 5.
Figure 5.. Drugs Targeting Different Signaling Pathways Affect MEP Fate Decisions
(A) LY-364947 (LY) decreases MEP proliferation (analyzed at 72 hr) compared with the DMSO control. (B) CFU-MK and/or E assay with LY364947 (n = 3). (C) Rapamycin decreases MEP proliferation (analyzed at 72 hr) compared with the control. (D) CFU-MK and/or E assay with rapamycin (n = 3). (E) All-trans retinoic acid (ATRA) decreases MEP proliferation (72 hr) compared with the control. (F) CFU-MK and/or E assay with ATRA (n = 4). Error bars represent the S.E. (n = 4 different donors). (G) Sorted MEPs were treated with LY, ATRA, orrapamycin atthedoses indicated below for 48 hr. After treatment, 300 cells from each experiment were seeded in the CFU-MK and/or E assay without drug (n = 4). The data indicate that drug treatment for 48 hr already affects the MEP fate decision. (H) RNA was obtained from the remaining drug-treated cells used in (G) at 48 hrfor qRT-PCR (n = 4). Results (shown as gene expression relative to DMSO control-treated cells set as 1) show that, although both ATRA and rapamycin suppress the cell cycle and increase MK colonies, they do so via different gene-regulatory pathways. Error bars represent the SE (n = 4 different donors). *p < 0.05, **p < 0.01.
Figure 6.
Figure 6.. Acceleration of the Cell Cycle Increases Erythroid Specification of MEPs
(A) Retrovirus-mediated overexpression of cyclinE-CDK2 (2E) and cyclinD-CDK4 (4D) in MEPs. qRT-PCR validates overexpression in GFP+ transduced CD34+ cells (left). Western blot (right) indicates that the CDK2 or CKD4 protein level was increased in 2D- or 4D-transduced HEK293T cells, respectively. (B) 24 hr after transduction, CD34+ cells were sorted for GFP+ MEPs, MKPs, and ERPs and then labeled with CFSE and cultured for 72 hr. Both 2E and 4D increase cycling compared with the control vector. (C) Sorted transduced cellswere analyzed by CFU-MK and/or E. Increased cycling promotes E specification of MEPs but not MKPs or ERPs (n = 3; primary data; Figure S4A). (D) PD0332991 (PD) suppresses MEP cycling (analysis at 72 hr). (E) CFU-MK and/or E assay with PD (n = 4). (F) Model of gene expression and cell cycle speed changes during the MEP fate decision. CMP-specific genes (gray in the outer circle) gradually decrease, and MKP- or ERP-specific genes (blue and red in the outer circle) gradually increase during MEP → MKP or MEP → ERP specification. The cell cycle speed (central circle) increases with both MKP and ERP specification, but ERPs have significantly more proliferation than MKPs. Error bars represent the SE; *p < 0.05, **p < 0.01.

Comment in

References

    1. Akashi K, Traver D, Miyamoto T, and Weissman IL (2000). A clonogenic common myeloid progenitor that gives rise to all myeloid lineages. Nature 404, 193–197. - PubMed
    1. Bendall SC, Simonds EF, Qiu P, Amir AD, Krutzik PO, Finck R, Bruggner RV, Melamed R, Trejo A, Ornatsky OI, et al. (2011). Singlecell mass cytometry of differential immune and drug responses across a human hematopoietic continuum. Science 332, 687–696. - PMC - PubMed
    1. Blackwood EM, and Eisenman RN (1991). Max: a helix-loop-helix zipper protein that forms a sequence-specific DNA-binding complex with Myc. Science 251, 1211–1217. - PubMed
    1. Boward B, Wu T, and Dalton S (2016). Concise Review: Control of Cell Fate Through Cell Cycle and Pluripotency Networks. Stem Cells 34, 1427–1436. - PMC - PubMed
    1. Chen L, Kostadima M, Martens JHA, Canu G, Garcia SP, Turro E, Downes K, Macaulay IC, Bielczyk-Maczynska E, Coe S, et al. (2014). Transcriptional diversity during lineage commitment of human blood progenitors. Science 345, 1251033. - PMC - PubMed

Publication types

MeSH terms

Substances