. 2018 Nov 20;25(8):2094-2109.e4.
doi: 10.1016/j.celrep.2018.10.071.

Constitutive Activation of the Canonical NF-κB Pathway Leads to Bone Marrow Failure and Induction of Erythroid Signature in Hematopoietic Stem Cells

Affiliations

Constitutive Activation of the Canonical NF-κB Pathway Leads to Bone Marrow Failure and Induction of Erythroid Signature in Hematopoietic Stem Cells

Masahiro Marshall Nakagawa et al. Cell Rep. .

Abstract

Constitutive activation of the canonical NF-κB pathway has been associated with a variety of human pathologies. However, molecular mechanisms through which canonical NF-κB affects hematopoiesis remain elusive. Here, we demonstrate that deregulated canonical NF-κB signals in hematopoietic stem cells (HSCs) cause a complete depletion of HSC pool, pancytopenia, bone marrow failure, and premature death. Constitutive activation of IKK2 in HSCs leads to impaired quiescence and loss of function. Gene set enrichment analysis (GSEA) identified an induction of "erythroid signature" in HSCs with augmented NF-κB activity. Mechanistic studies indicated a reduction of thrombopoietin (TPO)-mediated signals and its downstream target p57 in HSCs, due to reduced c-Mpl expression in a cell-intrinsic manner. Molecular studies established Klf1 as a key suppressor of c-Mpl in HSPCs with increased NF-κB. In essence, these studies identified a previously unknown mechanism through which exaggerated canonical NF-κB signals affect HSCs and cause pathophysiology.

Keywords: NF-kB; bone marrow failure; erythroid differentiation; hematopoietic stem cells; pancytopenia; self-renewal; signal transduction; transcription factors.


Conflict of interest statement

DECLARATION OF INTERESTS

The authors declare no competing interests.

Figures

Figure 1.
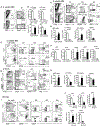
Figure 1.. Deregulated Canonical NF-κB Activation in HSCs Leads to Pancytopenia and Progressive BM Failure
(A) NF-κB target gene expressions in total BM of 14-day-old CA/CA and control mice. Representative data from two independent experiments. (B) NF-κB target gene expressions in HSCs (CD150+ LSK cells) of 14-day-old CA/CA and control mice. Representative data from two independent experiments. (C) Representative pictures of CA/CA and control mice at 2 weeks old (left) and 4 weeks old (right). (D) Kaplan-Meier survival curve analysis of CA/CA and control mice (n = 18). Significance (****p < 0.0001) was assessed using the log-rank test. (E) Complete blood count (CBC) analysis of CA/CA and control mice (n = 3–6 at each time point). Hb, hemoglobin; Plt, platelet. (F) Cell number of hematopoietic organs from CA/CA and control mice (n = 3–6 at each time point). Sp, spleen; Thy, thymus. (G) Normalized (cell number per gram body weight) cell counts of hematopoietic organs from CA/CA and control mice (n = 8 at each time point). All of the data represent means ± SEMs. Two-tailed Student’s t tests were used to assess statistical significance (*p < 0.05, **p < 0.01, ***p < 0.001, ****p < 0.0001).
Figure 2.
Figure 2.. Constitutive Activation of IKK2 Results in a Complete Loss of HSPC Pool
(A) Fluorescence-activated cell sorting (FACS) plots of LSK cells and LSKlow cells from the BM (two femurs and two tibias) of 4-week-old CA/CA and control mice. Data are representative of three independent experiments. (B) Absolute numbers of LSK cells and LSKlow cells from the BM (two femurs and two tibias) of 4-week-old CA/CA (n = 3, duplicate) and control (n = 3, duplicate) mice. (C) FACS plots of LSK cells, LT-HSCs, ST-HSCs, and MPPs from the BM (two femurs and two tibias) of 2-week-old CA/CA and control mice. Data are representative of four independent experiments. (D) Absolute numbers of LSK cells, LT-HSCs, ST-HSCs, and MPPs from the BM (two femurs and two tibias) of 2-week-old CA/CA (n = 4) and control (n = 5) mice. (E) FACS plots of quiescent HSCs and MPP subsets in the BM of 2-week-old CA/CA and control mice. Data are representative of six independent experiments. (F) Absolute numbers of quiescent HSCs and MPP subsets in the BM (two femurs and two tibias) of 2-week-old CA/CA (n = 6) and control (n = 7) mice. (G) FACS plots of LSK cells, LT-HSCs, ST-HSCs, and MPPs from the liver of embryonic day 18 (E18) CA/CA and control fetus. Data are representative of three independent experiments. (H) Absolute numbers of LSK cells, LT-HSCs, ST-HSCs, and MPPs from the fetal livers of E18 CA/CA (n = 3) and control (n = 3) mice. (I and J) FACS plots (I) and absolute numbers (J) of quiescent HSCs and MPP subsets in the BM (two femurs and two tibias) of 6-week-old CA/CA Mx Cre+ and control mice (2 weeks after poly I: pol C [PI:PC] injection) (n = 5). GFP+ cells were pre-gated for CA/CA Mx Cre+ mice. All of the data represent means ± SEMs. Two-tailed Student’s t tests were used to assess statistical significance (*p < 0.05, **p < 0.01, ***p < 0.001, ****p < 0.0001).
Figure 3.
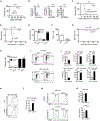
Figure 3.. Augmented NF-κB Signals Affect HSC Functions and Lead to Loss of HSC Quiescence
(A) Kaplan-Meier survival curve analysis of WT recipients (CD45.1+) that received the BM of either CA/CA or control mice (CD45.2+) following lethal (10 Gy) irradiation. Each group represents data from a pool of eight animals. Significance (p < 0.0001) was assessed using the log-rank test. (B) Frequencies of donor (CD45.2+) hematopoiesis in the peripheral blood of WT recipients, 4 weeks after transplantation. Recipients received mixed chimera containing donor (CD45.2+) BM cells (from either CA/CA or control mice) and WT competitor (CD45.1+) BM cells at a ratio of 1:1 (left), 3:1 (middle), and 5:1 (right), respectively. Data are a pool of two independent experiments with two to eight mice per group. (C) Kaplan-Meier survival curve analysis of WT recipients (CD45.1+) that received the BM of either CA/CA Mx Cre+ or control mice (CD45.2+) following lethal (10 Gy) irradiation (n = 7). Significance (p = 0.0002) was assessed using the log-rank test. (D) Kaplan-Meier survival curve analysis. WT recipients (CD45.1+) were lethally irradiated and injected with the BM of either CA/CA Mx Cre+ or control mice (CD45.2+). Four weeks after BMT, recipients were injected with polyI:C and survival was recorded after the last dose of polyI:C (n = 10). Significance (p = 0.0001) was assessed using the log-rank test. (E) Frequencies of donor (CD45.2+)- and recipient (CD45.1+)-derived hematopoiesis in the peripheral blood of WT recipients, 2 weeks after the last dose of polyI:C injection. Lethally irradiated WT (CD45.1+) recipients were injected with total BM of either control or CA/CA Mx Cre+ 4 weeks before polyI:C injection (n = 10). (F) Mixed BM chimera experiment. Frequencies of donor (control and CA/CA Mx Cre+; CD45.2+)-derived hematopoiesis in the peripheral blood of WT recipients, 4 weeks after the last dose of polyI:C injection. Lethally irradiated WT (CD45.1+) recipients were injected with mixed BM of either control + WT(CD45.1+) or CA/CA Mx Cre+ + WT (CD45.1+) 4 weeks before polyI:C injection (n = 10). (G) Kaplan-Meier survival curve analysis. Control or CA/CA Mx Cre+ recipients (CD45.2+) were lethally irradiated and injected with BM of WT mice (CD45.1+). Four weeks after BMT, recipients were injected with polyI:C, and survival was recorded after the last dose of polyI:C (n = 10). Significance (p = 0.0001) was assessed using the log-rank test. (H) Frequencies of donor (CD45.1+)- and recipient (CD45.2+)-derived hematopoiesis in the peripheral blood of WT recipients, 8 weeks after the last dose of polyI:C injection. Lethally irradiated WT (CD45.1+) recipients were injected with total BM of either control or CA/CA Mx Cre+ 4 weeks before polyI:C injection (n = 10). (I and J) Representative FACS plots (I) and bar graphs (J) indicating the frequencies of LSK cells (top) and Flt3low LSK cells (bottom) in G0 (Ki-67 and Hoechst), G1 (Ki-67+ and Hoechst) and G2/S (Ki-67+ and Hoechst+) phase of the cell cycle in the BM of 2-week-old CA/CA (n = 3) and control (n = 5) mice. (K and L) Representative FACS plots (K) and bar graphs (L) indicating the frequencies of cells with high Ki67 expression in Flt3low LSK cells from the BM of 2-week-old CA/CA (n = 3) and control (n = 5) mice. (M and N) Representative FACS plots (M) and bar graphs (N) indicating the frequencies of BrdU+ cells in LSK cells and LT-HSCs in the fetal livers of E18 CA/CA and control mice, following 16-hr pulse with BrdU (n = 3). All of the data represent means ± SEMs. Two-tailed Student’s t tests were used to assess statistical significance (*p < 0.05, **p < 0.01, ***p < 0.001, ****p< 0.0001, ns, not significant).
Figure 4.
Figure 4.. Deregulated Expression of Inflammatory Cytokines and Molecular Signatures of HSCs in CA/CA Mice
(A and B) Real-time PCR data documenting the increased expression levels of inflammatory cytokines in the BM (A) and spleen (B) of IKK2 mutant mice. Shown are cumulative data of independent animals (n = 3) of each group (control and CA/CA). (C–H) Gene set enrichment analysis (GSEA) of microarray data from CA/CA versus control HSCs with the following gene sets: (C) stem cell genes, which are commonly upregulated in HSCs, muscle stem cells (MuSCs), and hair follicle stem cells (HFSCs); (D) genes enriched in normal, steady-state BM HSCs from WT mice compared to multipotent progenitors (MPPs), leukemic stem cells (LSCs), and mobilized HSCs; (E) genes enriched in quiescent HSCs, which are commonly upregulated in adult HSCs (versus fetal liver HSCs) and 0, 1, 10, and 30 days after 5-FU injection (versus 2, 3, and 6 days after 5-FU injection); (F) lineage-committed genes, which are commonly downregulated in HSCs, MuSCs, and HFSCs; (G) genes enriched in day +2 mobilized HSC by cyclophosphamide/GCSF compared to HSC at steady state; and (H) genes commonly upregulated in fetal liver HSCs (versus adult HSCs) and 2, 3, and 6 days after 5-FU injection (versus 0, 1, 10, and 30 days after 5-FU injection). *p < 0.05, ***p < 0.001, ****p < 0.0001.
Figure 5.
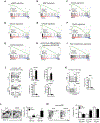
Figure 5.. Decontrolled IKK2 Activity Induces Erythroid Lineage-Specific Transcriptional Program in HSCs
(A and B) GSEA of microarray data from CA/CA versus control HSCs with the following gene sets: top 100 genes upregulated in pMEPs compared to HSCs (A) and top 100 genes upregulated in MEPs compared to HSCs (B). (C–G) GSEA of microarray data from pMEPs (C), MEPs (D), pCFU-Es (E), and MkPs (F) versus HSCs, with the genes enriched in CA/CA HSCs compared to control HSCs. GSEA of microarray data from pCFU-Es versus MkPs, with the genes enriched in CA/CA HSCs compared to control HSCs (G). (H and I) GSEA of microarray data from CA/CA versus control HSCs with the following gene sets: genes that are involved in erythroid differentiation (H) and genes that are involved in heme metabolism and erythroid differentiation (I). (J and K) Representative FACS plots and bar graphs indicating frequencies of CFU-E, pCFU-E, pGM, and pMegE (J), and MkP (K) in the BM of CA/CA mice. (L and M) Representative FACS plots and bar graphs indicating frequencies of pro-erythrocytes (CD71+Ter119), immature erythroblasts (TER119highCD71highFSChigh), less mature erythroblasts (TER119hghCD71highFSClow, and most mature erythroblasts (TER119highCD71lowFSClow) in the BM of CA/CA mice (n = 3). TER119high cells from (L) were pre-gated and further distinguished based on CD71 expression and forward scatter (M). *p < 0.05, ***p < 0.001, ****p < 0.0001.
Figure 6.
Figure 6.. Constitutive Activation of IKK2 Causes Cell-Intrinsic Suppression of c-Mpl in HSPCs
(A) Real-time PCR data for Cdknlc (p57) in Flt3low LSK cells from the BM of 2-week-old CA/CA or control mice. Expression levels of target genes were normalized to hypoxanthine-guanine phosphoribosyltransferase (Hprt) levels. Data are representative of two independent experiments. (B) Phosflow analysis indicating reduced levels of phospho-STAT5 and normal levels of total STAT5 in CA/CA LSK cells in response to TPO. Shown are the geometric mean fluorescence intensity (GMFI) of control and CA/CA cells after normalizing to the unstained cells of the respective groups (n = 3–5). (C and D) Surface expression of c-Mpl in Flt3low LSK cells (left) and Flt3hgh LSK cells (right) from the BM of 2-week-old CA/CA or control mice. Representative FACS plots (C) and bar graphs of GMFI (D) (n = 3). (E) Real-time PCR data for c-Mpl in Flt3low LSK cells from the BM of 2-week-old CA/CA or control mice. Expression levels of target genes were normalized to Hprt levels. Data are representative of two independent experiments. (F–H) Surface expression of c-Mpl in LSK cells (F), Flt3low LSK cells (G), and Flt3high LSK cells (H) from the BM of 6-week-old CA/CA Mx Cre+ and control mice (2 weeks after PI:PC injection). Representative FACS plots (left) and bar graphs of MFI (right) (n = 5). (I) Surface expression of c-Mpl in LSK cells from the BM of 2-week-old A20Hem-KO or control mice. Representative FACS plots (left) and bar graphs of MFI (right) (n = 2). All of the data represent means ± SEMs. Two-tailed Student’s t tests were used to assess statistical significance (*p < 0.05, **p < 0.01, ***p < 0.001, ****p < 0.0001).
Figure 7.
Figure 7.. Klf1 Acts as a Transcriptional Repressor of c-Mpl in HSPCs
(A and B) Real-time PCR data for Klf1 and Gata1 (A), and Gata2 (B), in Flt3low LSK cells from the BM of 2-week-old CA/CA or control mice. Expression levels of target genes were normalized to Hprt levels. Data are representative of two independent experiments. (C and D) Expression activity (C) and correlation (D) of c-Mpl (1421461_at) and Klf1 (1418600_at) in WT mouse HSPCs. Probeset with a more dynamic range was chosen if the gene had more than one probeset. Two-tailed Pearson correlation test was performed. (E) Diagrammatic representation of the c-Mpl gene, indicating the presence of Klf1 binding sites in its promoter. (F) ChIP analysis of Klf1 binding to the c-Mpl promoter in the BM or Lin cells of 2-week-old CA/CA or control mice. Shown are the real-time PCR data of Klf1 immunoprecipitates, which were normalized to immunoglobulin G (IgG) control immunoprecipitates. Data are representative of two independent experiments. (G) c-Mpl promoter (−496 to 19) luciferase assay in 293T cells with and without the exogenous expression of Klf1. Data are representative of two independent experiments. (H) Real-time PCR data for c-Mpl in GFP+ cells from Mock and Klf1 transduced LSK cells. Expression levels of target genes were normalized to Hprt levels. Data are representative of two independent experiments. All of the data represent means ± SEMs. Two-tailed Student’s t tests were used to assess statistical significance (*p < 0.05, **p < 0.01, ****p < 0.0001).

References

    1. Almarza E, Segovia JC, Guenechea G, Gómez SG, Ramírez A, and Bueren JA (2004). Regulatory elements of the vav gene drive transgene expression in hematopoietic stem cells from adult mice. Exp. Hematol 32, 360–364. - PubMed
    1. Baldridge MT, King KY, Boles NC, Weksberg DC, and Goodell MA (2010). Quiescent haematopoietic stem cells are activated by IFN-gamma in response to chronic infection. Nature 465, 793–797. - PMC - PubMed
    1. Benz C, Martins VC, Radtke F, and Bleul CC (2008). The stream of precursors that colonizes the thymus proceeds selectively through the early T lineage precursor stage of T cell development. J. Exp. Med 205, 1187–1199. - PMC - PubMed
    1. Boyer SW, Schroeder AV, Smith-Berdan S, and Forsberg EC (2011). All hematopoietic cells develop from hematopoietic stem cells through Flk2/Flt3-positive progenitor cells. Cell Stem Cell 9, 64–73. - PMC - PubMed
    1. Bresnick EH, Lee HY, Fujiwara T, Johnson KD, and Keles S (2010). GATA switches as developmental drivers. J. Biol. Chem 285, 31087–31093. - PMC - PubMed

Publication types