. 2018 Nov 20;25(8):2110-2120.e3.
doi: 10.1016/j.celrep.2018.10.076.

The NF-κB Factor Relish Regulates Atg1 Expression and Controls Autophagy

Affiliations

The NF-κB Factor Relish Regulates Atg1 Expression and Controls Autophagy

Anubhab Nandy et al. Cell Rep. .

Abstract

Macroautophagy and cell death both contribute to innate immunity, but little is known about how these processes integrate. Drosophila larval salivary glands require autophagy for developmentally programmed cell death, and innate immune signaling factors increase in these dying cells. Here, we show that the nuclear factor κB (NF-κB) factor Relish, a component of the immune deficiency (Imd) pathway, is required for salivary gland degradation. Surprisingly, of the classic Imd pathway components, only Relish and the PGRP receptors were involved in salivary gland degradation. Significantly, Relish controls salivary gland degradation by regulating autophagy but not caspases. In addition, expression of either Relish or PGRP-LC causes premature autophagy induction and subsequent gland degradation. Relish controls autophagy by regulating the expression of Atg1, a core component and activator of the autophagy pathway. Together these findings demonstrate that a NF-κB pathway regulates autophagy during developmentally programmed cell death.

Keywords: Drosophila; NF-κB; autophagy; cell death.


Conflict of interest statement

DECLARATION OF INTERESTS

The authors declare no competing interests.

Figures

Figure 1.
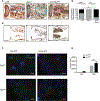
Figure 1.. The Drosophila NF-κB Factor Relish Is Essential for Salivary Gland Degradation
(A) Representative histological sections of control (Rel E23) and Relish mutant (RelE20) flies 24 hr APF. Anatomical features are noted in the left panel, and salivary gland fragments observed in the Relish mutants are highlighted within dotted blue circle. (A‘) Representative histological sections of control (RelE23, left) and Relish mutant (RelE20, right) 24 hr APF. All tissues except the salivary gland cellular fragments were removed in Photoshop. (B) Quantitation of histology from 20 independent pupae for each strain as in (A). Statistical analysis by chi-square test. (C) Representative histological sections of samples of control Relish mutants (fkh-Gal4/+;; RelE20, left), and Relish mutants with salivary-gland-specific expression of transgenic Relish (fkh-Gal4/+; UAS-Relish/+; RelE20, right) analyzed 24 hr APF. Salivary gland fragments are highlighted within dotted blue circle. (D) Quantitation of histology from 20 independent pupae for each strain as in (C). Statistical analysis by chi-square test. (E) Representative histological sections of control (PGRP-LE112/+;; PGRP-LCxΔE /+, left) and PGRP-LC mutants (PGRP-LCxΔE, middle) and PGRP-LC and PGRP-LE double mutants (PGRP-LE112;; PGRP-LCxΔE, right) flies 24 hr APF. Salivary gland fragments observed in PGRP mutants are highlighted within dotted blue circle. (F) Quantitation of histology from 20 independent pupae for each strain as in (E). Statistical analysis by chi-square test. ****p < 0.0001, ***p < 0.001, **p < 0.01. See also Figures S1, S2, S3, and S4.
Figure 2.
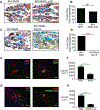
Figure 2.. Relish Controls Salivary Gland Degradation Independent of Caspase Activity
(A) epresentative histological sections of animals with salivary-gland-specific expression of p35 (fkh-gal4/+; UAS-p35/+; RelE20/+, left), Relish mutants (UAS-p35; RelE20, middle), and Relish mutants with salivary-gland-specific expression of p35 (fkh-gal4/+; UAS-p35/+; RelE20, right) 24 hr APF. Salivary gland cell fragments are within dotted blue, and gland fragments are within dotted red circle. (A‘) Representative histological sections of animals with salivary-gland-specific expression of p35 (fkh-gal4/+; UAS-p35/+; RelE20/+, left), Relish mutants (UAS-p35; RelE20, middle), and Relish mutants with salivary-gland-specific expression of p35 (fkh-gal4/+; UAS-p35/+; RelE20, right) 24 hr APF. All tissues except the salivary gland cellular fragments and gland fragments were removed in Photoshop. (B) Quantitation of histology from 21, 23, and 24 independent pupae, respectively, for each strain as in (A). Statistical analysis by chi-square test comparing gland fragments in the p35 only versus p35, Relish strains. **p < 0.01. (C) Cleaved caspase-3 antibody staining (green) and DAPI (blue) in salivary glands of control (RelE23) and mutant (RelE20) animals at 0 hr and 14 hr APF. Scale bar, 25 μm. (D) Quantitation of cleaved caspase-3 puncta in salivary glands of control (RelE23) and mutant (RelE20) animals at 0 hr and 14 hr APF (n = 7 salivary glands). Data presented as mean ± SEM, and statistical analysis by unpaired two-tailed t test with Welch’s correction. ns, not significant.
Figure 3.
Figure 3.. Relish-Mediated Salivary Gland Degradation Is Autophagy Dependent
(A) Representative histological sections 24 hr APF of Atg18 mutants (left, Atg18KG03090/Df(3L)Exel6112); Relish mutant (middle, Atg18KG03090, RelE20/RelE20); and Atg18, Relish double mutants (right, if/CyO; Atg18KG03090, RelE20/Df(3L)Exel6112, RelE20). Salivary gland fragments are within blue dotted circle. (B) Quantitation of histology from 9, 10, and 12 independent pupae for each genotype as in (A), respectively. Statistical significance by chi-square test. ns, not significant. (C) Representative images of mCherry-Atg8a expressed in the salivary glands of control animals (w; pmCherry-Atg8a; RelE20/TM6b) or Relish null mutants (w; pmCherry-Atg8a; RelE20). Salivary glands were dissected and visualized 14 hr APF. Image scale bar, 50 μm. (D) Quantitation of mCherryAtg8a-puncta from 5 independent salivary glands for each genotype as in (C). Data presented as mean ± SEM, and statistical analysis by unpaired two-tailed t test with Welch’s correction. **p < 0.01. (E) Representative histological sections of Relish mutants (UAS-Atg16A; RelE20, left), and Relish mutants with transgenic salivary-gland-specific Atg1 expression, (fkh-Gal4/+; UAS-Atg16A /+; RelE20, right) analyzed 24 hr APF. Salivary gland fragments are highlighted within dotted blue circle. (F) Quantitation of histology from 20 independent pupae for each strain as in (E). Statistical analysis by chi-square test. *p < 0.05. See also Figure S4.
Figure 4.
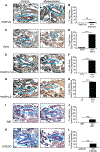
Figure 4.. Relish-N or PGRP-LC Misexpression Causes Premature Gland Degradation
(A and B) Representative histological sections from 6 hr APF of control animals (left, w; UAS-Relish full-length,) and animals expressing Relish full-length ectopically in salivary glands (right, w; UAS-Relish full-length /+; fkh-Gal4/+) (A). Salivary glands are highlighted within blue dotted circles. (B) Quantitation of histological sections from 20 independent pupae as in (A). Statistical significance by chi-square test. ns not significant. (C and D) Representative histological sections from 6 hr APF of control animals (left, UAS-RelN, w) and animals expressing Relish N-terminal ectopically in salivary glands (right, UAS-RelN/+;; fkh-Gal4/+) (C). Salivary glands are highlighted within blue dotted circles. (D) Quantitation of histological sections from 20 independent pupae as in (C). Statistical significance by chi-square test. ****p < 0.0001. (E and F) Representative histological sections from 6 hr APF of control animals (left, w; UAS-PGRP-LCx) and animals expressing PGRP-LCx ectopically in salivary glands (right, w; UAS-PGRP-LCx/+; fkh-Gal4/+) (E). Salivary glands are highlighted within blue dotted circles. (F) Quantitation of histological sections from 20 independent pupae as in (E). Statistical significance by chi-square test. ****p < 0.0001. (G and H) Representative histological sections from 6 hr APF of control animals (left, w; UAS-PGRP-LE) and animals expressing PGRP-LE ectopically in salivary glands (right, w;UAS-PGRP-LE/+; fkh-Gal4/+) (G) Salivary glands are highlighted within blue dotted circles. (H) Quantitation of histological sections from 20 independent pupae as in (G). Statistical significance by Chi-square test. ****p < 0.0001. (I and J) Representative histological sections from hr APF of control animals (left, w; UAS-imd) and animals expressing imd ectopically in salivary glands (right, w;UAS-imd/+; fkh-Gal4/+) (I). Salivary glands are highlighted within blue dotted circles. (J) Quantitation of histological sections from 20 independent pupae as in (I). Statistical significance by chi-square test. ns, not significant. (K and L) Representative histological sections from 6 hr APF of control animals (left, w;; UAS-Dredd) and animals expressing Dredd ectopically in salivary glands (right, w;;UAS-Dredd/fkh-Gal4) (K). Salivary glands are highlighted within blue dotted circles. (L) Quantitation of histological sections from 20 independent pupae as in (K). Statistical significance by chi-square test. ns, not significant. See also Figures S5 and S6.
Figure 5.
Figure 5.. Relish-N- and PGRP-LC-Mediated Early Gland Degradation Is Autophagy Dependent
(A) Representative histological sections of animals expressing RelN (left, UAS-RelN/+;; fkh-Gal4/+) and animals expressing RelN and p35 together (UAS-RelN/+;; fkh-Gal4/UAS-p35) in salivary glands 6 hr APF. Salivary glands are highlighted within blue dotted circles. (B) Quantitation of histology from 20 pupae for each genotype as in (A). Statistical significance by chi-square test. ns, not significant. (C) Representative histological sections of ani-mals expressing RelN in salivary glands of wild-type flies (left, UAS-RelN/+;; fkh-Gal4/+) and in Atg18 mutant flies (right, UAS-RelN/fkh-Gal4;; Atg18KG03090/Df (3L) Exel6112) 6 hr APF. Salivary glands are highlighted within blue dotted circles. (D) Quantitation of 14 and 10 independent pupae, respectively, from each genotype as in (C). Statistical significance by chi-square test. ****p < 0.0001, ns not significant. (E and F) Representative images of dissected salivary glands from wandering larvae (E). All cells express mCherryAtg8, while RelN is expressed in GFP marked clone cells (hsflp/UAS-RelN; pmCherryAtg8/CyO; act < FRT, cd2, FRT > Gal4; UAS-GFP/+). Quantitation of the cell size of RelN expressing cells compared to neighboring wild-type cells is shown in (F). n = 3 salivary glands. Data presented as mean ± SEM, and statistical analysis by unpaired two-tailed t test with Welch’s correction. *p < 0.05. (G and H) Representative images of dissected salivary glands from wandering larvae (G). All cells express mCherryAtg8, while PGRP-LCx is expressed in GFP marked clone cells (hsflp/w; pmCherryAtg8/UAS-PGRP-LCx; act < FRT, cd2, FRT > Gal4; UAS-GFP/+). Scale bar, 25 μm. Quantitation of the cell size of PGRP-LCx expressing cells and wild-type cells is shown in (H). n = 3 salivary glands. Data presented as mean ± SEM, and statistical analysis by unpaired two-tailed t test with Welch’s correction. **p < 0.01. See also Figure S6.
Figure 6.
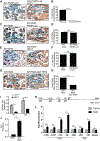
Figure 6.. Relish Controls Autophagy through Atg1 Expression
(A) Representative histological sections of animals expressing PGRP-LCx in salivary glands of wild-type flies (left, w; UAS-PGRP-LCx/+; fkh-Gal4/+) and Relish mutant flies (right, fkh-Gal4/+; UAS-PGRP-LCx/+; RelE20) 6 hr APF. (B) Quantitation of 20 independent pupae from each genotype as in (A). Statistical significance by chi-square test. (C) Representative histological sections of animals expressing RelN in salivary glands of wild-type flies (left, UAS-RelN/+;; fkh-Gal4/+) and in PGRP-LCx mutant flies (right, UAS-RelN/fkh-gal4;; PGRP-LCxΔE) 6 hr APF. (D) Quantitation of 20 independent pupae, respectively, from each genotype as in (C). Statistical significance by chi-square test. (E) Representative histological sections of animals expressing RelN in salivary glands of wild-type flies (left, UAS-RelN/+;; fkh-Gal4/+) and in Atg13 mutant flies (right, UAS-RelN/+;; fkh-gal4, Atg1374) 6 hr APF. (F) Quantitation of 10 and 11 independent pupae, respectively, from each genotype as in (E). Statistical significance by chisquare test. (G) Representative histological sections of animals expressing RelN (left, UAS-RelN/+;; fkh-Gal4/+) and animals expressing RelN and Atg1 RNAi together (UAS-RelN/+; UAS-Atg1 RNAi/+; fkh-Gal4/+) in salivary glands 6 hr APF. (H) Quantitation of histology from 20 pupae for each genotype as in (G). Statistical significance by chi-square test. For (A), (C), and (E), salivary glands are highlighted within blue dotted circles. (I) Atg1 gene expression levels in salivary glands of control (RelE23) and RelE20 animals at 0 hr and 14 hr APF, measured by qRT-PCR. n = 3 independent RNA samples, each collected from 30 salivary glands. Data presented as mean ± SEM, and statistical analysis by unpaired two-tailed t test with Welch’s correction. (J) Atg1 gene expression in salivary glands of control (UAS-RelN) and RelN expressing animals (UAS-RelN/+;; fkh-Gal4/+) 6 hr APF, quantified by qRT-PCR. n = 3 independent RNA samples, each collected from 30 salivary glands. Data presented as mean ± SEM, and statistical analysis by unpaired two-tailed t test with Welch’s correction. (K) The putative NF-κB sites in the promoter region ( 1706 bp, 1229 bp, 723 bp, 26 bp) and transcription initiation site of the Atg1 genes are indicated in the diagram, as well as the downstream region (9284), which was used as a negative control. (L) Chromatin immunoprecipitation (ChIP) analysis of the recruitment of Relish-N to the promoters of Diedel, Atg1, and Diptericin in salivary glands. Diedel and Diptericin were used as negative and positive controls, respectively. All values are represented as fold enrichment. Glands from the RelN expressing strain (UAS-FLAG-RelN/+; tub-Gal80ts/+; fkh-Gal4/+) were compared to the driver only control strain (w; tub-Gal80ts; fkh-Gal4). n = 3 independent chromatin samples, each collected from 150 salivary glands. ****p < 0.0001, ***p < 0.001, **p < 0.01, *p < 0.05. ns, not significant. See also Figure S6.

Similar articles

Cited by

References

    1. Andres AJ, and Thummel CS (1994). Methods for quantitative analysis of transcription in larvae and prepupae. Methods Cell Biol 44, 565–573. - PubMed
    1. Berry DL, and Baehrecke EH (2007). Growth arrest and autophagy are required for salivary gland cell degradation in Drosophila. Cell 131, 1137–1148. - PMC - PubMed
    1. Bonizzi G, and Karin M (2004). The two NF-kappaB activation pathways and their role in innate and adaptive immunity. Trends Immunol 25, 280–288. - PubMed
    1. Buchon N, Silverman N, and Cherry S (2014). Immunity in Drosophila melanogaster–from microbial recognition to whole-organism physiology. Nat. Rev. Immunol 14, 796–810. - PMC - PubMed
    1. Cadwell K (2016). Crosstalk between autophagy and inflammatory signalling pathways: balancing defence and homeostasis. Nat. Rev. Immunol 16, 661–675. - PMC - PubMed

Publication types

MeSH terms

LinkOut - more resources