Comparative Characterization of the Complete Mitochondrial Genomes of the Three Apple Snails (Gastropoda: Ampullariidae) and the Phylogenetic Analyses
- PMID: 30463257
- PMCID: PMC6274680
- DOI: 10.3390/ijms19113646
Comparative Characterization of the Complete Mitochondrial Genomes of the Three Apple Snails (Gastropoda: Ampullariidae) and the Phylogenetic Analyses
Abstract
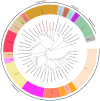
The apple snails Pomacea canaliculata, Pomacea diffusa and Pomacea maculate (Gastropoda: Caenogastropoda: Ampullariidae) are invasive pests causing massive economic losses and ecological damage. We sequenced and characterized the complete mitochondrial genomes of these snails to conduct phylogenetic analyses based on comparisons with the mitochondrial protein coding sequences of 47 Caenogastropoda species. The gene arrangements, distribution and content were canonically identical and consistent with typical Mollusca except for the tRNA-Gln absent in P. diffusa. An identifiable control region (d-loop) was absent. Bayesian phylogenetic analysis indicated that all the Ampullariidae species clustered on the same branch. The genus Pomacea clustered together and then with the genus Marisa. The orders Architaenioglossa and Sorbeoconcha clustered together and then with the order Hypsogastropoda. Furthermore, the intergenic and interspecific taxonomic positions were defined. Unexpectedly, Ceraesignum maximum, Dendropoma gregarium, Eualetes tulipa and Thylacodes squamigerus, traditionally classified in order Hypsogastropoda, were isolated from the order Hypsogastropoda in the most external branch of the Bayesian inference tree. The divergence times of the Caenogastropoda indicated that their evolutionary process covered four geological epochs that included the Quaternary, Neogene, Paleogene and Cretaceous periods. This study will facilitate further investigation of species identification to aid in the implementation of effective management and control strategies of these invasive species.
Keywords: Ampullariidae; Pomacea canaliculata; Pomacea diffusa; Pomacea maculate; comparative characterization; mitochondrial genome; phylogenetic analysis.
Conflict of interest statement
The authors declare no conflict of interest.
Figures


Similar articles
-
The mitochondrial genome of Pomacea maculata (Gastropoda: Ampullariidae).Mitochondrial DNA A DNA Mapp Seq Anal. 2016 Jul;27(4):2895-6. doi: 10.3109/19401736.2015.1060426. Epub 2015 Jun 23. Mitochondrial DNA A DNA Mapp Seq Anal. 2016. PMID: 26099974
-
The complete mitochondrial genome of Pomacea canaliculata (Gastropoda: Ampullariidae).Mitochondrial DNA A DNA Mapp Seq Anal. 2016;27(2):884-5. doi: 10.3109/19401736.2014.919488. Epub 2014 May 27. Mitochondrial DNA A DNA Mapp Seq Anal. 2016. PMID: 24865920
-
Complete mitochondrial genome of the giant ramshorn snail Marisa cornuarietis (Gastropoda: Ampullariidae).Mitochondrial DNA A DNA Mapp Seq Anal. 2016 May;27(3):1734-5. doi: 10.3109/19401736.2014.961145. Epub 2014 Sep 26. Mitochondrial DNA A DNA Mapp Seq Anal. 2016. PMID: 25259454
-
The complete mitochondrial genome of the apple snail Pomacea maculate (Gastropoda: Ampullariidae).Mitochondrial DNA B Resour. 2018 Oct 26;3(2):1064-1066. doi: 10.1080/23802359.2018.1511841. Mitochondrial DNA B Resour. 2018. PMID: 33474416 Free PMC article.
-
A Dissenters' View on AppleSnail Immunobiology.Front Immunol. 2022 May 26;13:879122. doi: 10.3389/fimmu.2022.879122. eCollection 2022. Front Immunol. 2022. PMID: 35693764 Free PMC article. Review.
Cited by
-
Complete Mitogenomes of Three Carangidae (Perciformes) Fishes: Genome Description and Phylogenetic Considerations.Int J Mol Sci. 2020 Jun 30;21(13):4685. doi: 10.3390/ijms21134685. Int J Mol Sci. 2020. PMID: 32630142 Free PMC article.
-
Novel gene rearrangement in the mitochondrial genome of Siliqua minima (Bivalvia, Adapedonta) and phylogenetic implications for Imparidentia.PLoS One. 2021 Apr 6;16(4):e0249446. doi: 10.1371/journal.pone.0249446. eCollection 2021. PLoS One. 2021. PMID: 33822813 Free PMC article.
-
Sequence characterization and phylogenetic analysis of mitogenome of the Acanthorhodeus chankaensis Dybowsky from Cao'e River.Mitochondrial DNA B Resour. 2020 Jan 14;5(1):545-547. doi: 10.1080/23802359.2019.1710282. Mitochondrial DNA B Resour. 2020. PMID: 33366640 Free PMC article.
-
Characterization of the Complete Mitochondrial Genome of Angulyagra polyzonata and Its Phylogenetic Status in Viviparidae.Animals (Basel). 2025 Apr 30;15(9):1284. doi: 10.3390/ani15091284. Animals (Basel). 2025. PMID: 40362105 Free PMC article.
-
The complete mitochondrial genome of Siphonariajaponica (Heterobranchia, Siphonariidae) and its phylogenetic implications.Zookeys. 2025 Jun 6;1240:257-276. doi: 10.3897/zookeys.1240.141126. eCollection 2025. Zookeys. 2025. PMID: 40519761 Free PMC article.
References
-
- Levin P.C.R., Taylor J.M., Hayes K.A., Burnett K.M., Ferguson C.A. Apple snail invasions and the slow road to control: Ecological, economic, agricultural and cultural perspectives in hawaii. In: Joshi R.C., Sebastian L.S., editors. Global Advances in Ecology and Management of Golden Apple Snails. 2nd ed. Philippine Rice Research Institute; Nueva Ecija, Philippines: 2006. pp. 325–335.
-
- Lowe S.B.M., Boudjelas S., De Poorter M. The Invasive Species Specialists Group of the Species Survival Commission of the World Conservation Union. Hollands Printing; Auckland, New Zealand: 2000. 100 of the world’s worst invasive alien species: A selection from the global invasive species database.
-
- Cazzaniga N.J. Old species and new concepts in the taxonomy of pomacea (gastropoda: Ampullariidae) Europe PMC. 2002;26:71–81. - PubMed
-
- Cowie R.H., Hayes K.A., Thiengo S.C. What are apple snails? Confused taxonomy and some preliminary resolution. In: Joshi R.C., Sebastian L.S., editors. Global Advances in Ecology and Management of Golden Apple Snails. 2nd ed. Philippine Rice Research Institute; Nueva Ecija, Philippines: 2006.
Publication types
MeSH terms
Substances
Grants and funding
- No. U1131006, No. 30770403, No. 30900187, No. 31502144, No. 31870525/National Natural Science Foundation of China
- (No.〔2018〕118/Provincial Projects with Special Funds for Promoting Economic Development of Marine and Fisheries Department of Guangdong
- No. 2015A030313409/Natural Science Foundation of Guangdong Province
- No.2015B090903077, No.2017A090905030/Guangdong Science and Technology Program
- No.201604020062/the Science and Technology Project of Guangzhou
LinkOut - more resources
Full Text Sources

