

Lactate Promotes Myoblast Differentiation and Myotube Hypertrophy via a Pathway Involving MyoD In Vitro and Enhances Muscle Regeneration In Vivo
- PMID: 30463265
- PMCID: PMC6274869
- DOI: 10.3390/ijms19113649
Lactate Promotes Myoblast Differentiation and Myotube Hypertrophy via a Pathway Involving MyoD In Vitro and Enhances Muscle Regeneration In Vivo
Abstract
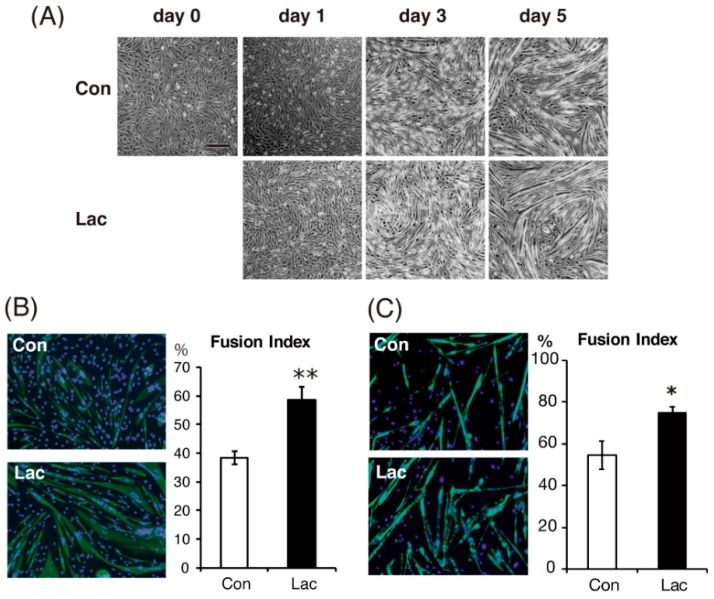
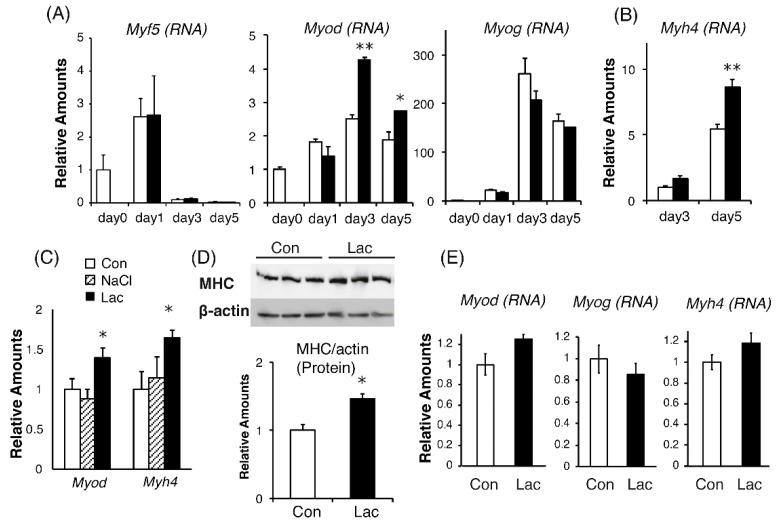
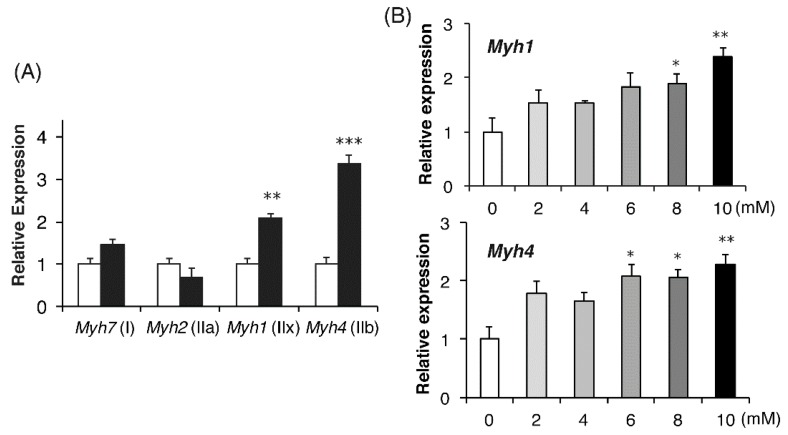
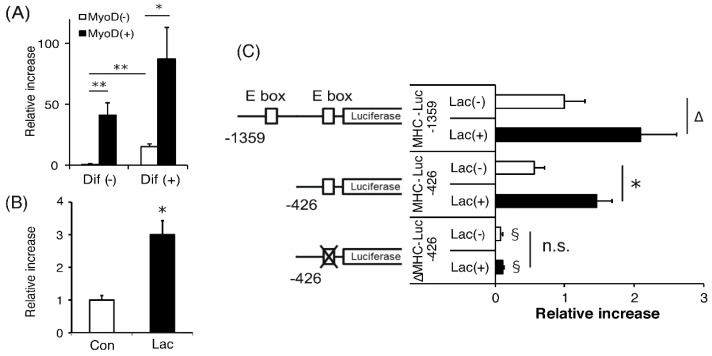
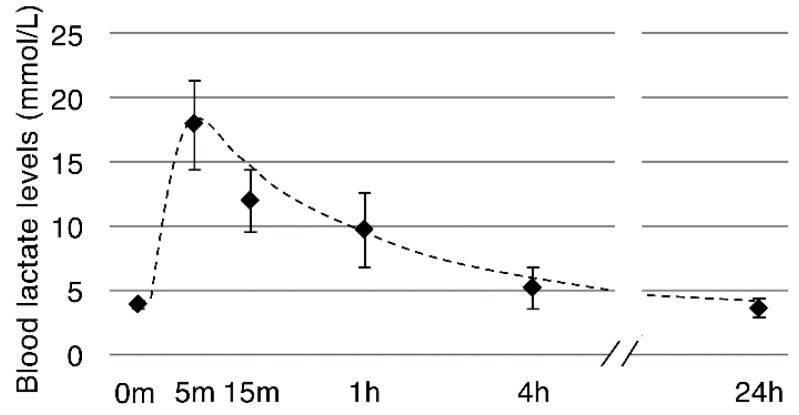
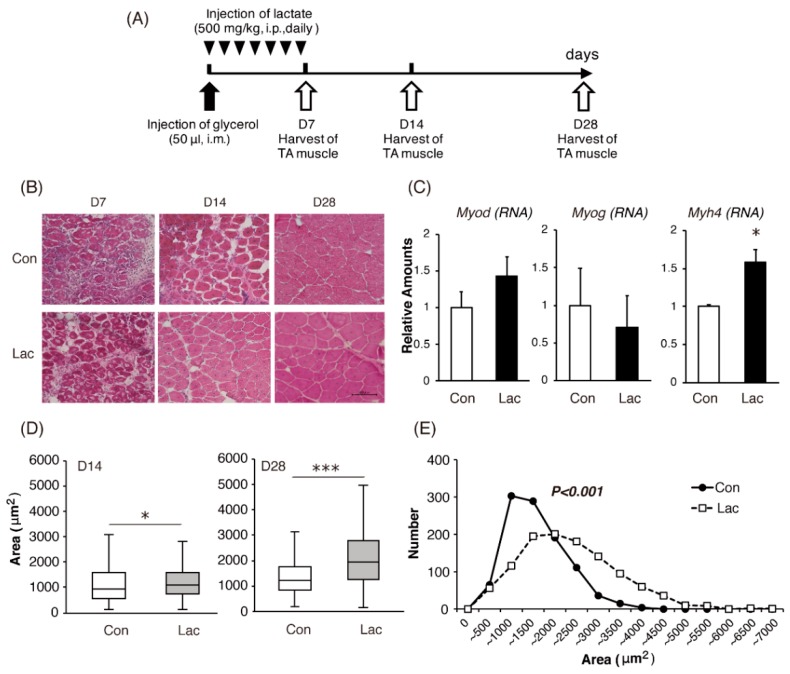
Lactate is a metabolic substrate mainly produced in muscles, especially during exercise. Recently, it was reported that lactate affects myoblast differentiation; however, the obtained results are inconsistent and the in vivo effect of lactate remains unclear. Our study thus aimed to evaluate the effects of lactate on myogenic differentiation and its underlying mechanism. The differentiation of C2C12 murine myogenic cells was accelerated in the presence of lactate and, consequently, myotube hypertrophy was achieved. Gene expression analysis of myogenic regulatory factors showed significantly increased myogenic determination protein (MyoD) gene expression in lactate-treated cells compared with that in untreated ones. Moreover, lactate enhanced gene and protein expression of myosin heavy chain (MHC). In particular, lactate increased gene expression of specific MHC isotypes, MHCIIb and IId/x, in a dose-dependent manner. Using a reporter assay, we showed that lactate increased promoter activity of the MHCIIb gene and that a MyoD binding site in the promoter region was necessary for the lactate-induced increase in activity. Finally, peritoneal injection of lactate in mice resulted in enhanced regeneration and fiber hypertrophy in glycerol-induced regenerating muscles. In conclusion, physiologically high lactate concentrations modulated muscle differentiation by regulating MyoD-associated networks, thereby enhancing MHC expression and myotube hypertrophy in vitro and, potentially, in vivo.
Keywords: MyoD; fiber hypertrophy; lactate; muscle differentiation; myosin heavy chain.
Conflict of interest statement
The authors declare no conflict of interest.
Figures
Similar articles
-
Activation of the beta myosin heavy chain promoter by MEF-2D, MyoD, p300, and the calcineurin/NFATc1 pathway.J Cell Physiol. 2007 Apr;211(1):138-48. doi: 10.1002/jcp.20916. J Cell Physiol. 2007. PMID: 17111365
-
Myoblast Myogenic Differentiation but Not Fusion Process Is Inhibited via MyoD Tetraplex Interaction.Oxid Med Cell Longev. 2018 May 7;2018:7640272. doi: 10.1155/2018/7640272. eCollection 2018. Oxid Med Cell Longev. 2018. PMID: 29854094 Free PMC article.
-
Effects of 1,25(OH)2 D3 and 25(OH)D3 on C2C12 Myoblast Proliferation, Differentiation, and Myotube Hypertrophy.J Cell Physiol. 2016 Nov;231(11):2517-28. doi: 10.1002/jcp.25388. Epub 2016 Apr 14. J Cell Physiol. 2016. PMID: 27018098 Free PMC article.
-
[Pathophysiology in muscle fiber necrosis and regeneration with a particular reference to regenerating process].Rinsho Shinkeigaku. 1998 Dec;38(12):997-1000. Rinsho Shinkeigaku. 1998. PMID: 10349337 Review. Japanese.
-
An intrinsic genetic program for autonomous differentiation of muscle cells in the ascidian embryo.Proc Natl Acad Sci U S A. 1996 Sep 3;93(18):9315-21. doi: 10.1073/pnas.93.18.9315. Proc Natl Acad Sci U S A. 1996. PMID: 8790327 Free PMC article. Review.
Cited by
-
Identification of Lactate as a Cardiac Protectant by Inhibiting Inflammation and Cardiac Hypertrophy Using a Zebrafish Acute Heart Failure Model.Pharmaceuticals (Basel). 2021 Mar 15;14(3):261. doi: 10.3390/ph14030261. Pharmaceuticals (Basel). 2021. PMID: 33803943 Free PMC article.
-
H3K18 lactylation marks tissue-specific active enhancers.Genome Biol. 2022 Oct 3;23(1):207. doi: 10.1186/s13059-022-02775-y. Genome Biol. 2022. PMID: 36192798 Free PMC article.
-
Mechanical Force Modulates Alveolar Bone Marrow Mesenchymal Cells Characteristics for Bone Remodeling during Orthodontic Tooth Movement through Lactate Production.Cells. 2022 Nov 22;11(23):3724. doi: 10.3390/cells11233724. Cells. 2022. PMID: 36496983 Free PMC article.
-
Comparison of blood lactate and perceived exertion responses in two matched time-under-tension protocols.PLoS One. 2020 Jan 15;15(1):e0227640. doi: 10.1371/journal.pone.0227640. eCollection 2020. PLoS One. 2020. PMID: 31940407 Free PMC article.
-
The Multiple Roles of Lactate in the Skeletal Muscle.Cells. 2024 Jul 10;13(14):1177. doi: 10.3390/cells13141177. Cells. 2024. PMID: 39056759 Free PMC article. Review.
References
-
- Cruz-Jentoft A.J., Baeyens J.P., Bauer J.M., Boirie Y., Cederholm T., Landi F., Martin F.C., Michel J.P., Rolland Y., Schneider S.M., et al. Sarcopenia: European consensus on definition and diagnosis: Report of the European Working Group on Sarcopenia in Older People. Age Age. 2010;39:412–423. doi: 10.1093/ageing/afq034. - DOI - PMC - PubMed
-
- Dutta C. Significance of sarcopenia in the elderly. J. Nutrition. 1997;127:992S–993S. - PubMed
-
- Karakelides H., Nair K.S. Sarcopenia of aging and its metabolic impact. Curr. Top. Dev. Biol. 2005;68:123–148. - PubMed
MeSH terms
Substances
Grants and funding
LinkOut - more resources
Full Text Sources
Molecular Biology Databases
Research Materials
