. 2018 Nov 20;4(4):34.
doi: 10.3390/ncrna4040034.

Long Non-Coding RNA Modulation of VEGF-A during Hypoxia

Affiliations

Long Non-Coding RNA Modulation of VEGF-A during Hypoxia

Tiina Nieminen et al. Noncoding RNA. .

Abstract

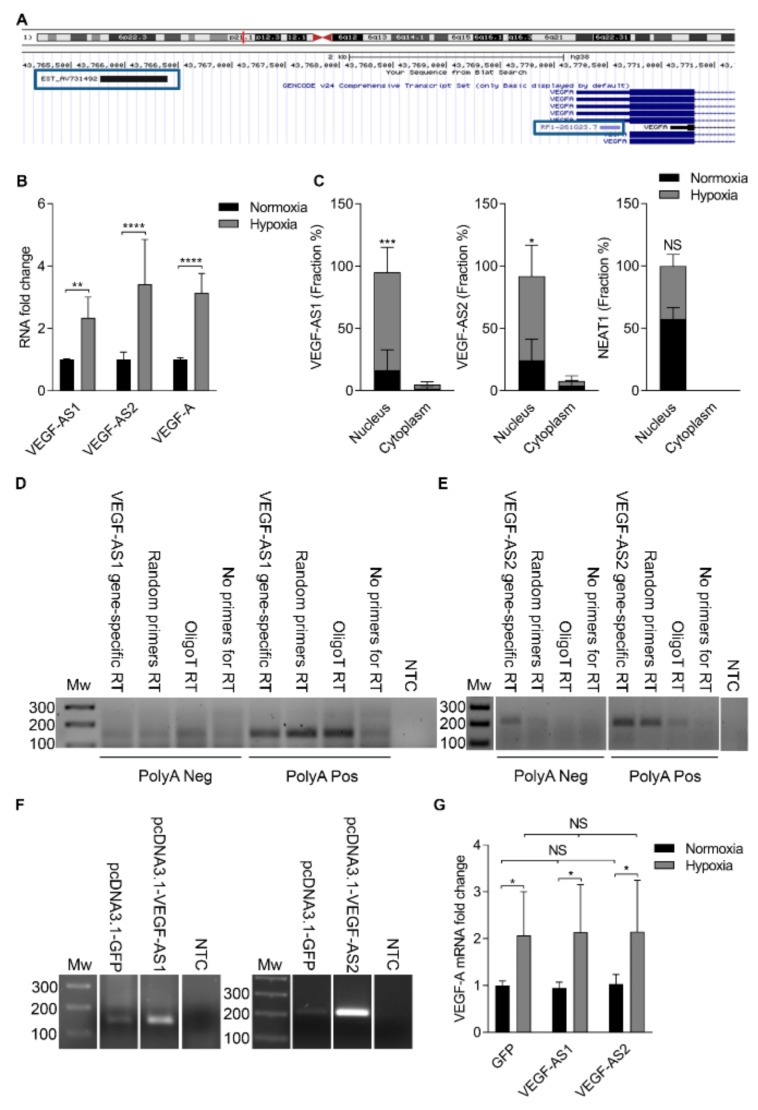
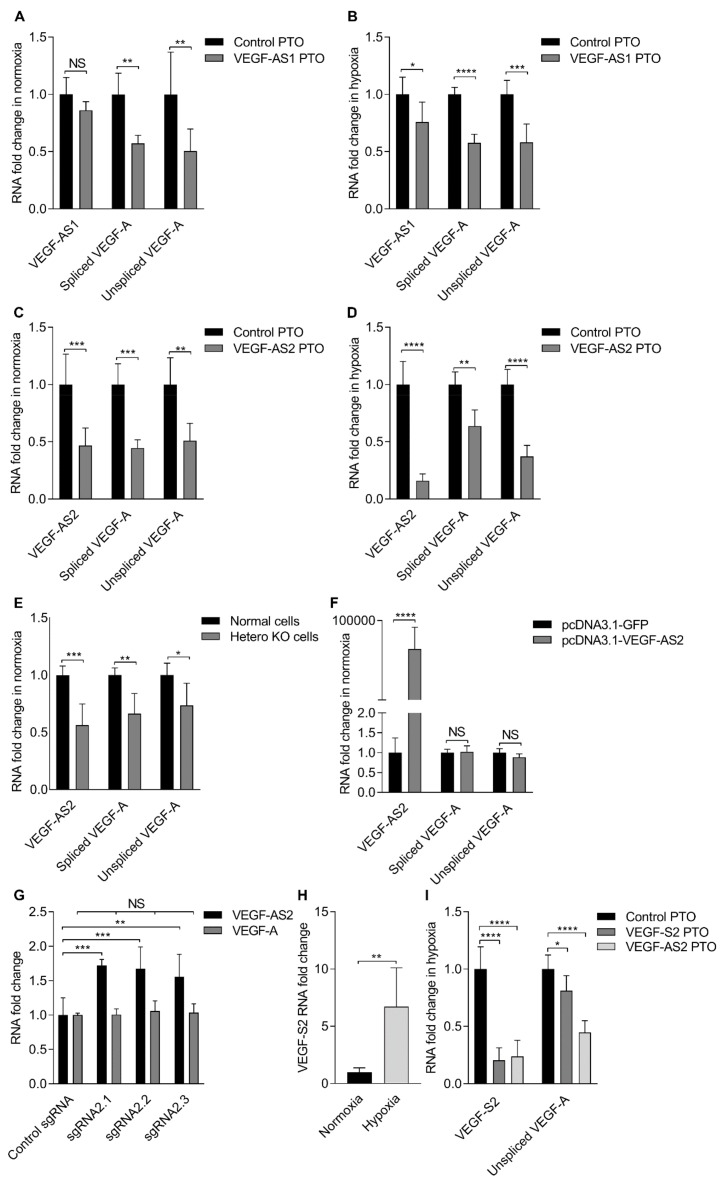
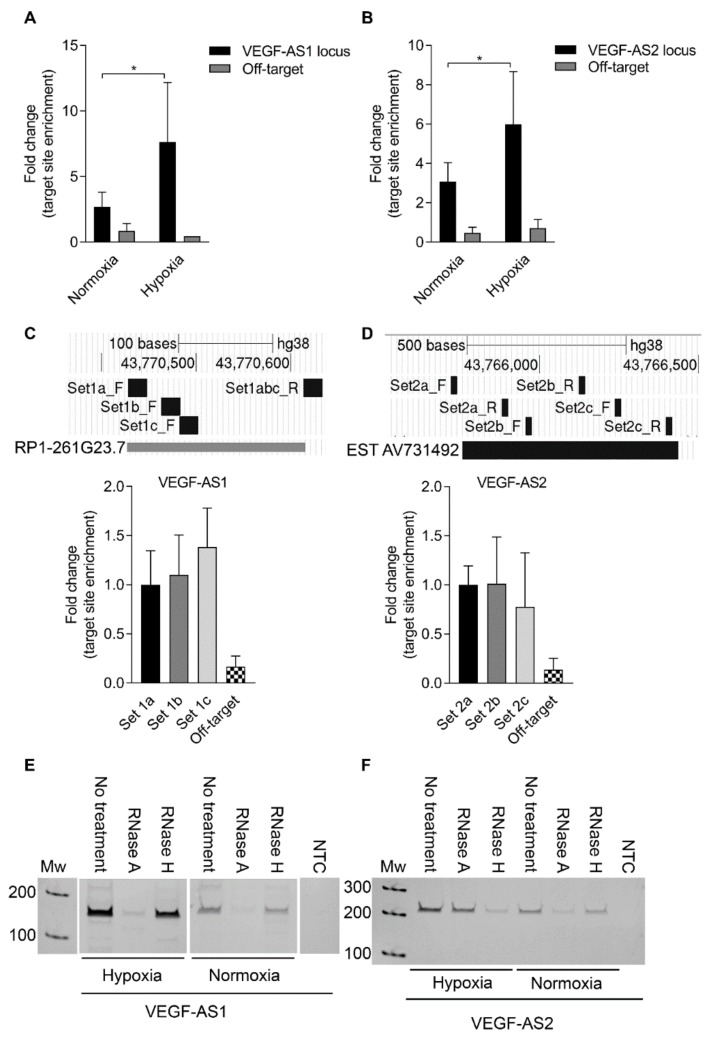
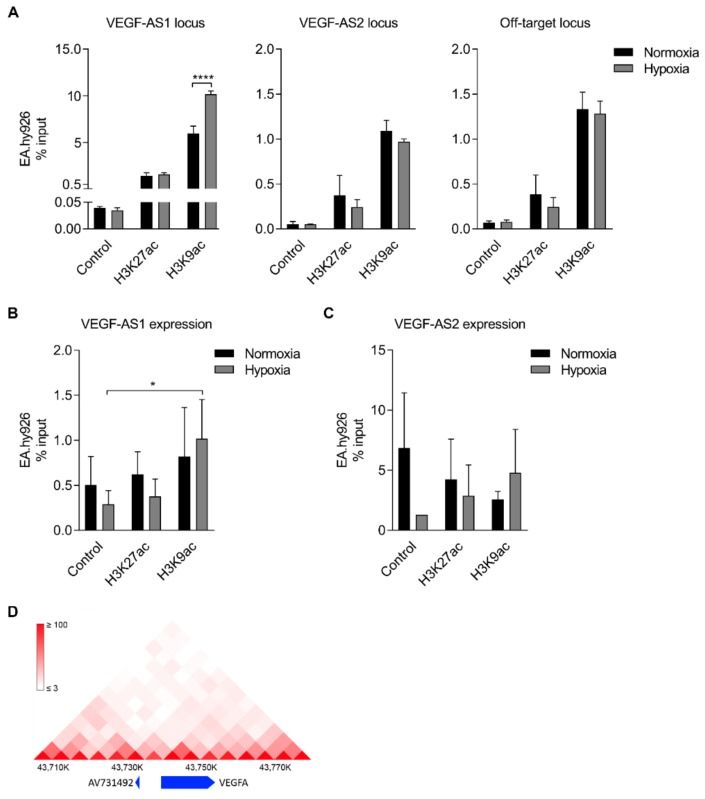
The role and function of long non-coding RNAs (lncRNAs) in modulating gene expression is becoming apparent. Vascular endothelial growth factor A (VEGF-A) is a key regulator of blood vessel formation and maintenance making it a promising therapeutic target for activation in ischemic diseases. In this study, we uncover a functional role for two antisense VEGF-A lncRNAs, RP1-261G23.7 and EST AV731492, in transcriptional regulation of VEGF-A during hypoxia. We find here that both lncRNAs are polyadenylated, concordantly upregulated with VEGF-A, localize to the VEGF-A promoter and upstream elements in a hypoxia dependent manner either as a single-stranded RNA or DNA bound RNA, and are associated with enhancer marks H3K27ac and H3K9ac. Collectively, these data suggest that VEGF-A antisense lncRNAs, RP1-261G23.7 and EST AV731492, function as VEGF-A promoter enhancer-like elements, possibly by acting as a local scaffolding for proteins and also small RNAs to tether.

Keywords: antisense RNA; long non-coding RNA (lncRNA); transcriptional activation; vascular endothelial growth factor A (VEGF-A).


Conflict of interest statement

The authors declare no conflict of interest.

Figures

Figure 1
Figure 1
The expression of both vascular endothelial growth factor A (VEGF-A) promoter associated antisense long non-coding RNAs (lncRNAs) is upregulated in hypoxia. (A) A schematic is shown depicting the location of RP1-261G23.7 (VEGF-AS1) and EST AV731492 (VEGF-AS2) in the human genome relative to the VEGF-A gene; (B) fold change in VEGF-AS1, VEGF-AS2 and spliced VEGF-A expression levels in EA.hy926 cells ± hypoxia as determined by quantitative reverse transcription -polymerase chain reaction (qRT-PCR) and standardized to β-2-microglobulin (B2M). The data are presented as mean ± standard deviation (SD) (n = 3 independent experiments). Significance was measured by two-way analysis of variance (ANOVA). ** p < 0.01, **** p < 0.0001; (C) qRT-PCR analysis of VEGF-AS1, VEGF-AS2 and nuclear paraspeckle assembly transcript 1 (NEAT1) expression in subcellular fractions from EA.hy926 cells ± hypoxia, plotted as percentages in association with nucleus and cytoplasm. The data are presented as mean ± SD (n = 3 independent experiments). Significance was measured by two-way ANOVA. * p < 0.5, *** p < 0.001; (D) RT-PCR analysis of VEGF-AS1 expression in polyA depleted and polyA positive fractions in EA.hy926 cells. The data are representative of two independent experiments; (E) RT-PCR analysis of VEGF-AS2 expression in polyA depleted and polyA positive fractions in EA.hy926 cells. The data are representative of two independent experiments; (F) Over-expression of VEGF-AS1 and VEGF-AS2 in EA.hy926 cells 72 h after transfection relative to the pcDNA3.1-GFP control; (G) Fold change in VEGF-A expression in normoxic and hypoxic EA.hy926 cells 72 h after VEGF-AS1 and VEGF-AS2 transfections relative to the control pcDNA3.1-GFP as determined by qRT-PCR and standardized to B2M. The data are presented as mean ± SD (n = 3 independent experiments). Significance was measured by two-way ANOVA. * p < 0.05. NS, non-significant; RT, reverse transcription; NTC, no template control; Mw, molecular weight; GFP, green fluorescent protein.
Figure 2
Figure 2
Repression of VEGF-A promoter associated antisense lncRNAs results in the downregulation of VEGF-A expression. (A) Fold change in VEGF-AS1 and spliced or unspliced VEGF-A expression levels in normoxic EA.hy926 cells 48 h after antisense phosphorothioate oligonucleotides (PTO) transfections as determined by qRT-PCR and standardized to B2M. The data are presented as mean ± SD (n = 3 independent experiments). Significance was measured by two-way ANOVA. ** p < 0.01; (B) fold change in VEGF-AS1 and spliced or unspliced VEGF-A expression levels in hypoxic EA.hy926 cells 48 h after antisense PTO transfections as determined by qRT-PCR and standardized to B2M. The data are presented as mean ± SD (n = 3 independent experiments). Significance was measured by two-way ANOVA. * p < 0.05, *** p < 0.001, **** p < 0.0001; (C) Fold change in VEGF-AS2 and spliced or unspliced VEGF-A expression levels in normoxic EA.hy926 cells 48 h after antisense PTO transfections as determined by qRT-PCR and standardized to B2M. The data are presented as mean ± SD (n = 3 independent experiments). Significance was measured by two-way ANOVA. ** p < 0.01, *** p < 0.001; (D) Fold change in VEGF-AS2 and spliced or unspliced VEGF-A expression levels in hypoxic EA.hy926 cells 48h after antisense PTO transfections as determined by qRT-PCR and standardized to B2M. The data are presented as mean ± SD (n = 3 independent experiments). Significance was measured by two-way ANOVA. ** p < 0.01, **** p < 0.0001; (E) fold change in VEGF-AS2 and spliced or unspliced VEGF-A expression levels in normal and knockout (KO) EA.hy926 cells as determined by qRT-PCR and standardized to B2M. The data are presented as mean ± SD (n = 2 independent experiments). Significance was measured by two-way ANOVA. * p < 0.05, ** p < 0.01, *** p < 0.001; (F) Fold change in VEGF-AS2 and spliced or unspliced VEGF-A expression levels in KO EA.hy926 cells 72 h after VEGF-AS2 transfections relative to the control pcDNA3.1-GFP as determined by qRT-PCR and standardized to B2M. The data are presented as mean ± SD (n = 2 independent experiments). Significance was measured by two-way ANOVA. **** p < 0.0001; (G) fold change in VEGF-AS2 and spliced VEGF-A expression levels in EA.hy926 cells 48 h after transfections as determined by qRT-PCR and standardized to B2M. The data are presented as mean ± SD (n = 2 independent experiments). Significance was measured by two-way ANOVA. ** p < 0.01, *** p < 0.001; (H) Fold change in VEGF-S2 expression levels in normoxic and hypoxic EA.hy926 cells as determined by qRT-PCR and standardized to B2M. The data are presented as mean ± SD (n = 3 independent experiments). Significance was measured by two-tailed unpaired t test. ** p < 0.01; (I) Fold change in VEGF-S2 and unspliced VEGF-A expression levels in hypoxic EA.hy926 cells 48 h after antisense PTO transfections as determined by qRT-PCR and standardized to B2M. The data are presented as mean ± SD (n = 3 independent experiments). Significance was measured by two-way ANOVA. * p < 0.05, **** p < 0.0001.
Figure 3
Figure 3
Both VEGF-AS1 and VEGF-AS2 localize to the VEGF-A promoter. (A) Fold change in VEGF-AS1 target locus enrichment at the VEGF-A promoter in normoxic and hypoxic EA.hy926 cells as determined by quantitative polymerase chain reaction (qPCR) after pulldown with antisense oligonucleotides with 3′-Biotin modifications. Beads only control is set to be 1. The data are presented as mean ± SD and standardized to inputs (n = 3 independent experiments). Significance was measured by two-way ANOVA. * p < 0.05; (B) fold change in VEGF-AS2 target locus enrichment at the VEGF-A promoter in normoxic and hypoxic EA.hy926 cells as determined by qPCR after pulldown with antisense oligonucleotides with 3′-Biotin modifications. Beads only control is set to be 1. The data are presented as mean ± SD and standardized to inputs (n = 3 independent experiments). Significance was measured by two-way ANOVA. * p < 0.05; (C) primer walking at the VEGF-A promoter. A qPCR analysis of VEGF-AS1 localization at the VEGF-A promoter in EA.hy926 cells after pulldown with antisense oligonucleotides with 3′-Biotin modifications. The data are presented as mean ± SD and standardized to inputs (n = 2 independent experiments); (D) primer walking at the VEGF-A promoter. A qPCR analysis of VEGF-AS2 localization at the VEGF-A promoter in EA.hy926 cells after pulldown with antisense oligonucleotides with 3′-Biotin modifications. The data are presented as mean ± SD and standardized to inputs (n = 2 independent experiments); (E) RT-PCR analysis of VEGF-AS1 expression in hypoxic and normoxic EA.hy926 cells after pulldown with antisense oligonucleotides with 3′-Biotin modifications and treatments with RNase A and RNase H. The data are representative of three independent experiments; (F) RT-PCR analysis of VEGF-AS2 expression in hypoxic and normoxic EA.hy926 cells after pulldown with antisense oligonucleotides with 3′-Biotin modifications and treatments with RNase A and RNase H. The data are representative of three independent experiments.
Figure 4
Figure 4
Strong enhancer marks are associated with VEGF-AS1 and VEGF-AS2; (A) A qPCR analysis of H3K27ac and H3K9ac enrichment at the VEGF-AS1, VEGF-AS2 and off-target loci in normoxic and hypoxic EA.hy926 cells. IgG is used as a control. The data are presented as mean ± SD and standardized to inputs (n = 3 independent experiments). Significance was measured by two-way ANOVA. **** p < 0.0001; (B) A qRT-PCR analysis of H3K27ac and H3K9ac association with VEGF-AS1 in normoxic and hypoxic EA.hy926 cells. IgG is used as a control. The data are presented as mean ± SD and standardized to inputs (n = 3 independent experiments). Significance was measured by two-way ANOVA. * p < 0.05; (C) A qRT-PCR analysis of H3K27ac and H3K9ac association with VEGF-AS2 in normoxic and hypoxic EA.hy926 cells. IgG is used as a control. The data are presented as mean ± SD and standardized to inputs (n = 2–3 independent experiments); (D) the prediction of physical contacts between the VEGF-AS2 locus and the VEGF-A promoter in human umbilical vein endothelial cells (HUVECs). The figure was generated by using three-dimensional (3D) Genome Browser (http://biorxiv.org/content/early/2017/02/27/112268). The track around the VEGF-A gene loci was selected in 5 kilobase resolution in HUVECs with genome version HG19.

References

    1. Morris K.V., Mattick J.S. The rise of regulatory RNA. Nat. Rev. Genet. 2014;15:423–437. doi: 10.1038/nrg3722. - DOI - PMC - PubMed
    1. Weinberg M.S., Morris K.V. Transcriptional gene silencing in humans. Nucleic Acids Res. 2016;44:6505–6517. doi: 10.1093/nar/gkw139. - DOI - PMC - PubMed
    1. Morris K.V., Chan S.W., Jacobsen S.E., Looney D.J. Small interfering RNA-induced transcriptional gene silencing in human cells. Science. 2004;305:1289–1292. doi: 10.1126/science.1101372. - DOI - PubMed
    1. Li L.C., Okino S.T., Zhao H., Pookot D., Place R.F., Urakami S., Enokida H., Dahiya R. Small dsRNAs induce transcriptional activation in human cells. Proc. Natl. Acad. Sci. USA. 2006;103:17337–17342. doi: 10.1073/pnas.0607015103. - DOI - PMC - PubMed
    1. Turunen M.P., Lehtola T., Heinonen S.E., Assefa G.S., Korpisalo P., Girnary R., Glass C.K., Vaisanen S., Yla-Herttuala S. Efficient regulation of VEGF expression by promoter-targeted lentiviral shRNAs based on epigenetic mechanism: A novel example of epigenetherapy. Circ. Res. 2009;105:604–609. doi: 10.1161/CIRCRESAHA.109.200774. - DOI - PubMed