

Phenotypic and genetic variation in the response of chickens to Eimeria tenella induced coccidiosis
- PMID: 30463512
- PMCID: PMC6249784
- DOI: 10.1186/s12711-018-0433-7
Phenotypic and genetic variation in the response of chickens to Eimeria tenella induced coccidiosis
Abstract
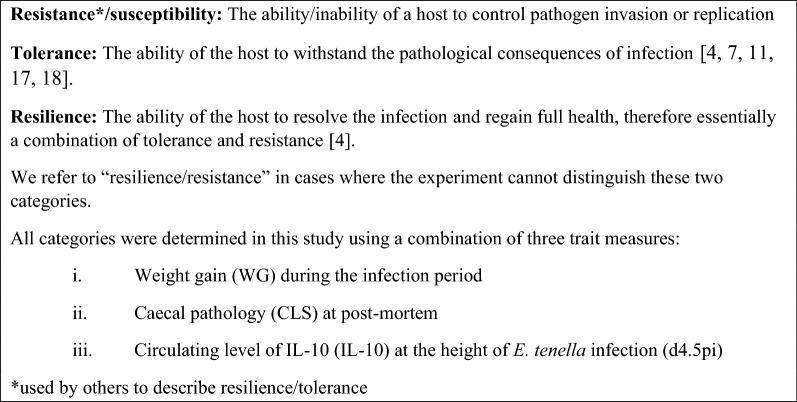
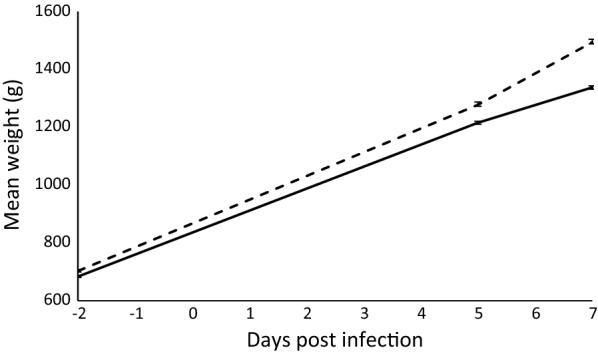
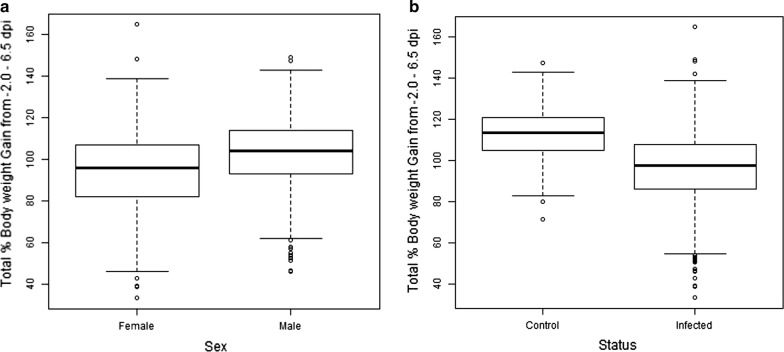
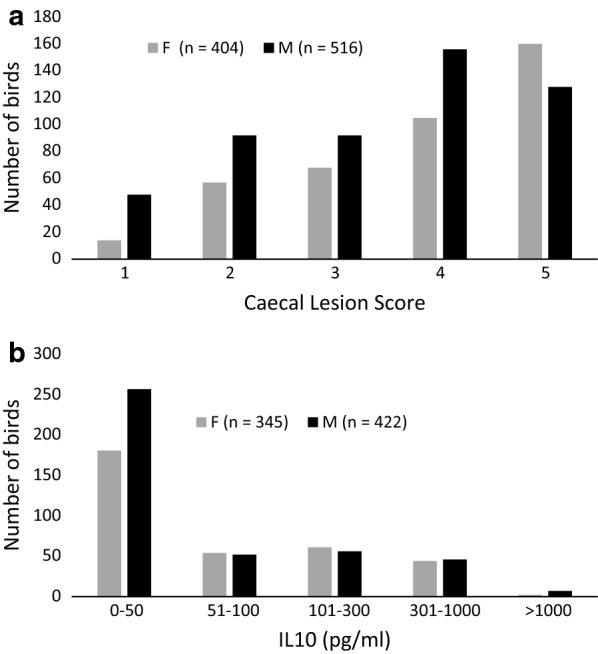
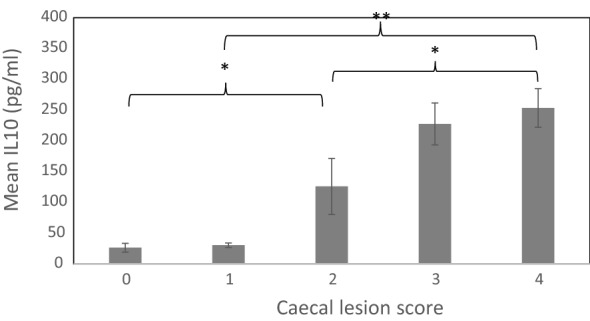
Background: Coccidiosis is a major contributor to losses in poultry production. With emerging constraints on the use of in-feed prophylactic anticoccidial drugs and the relatively high costs of effective vaccines, there are commercial incentives to breed chickens with greater resistance to this important production disease. To identify phenotypic biomarkers that are associated with the production impacts of coccidiosis, and to assess their covariance and heritability, 942 Cobb500 commercial broilers were subjected to a defined challenge with Eimeria tenella (Houghton). Three traits were measured: weight gain (WG) during the period of infection, caecal lesion score (CLS) post mortem, and the level of a serum biomarker of intestinal inflammation, i.e. circulating interleukin 10 (IL-10), measured at the height of the infection.
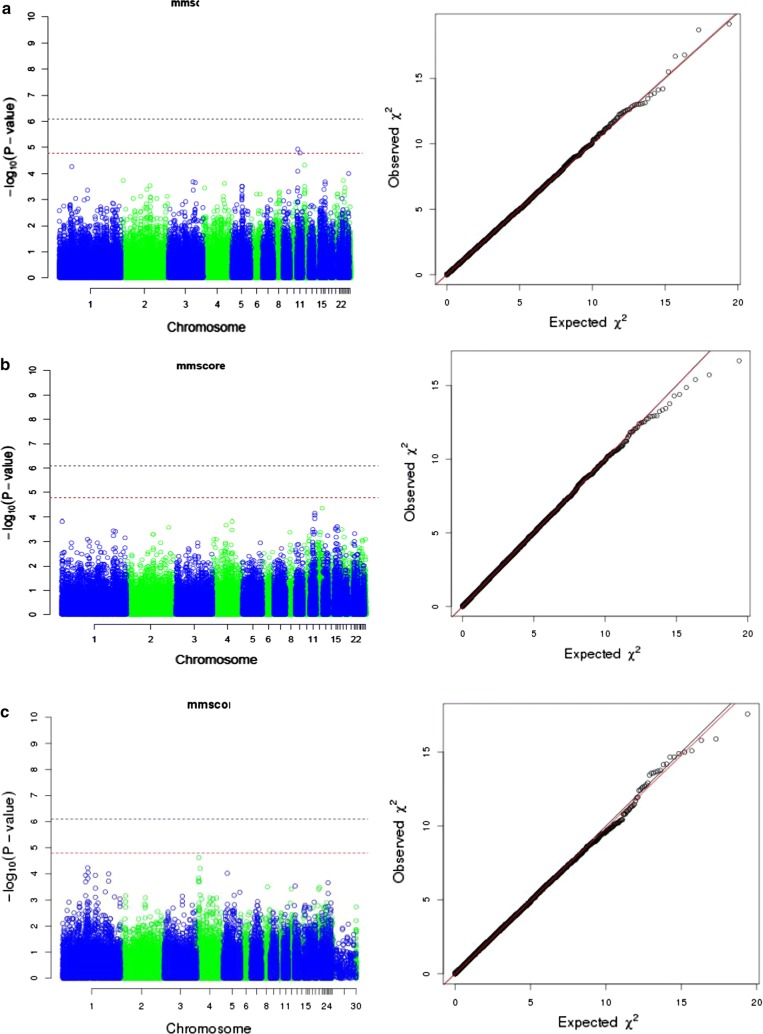
Results: Phenotypic analysis of the challenged chicken cohort revealed a significant positive correlation between CLS and IL-10, with significant negative correlations of both these traits with WG. Eigenanalysis of phenotypic covariances between measured traits revealed three distinct eigenvectors. Trait weightings of the first eigenvector, (EV1, eigenvalue = 59%), were biologically interpreted as representing a response of birds that were susceptible to infection, with low WG, high CLS and high IL-10. Similarly, the second eigenvector represented infection resilience/resistance (EV2, 22%; high WG, low CLS and high IL-10), and the third eigenvector tolerance (EV3, 19%; high WG, high CLS and low IL-10), respectively. Genome-wide association studies (GWAS) identified two SNPs that were associated with WG at the suggestive level.
Conclusions: Eigenanalysis separated the phenotypic impact of a defined challenge with E. tenella on WG, caecal inflammation/pathology, and production of IL-10 into three major eigenvectors, indicating that the susceptibility-resistance axis is not a single continuous quantitative trait. The SNPs identified by the GWAS for body weight were located in close proximity to two genes that are involved in innate immunity (FAM96B and RRAD).
Figures


References
MeSH terms
Substances
Grants and funding
LinkOut - more resources
Full Text Sources
