. 2018 Nov 21;19(1):228.
doi: 10.1186/s12931-018-0922-9.

Influence of viral infection on the relationships between airway cytokines and lung function in asthmatic children

Affiliations

Influence of viral infection on the relationships between airway cytokines and lung function in asthmatic children

Toby C Lewis et al. Respir Res. .

Abstract

Background: Few longitudinal studies examine inflammation and lung function in asthma. We sought to determine the cytokines that reduce airflow, and the influence of respiratory viral infections on these relationships.

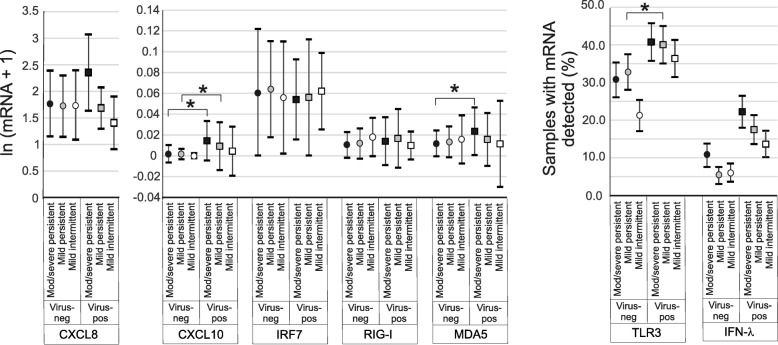
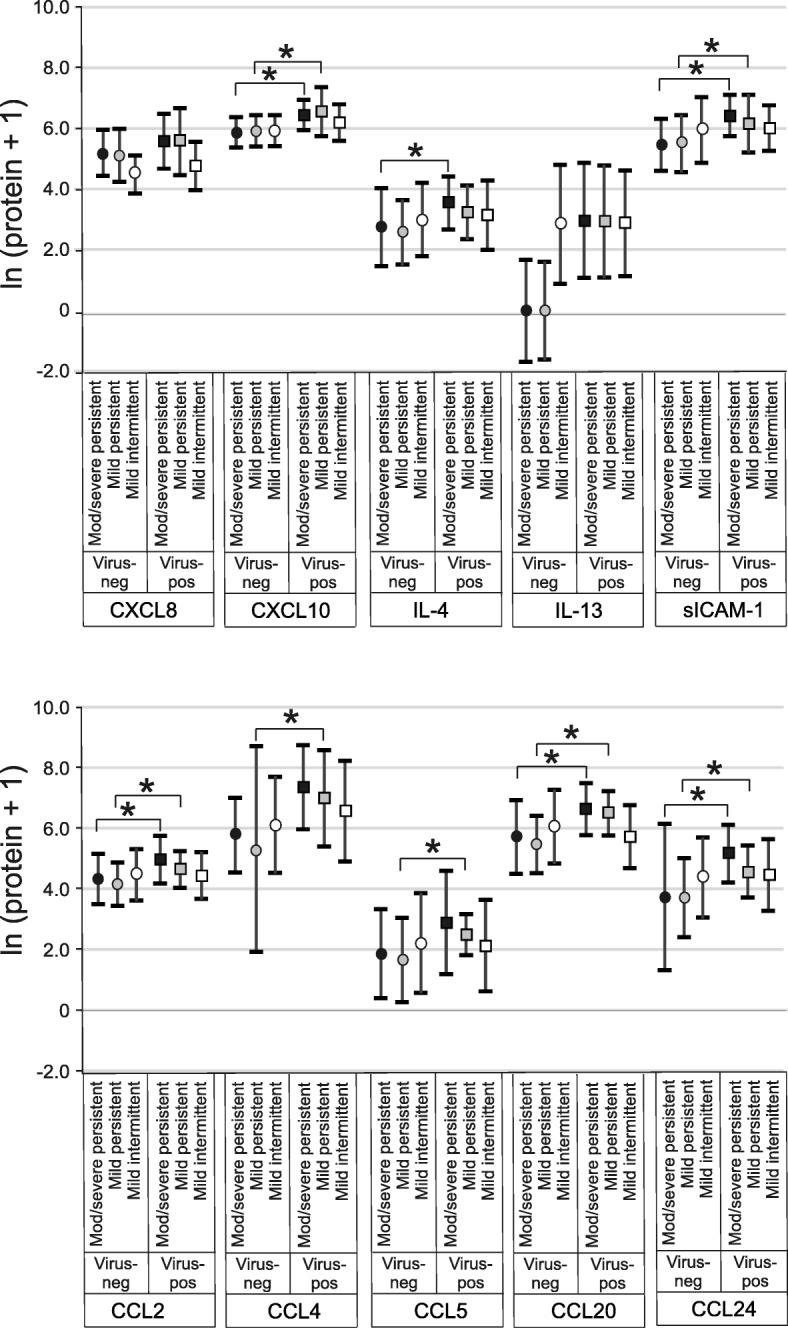
Methods: Children underwent home collections of nasal lavage during scheduled surveillance periods and self-reported respiratory illnesses. We studied 53 children for one year, analyzing 392 surveillance samples and 203 samples from 85 respiratory illnesses. Generalized estimated equations were used to evaluate associations between nasal lavage biomarkers (7 mRNAs, 10 proteins), lung function and viral infection.

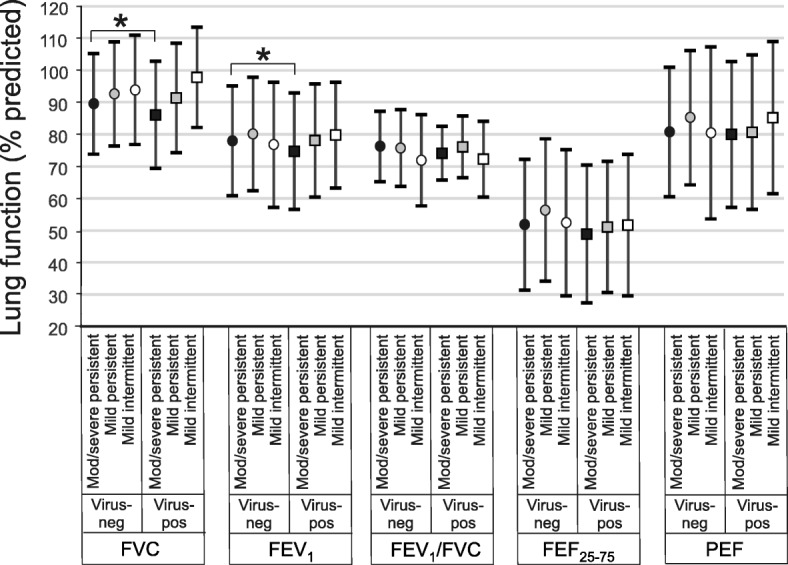
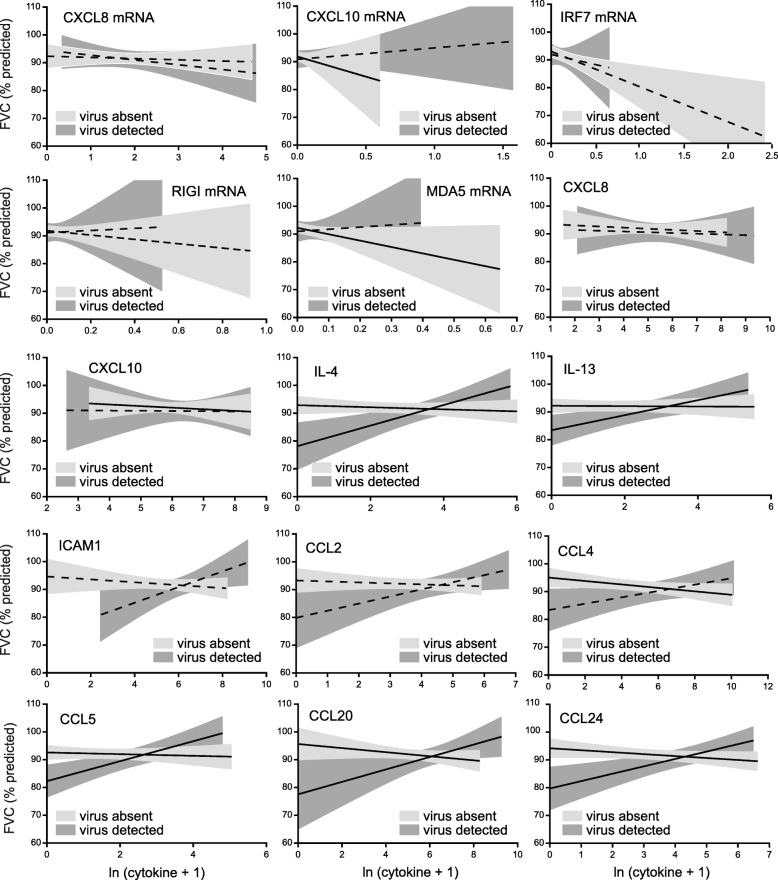
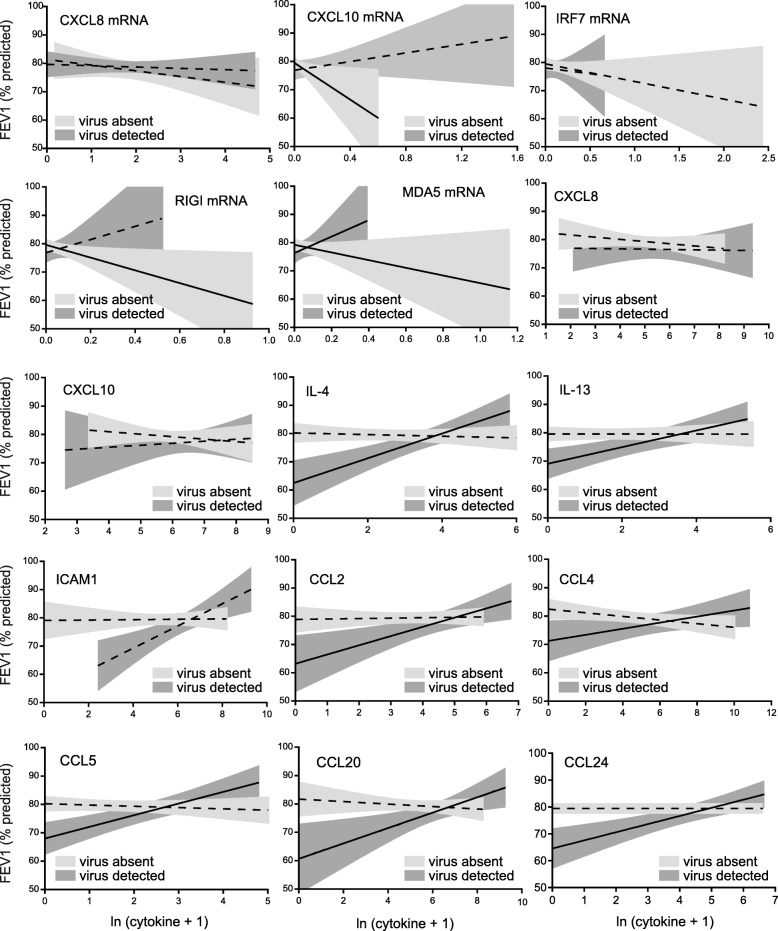
Results: As anticipated, viral infection was associated with increased cytokines and reduced FVC and FEV1. However, we found frequent and strong interactions between biomarkers and virus on lung function. For example, in the absence of viral infection, CXCL10 mRNA, MDA5 mRNA, CXCL10, IL-4, IL-13, CCL4, CCL5, CCL20 and CCL24 were negatively associated with FVC. In contrast, during infection, the opposite relationship was frequently found, with IL-4, IL-13, CCL5, CCL20 and CCL24 levels associated with less severe reductions in both FVC and FEV1.

Conclusions: In asthmatic children, airflow obstruction is driven by specific pro-inflammatory cytokines. In the absence of viral infection, higher cytokine levels are associated with decreasing lung function. However, with infection, there is a reversal in this relationship, with cytokine abundance associated with reduced lung function decline. While nasal samples may not reflect lower airway responses, these data suggest that some aspects of the inflammatory response may be protective against viral infection. This study may have ramifications for the treatment of viral-induced asthma exacerbations.

Keywords: Asthma; Chemokine; Children; Cytokine; FEV1; FVC; Rhinovirus; Urban; Viral.


Conflict of interest statement

Ethics approval and consent to participate

Research was performed in accordance with the Declaration of Helsinki (http://www.wma.net). Informed consent was obtained from parents or legal guardians. This study was approved by the University of Michigan Medical School Institutional Review Board (IRBMED) (ID# HUM00018442) and conducted according to CBPR principles under the auspices of the CAAA Steering Committee.

Consent for publication

Not applicable.

Competing interests

The authors declare that they have no competing interests.

Publisher’s Note

Springer Nature remains neutral with regard to jurisdictional claims in published maps and institutional affiliations.

Figures

Fig. 1
Fig. 1
Effect of viral infection on spirometry in subjects with moderate-to-severe persistent (black symbols), mild persistent (grey symbols) and mild intermittent asthma (white symbols). FVC, FEV1, FEF25–75 and PEF are shown (mean ± SD). GEE models were used for pairwise comparison of the means (*p < 0.05)
Fig. 2
Fig. 2
Effect of viral infection on nasal lavage mRNAs by asthma severity. mRNA expression was measured by qPCR and normalized by GAPDH. Medians ±IQR are shown. TLR3 and IFN-λ1 mRNA results were analyzed as binary variables (proportions and 95% confidence intervals are shown. Pairwise comparisons of medians were performed using the Wilcoxon Rank-Sum Test (red squares, moderate-to-severe persistent asthma; blue squares, mild persistent asthma; green squares, mild intermittent asthma; *p < 0.05, †0.05 < p < 0.10)
Fig. 3
Fig. 3
Effects of viral infection on nasal lavage cytokine concentrations by asthma severity (median ± IQR). Cytokines were measured by multiplex immune assay. Pairwise comparisons of medians were performed using the Wilcoxon Rank-Sum Test (black symbols, moderate-to-severe persistent asthma; grey symbols, mild persistent asthma; white symbols, mild intermittent asthma; *p < 0.05)
Fig. 4
Fig. 4
Effect of viral infection on the relationships between log-transformed nasal lavage biomarker levels and percent predicted FVC. In the absence of virus, we found negative associations between biomarker level and FVC (unadjusted 95% confidence intervals are shown in light grey, solid lines indicate a statistically significant association between cytokine and FVC by GEE; dashed lines indicate no statistically significant association). However, in the presence of virus, increasing levels of biomarker had a positive effect on FVC (unadjusted 95% confidence intervals are shown in dark grey; solid lines indicate a statistically significant association). For clarity individual data points are not shown here, but may be found in Additional file 2: Figure S1
Fig. 5
Fig. 5
Effect of viral infection on the relationships between log-transformed nasal lavage biomarker levels and percent predicted FEV1. In the absence of virus, we found negative associations between biomarker level and FEV1 (95% confidence intervals are shown in light grey, with solid lines indicating a significant association between cytokine and FEV1 by GEE; dashed lines indicate no statistically significant association). In the presence of virus, increasing levels of biomarker had a positive effect on FEV1 (95% confidence intervals are shown in dark grey; solid lines indicate a statistically significant association). For clarity individual data points are not shown here, but may be found in Additional file 3: Figure S2

Similar articles

Cited by

References

    1. Carr W, Zeitel L, Weiss K. Variations in asthma hospitalizations and deaths in New York City. Am J Public Health. 1992;82:59–65. doi: 10.2105/AJPH.82.1.59. - DOI - PMC - PubMed
    1. Gottlieb DJ, Beiser AS, O'Connor GT. Poverty, race, and medication use are correlates of asthma hospitalization rates. A small area analysis in Boston. Chest. 1995;108:28–35. doi: 10.1378/chest.108.1.28. - DOI - PubMed
    1. Akinbami LJ, Moorman JE, Liu X. Asthma prevalence, health care use, and mortality: United States, 2005-2009. Natl Health Stat Report. 2011;12:1–14. - PubMed
    1. Rosenstreich DL, Eggleston P, Kattan M, Baker D, Slavin RG, Gergen P, Mitchell H, McNiff-Mortimer K, Lynn H, Ownby D, Malveaux F. The role of cockroach allergy and exposure to cockroach allergen in causing morbidity among inner-city children with asthma. N Engl J Med. 1997;336:1356–1363. doi: 10.1056/NEJM199705083361904. - DOI - PubMed
    1. Eggleston PA, Malveaux FJ, Butz AM, Huss K, Thompson L, Kolodner K, Rand CS. Medications used by children with asthma living in the inner city. Pediatrics. 1998;101:349–354. doi: 10.1542/peds.101.3.349. - DOI - PubMed