

Maternal Eed knockout causes loss of H3K27me3 imprinting and random X inactivation in the extraembryonic cells
- PMID: 30463900
- PMCID: PMC6295166
- DOI: 10.1101/gad.318675.118
Maternal Eed knockout causes loss of H3K27me3 imprinting and random X inactivation in the extraembryonic cells
Abstract
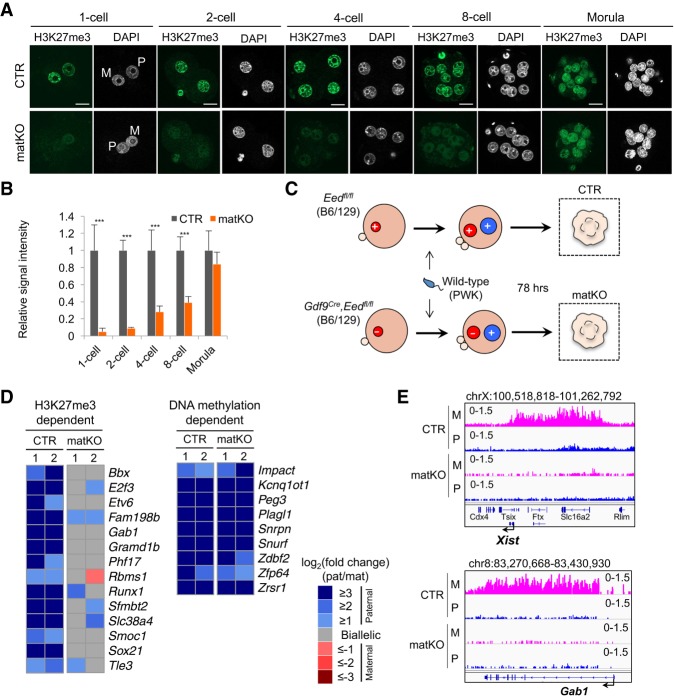
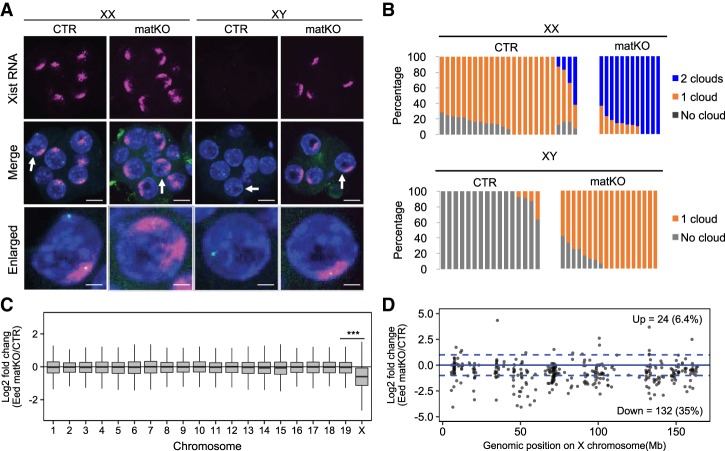
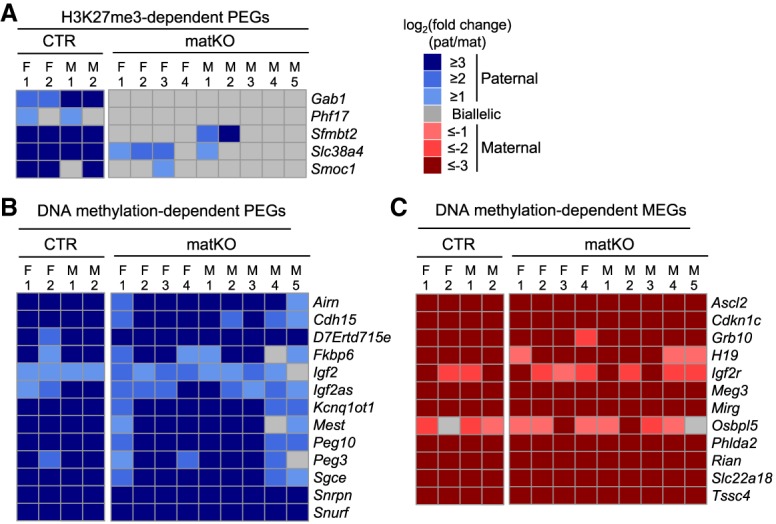
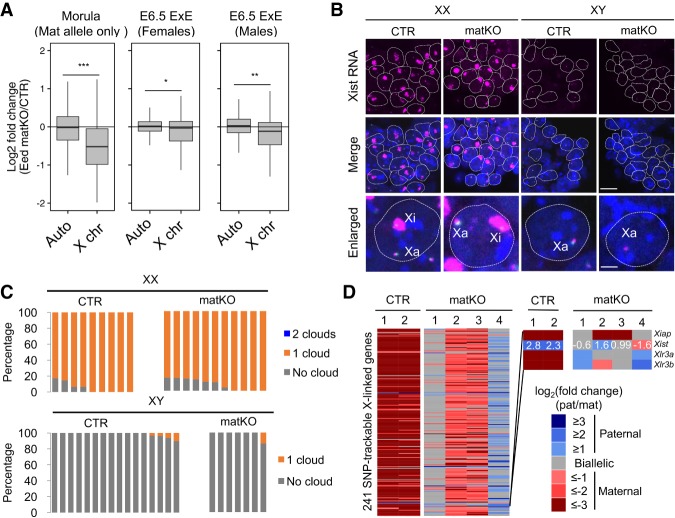
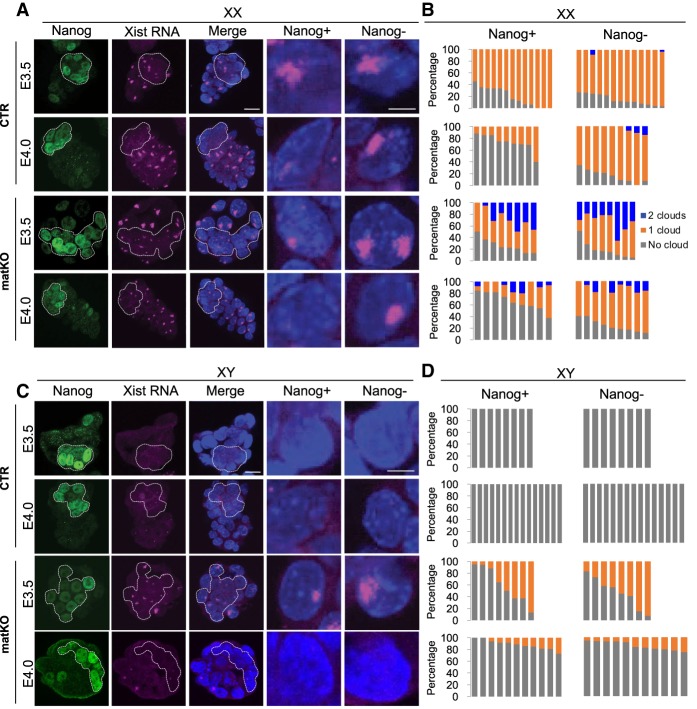
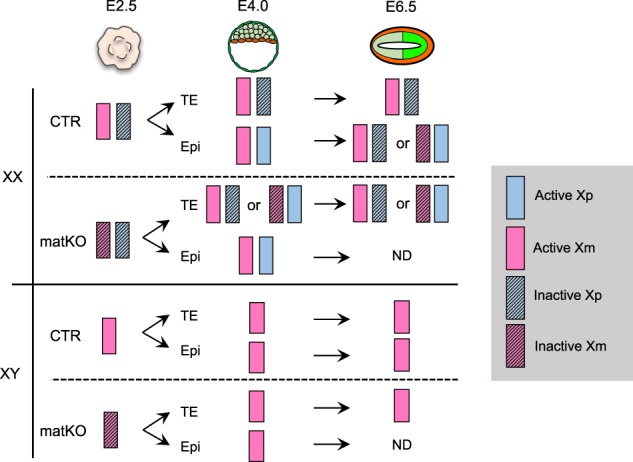
Genomic imprinting is essential for mammalian development. Recent studies have revealed that maternal histone H3 Lys27 trimethylation (H3K27me3) can mediate DNA methylation-independent genomic imprinting. However, the regulatory mechanisms and functions of this new imprinting mechanism are largely unknown. Here we demonstrate that maternal Eed, an essential component of the Polycomb group complex 2 (PRC2), is required for establishing H3K27me3 imprinting. We found that all H3K27me3-imprinted genes, including Xist, lose their imprinted expression in Eed maternal knockout (matKO) embryos, resulting in male-biased lethality. Surprisingly, although maternal X-chromosome inactivation (XmCI) occurs in Eed matKO embryos at preimplantation due to loss of Xist imprinting, it is resolved at peri-implantation. Ultimately, both X chromosomes are reactivated in the embryonic cell lineage prior to random XCI, and only a single X chromosome undergoes random XCI in the extraembryonic cell lineage. Thus, our study not only demonstrates an essential role of Eed in H3K27me3 imprinting establishment but also reveals a unique XCI dynamic in the absence of Xist imprinting.
Keywords: H3K27me3; Polycomb; X chromosome inactivation; genomic imprinting; mouse early development.
© 2018 Inoue et al.; Published by Cold Spring Harbor Laboratory Press.
Figures
Similar articles
-
Genomic imprinting of Xist by maternal H3K27me3.Genes Dev. 2017 Oct 1;31(19):1927-1932. doi: 10.1101/gad.304113.117. Genes Dev. 2017. PMID: 29089420 Free PMC article.
-
PRC2 represses transcribed genes on the imprinted inactive X chromosome in mice.Genome Biol. 2017 May 3;18(1):82. doi: 10.1186/s13059-017-1211-5. Genome Biol. 2017. PMID: 28468635 Free PMC article.
-
Noncanonical imprinting sustains embryonic development and restrains placental overgrowth.Genes Dev. 2022 Apr 1;36(7-8):483-494. doi: 10.1101/gad.349390.122. Epub 2022 Apr 28. Genes Dev. 2022. PMID: 35483741 Free PMC article.
-
Maternal H3K27me3-dependent autosomal and X chromosome imprinting.Nat Rev Genet. 2020 Sep;21(9):555-571. doi: 10.1038/s41576-020-0245-9. Epub 2020 Jun 8. Nat Rev Genet. 2020. PMID: 32514155 Free PMC article. Review.
-
There is another: H3K27me3-mediated genomic imprinting.Trends Genet. 2022 Jan;38(1):82-96. doi: 10.1016/j.tig.2021.06.017. Epub 2021 Jul 22. Trends Genet. 2022. PMID: 34304914 Review.
Cited by
-
Antagonism between H3K27me3 and genome-lamina association drives atypical spatial genome organization in the totipotent embryo.Nat Genet. 2024 Oct;56(10):2228-2237. doi: 10.1038/s41588-024-01902-8. Epub 2024 Sep 16. Nat Genet. 2024. PMID: 39284976 Free PMC article.
-
Maternal-biased H3K27me3 correlates with paternal-specific gene expression in the human morula.Genes Dev. 2019 Apr 1;33(7-8):382-387. doi: 10.1101/gad.323105.118. Epub 2019 Feb 26. Genes Dev. 2019. PMID: 30808660 Free PMC article.
-
KDM6A facilitates Xist upregulation at the onset of X inactivation.Biol Sex Differ. 2025 Jan 3;16(1):1. doi: 10.1186/s13293-024-00683-3. Biol Sex Differ. 2025. PMID: 39754175 Free PMC article.
-
Polycomb function in early mouse development.Cell Death Differ. 2025 Jan;32(1):90-99. doi: 10.1038/s41418-024-01340-3. Epub 2024 Jul 12. Cell Death Differ. 2025. PMID: 38997437 Review.
-
H2A.Z reinforces maternal H3K4me3 formation and is essential for meiotic progression in mouse oocytes.Nat Struct Mol Biol. 2025 Jun 13. doi: 10.1038/s41594-025-01573-x. Online ahead of print. Nat Struct Mol Biol. 2025. PMID: 40514539
References
-
- Borensztein M, Okamoto I, Syx L, Guilbaud G, Picard C, Ancelin K, Galupa R, Diabangouaya P, Servant N, Barillot E, et al. 2017a. Contribution of epigenetic landscapes and transcription factors to X-chromosome reactivation in the inner cell mass. Nat Commun 8: 1297 10.1038/s41467-017-01415-5 - DOI - PMC - PubMed
Publication types
MeSH terms
Substances
Grants and funding
LinkOut - more resources
Full Text Sources
Molecular Biology Databases