. 2018 Dec 1;32(23-24):1499-1513.
doi: 10.1101/gad.318485.118. Epub 2018 Nov 21.

Adaptation to DNA damage checkpoint in senescent telomerase-negative cells promotes genome instability

Affiliations

Adaptation to DNA damage checkpoint in senescent telomerase-negative cells promotes genome instability

Héloïse Coutelier et al. Genes Dev. .

Erratum in

Abstract

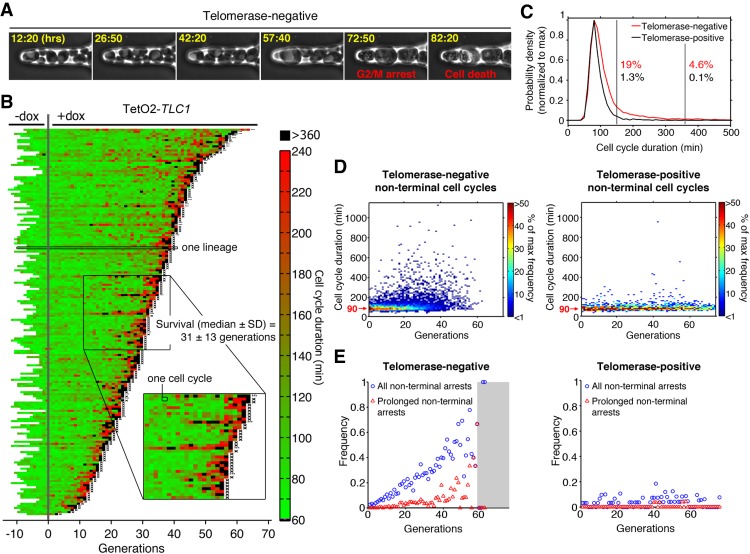
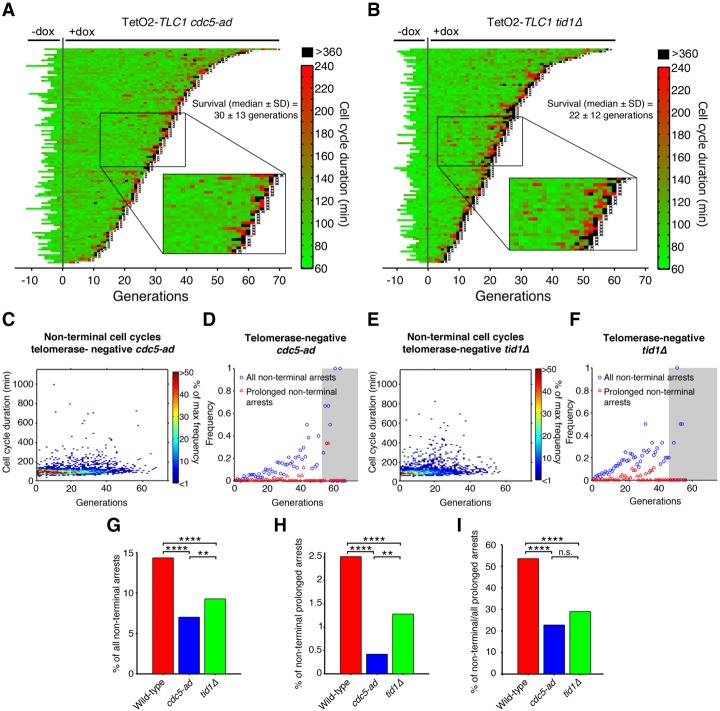
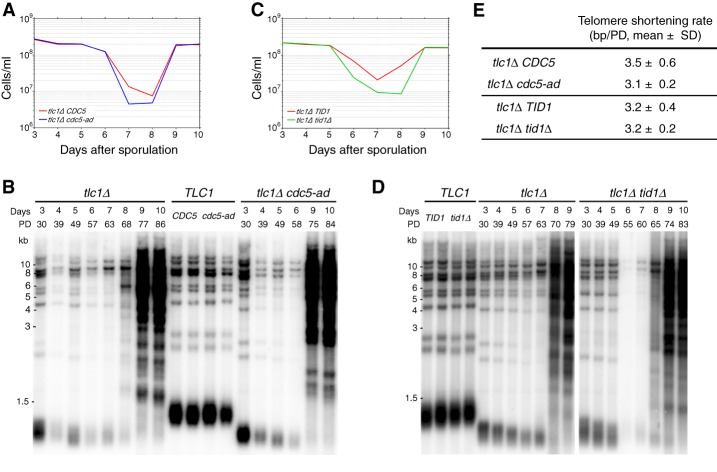
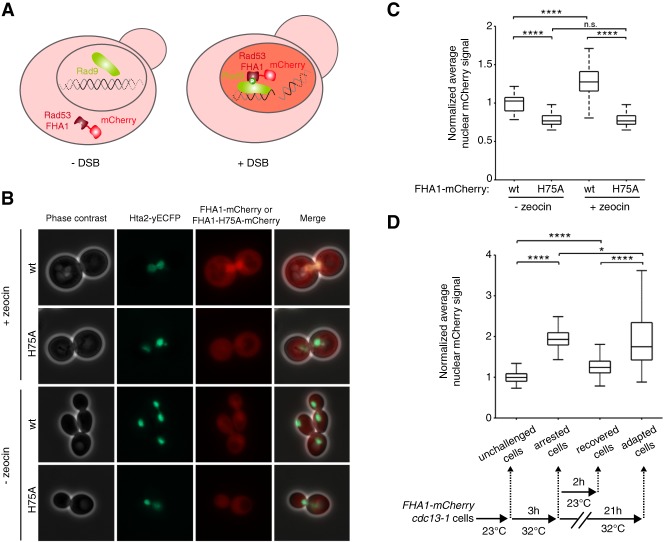
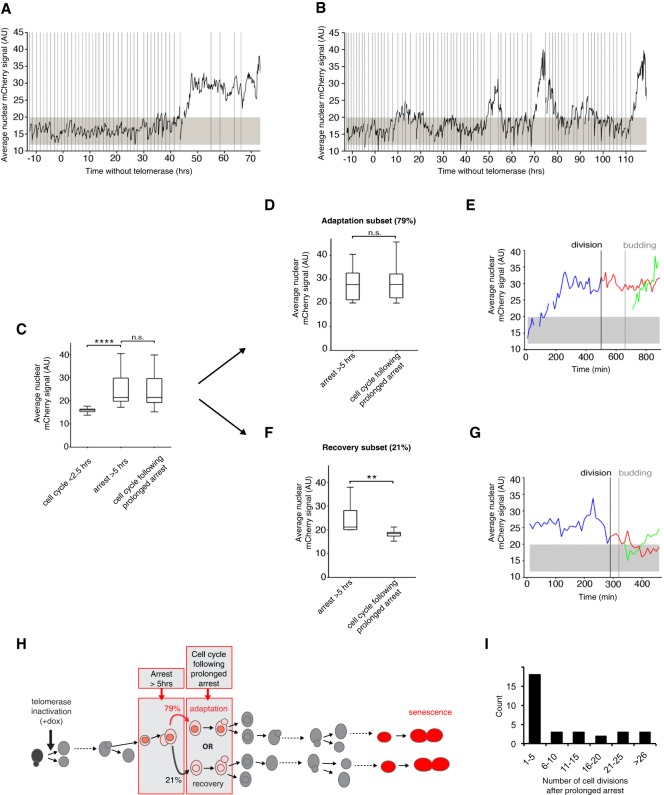
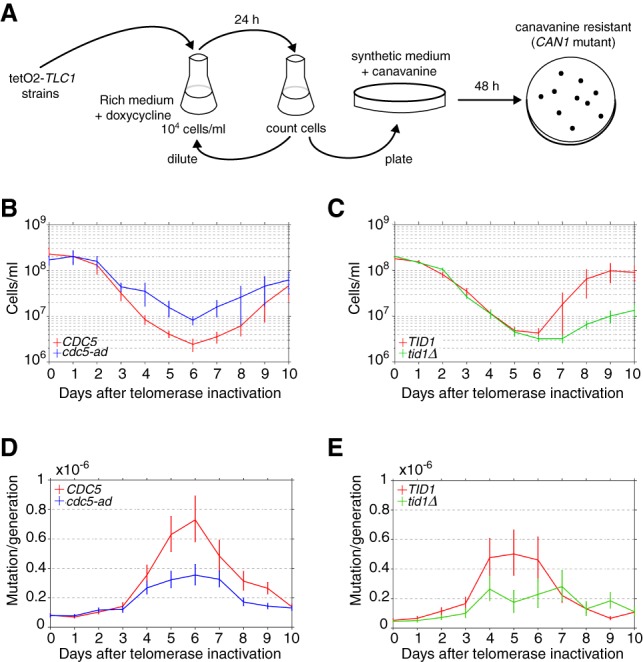
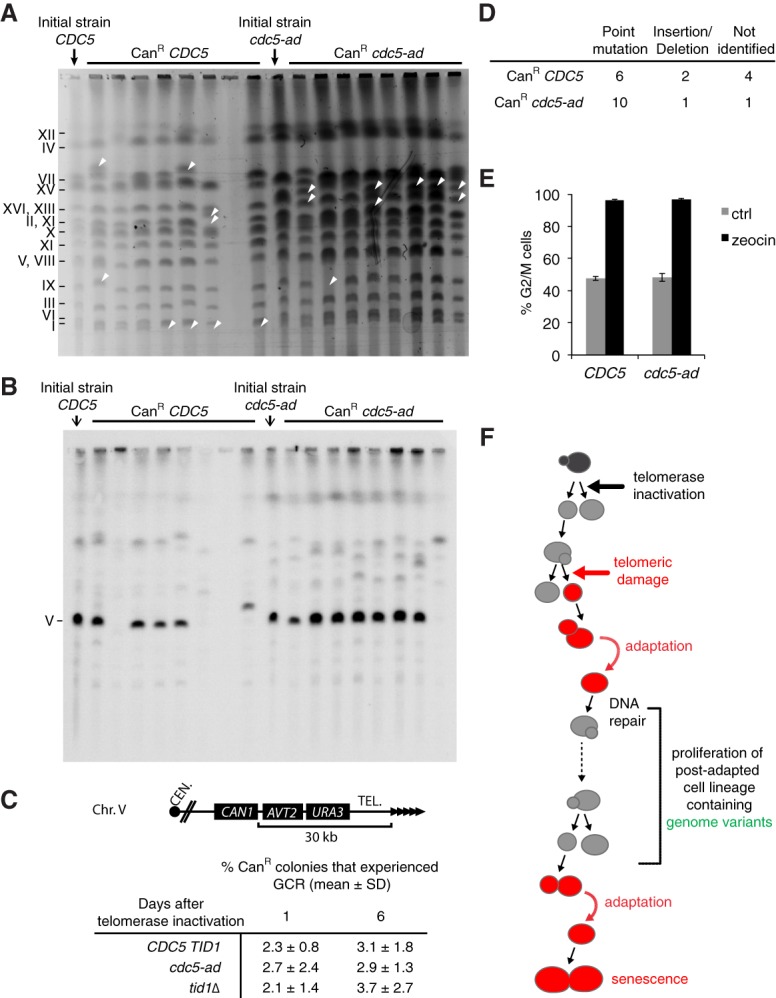
In cells lacking telomerase, telomeres gradually shorten during each cell division to reach a critically short length, permanently activate the DNA damage checkpoint, and trigger replicative senescence. The increase in genome instability that occurs as a consequence may contribute to the early steps of tumorigenesis. However, because of the low frequency of mutations and the heterogeneity of telomere-induced senescence, the timing and mechanisms of genome instability increase remain elusive. Here, to capture early mutation events during replicative senescence, we used a combined microfluidic-based approach and live-cell imaging in yeast. We analyzed DNA damage checkpoint activation in consecutive cell divisions of individual cell lineages in telomerase-negative yeast cells and observed that prolonged checkpoint arrests occurred frequently in telomerase-negative lineages. Cells relied on the adaptation to the DNA damage pathway to bypass the prolonged checkpoint arrests, allowing further cell divisions despite the presence of unrepaired DNA damage. We demonstrate that the adaptation pathway is a major contributor to the genome instability induced during replicative senescence. Therefore, adaptation plays a critical role in shaping the dynamics of genome instability during replicative senescence.

Keywords: Cdc5; DNA damage checkpoint; adaptation; genomic instability; senescence; telomere.


Figures

Figure 1.
Figure 1.
Analysis of individual telomerase-deficient lineages reveals frequent prolonged nonterminal arrests. (A) Sequential images of telomerase-negative (TetO2-TLC1) cells trapped in a microcavity of the microfluidic device. Hours spent after addition of 30 µg/mL dox to repress telomerase activity are shown in yellow. (B) Display of consecutive cell cycle durations of TetO2-TLC1 lineages grown in the microfluidic device as in A (n = 187, 40 of which were already published in our previous work) (Xu et al. 2015). Cells were monitored overnight before (−dox) and then for successive generations after (+dox) addition of 30 µg/mL dox to inactivate telomerase (designated generation 0). Each horizontal line is an individual cell lineage, and each segment is a cell cycle. Cell cycle duration (in minutes) is indicated by the color bar. X at the end of the lineage indicates cell death, whereas an ellipsis (…) indicates that the cell was alive at the end of the experiment. (Inset) Magnified view of several lineages showing nonterminal arrests (black). (C) Distribution of all cell cycle durations taken from telomerase-negative (red; n = 5962) and telomerase-positive (black; n = 1895) lineages shown in B and Supplemental Figure S1. Percentages indicate the fraction of cell cycles >150 min (first vertical black line) or >360 min (second vertical black line) for each lineage. (D) Distribution of nonterminal cell cycle durations as a function of generation for telomerase-negative (left; n = 5775) and telomerase-positive (right, n = 1887) cells extracted from B and Supplemental Figure S1. The color bar indicates the frequency. (E) Frequency of all nonterminal arrests (cell cycle >150 min; blue circles) and prolonged nonterminal arrests (cell cycle >360 min; red triangles) extracted from B and Supplemental Figure S1 as a function of generation for telomerase-negative (left) and telomerase-positive (right) lineages. The gray-shaded area encompasses points based on less than five lineages, for which the data may be less reliable. See also Supplemental Figure S1.
Figure 2.
Figure 2.
Adaptation-deficient mutants display a reduced frequency of prolonged nonterminal arrests. (A,B) Display of TetO2-TLC1 cdc5-ad (A; n = 116) and tid1Δ (B; n = 103) lineages before and after dox addition. See Figure 1B for a description of the plot features. (C,E) Distribution of nonterminal cell cycle durations as a function of generation for telomerase-negative cdc5-ad (C, n = 2397) and tid1Δ (E, n = 999) cells, as extracted from experiment shown in A and B, respectively. The color bar indicates the frequency. (D,F) Frequency of all nonterminal arrests (cell cycle >150 min; blue circles) and prolonged nonterminal arrests (cell cycle >360 min; red triangles) as a function of generation for telomerase-negative cdc5-ad (D) and tid1Δ (F) cells, as extracted from experiments shown in A and B, respectively. The gray-shaded area encompasses points based on less than five lineages, for which the data may be less reliable. (GI) Percentage of nonterminal arrests (G) and prolonged nonterminal arrests (H) and the ratio of nonterminal to all prolonged (nonterminal + terminal) arrests (I) over all cell cycles for telomerase-negative lineages of the indicated genotypes (wild type: TetO2-TLC1), as extracted from experiment shown in A and B and Figure 1B. (n.s.) Not significant; (**) P < 0.01; (****) P < 0.0001 by χ2 goodness of fit test. See also Supplemental Figure S2.
Figure 3.
Figure 3.
Adaptation does not affect telomere length or its regulation. (A) Growth of tlc1Δ CDC5 and tlc1Δ cdc5-ad cells selected after sporulation of a heterozygous TLC1/tlc1Δ CDC5/cdc5-ad diploid strain. After dissection, spores were grown on plates for 2 d, genotyped, and transferred to liquid culture (indicated as day 3). Cells were sampled daily and normalized to the same density (OD600 nm = 0.01). (B) XhoI terminal restriction fragment Southern blot analysis of telomere lengths in the cells described in A. (PD) Population doublings. (C,D) As described for A and B except that TLC1/tlc1Δ TID1/tid1Δ heterozygotes were allowed to sporulate, and the growth rates and telomere lengths of tlc1Δ TID1 and tlc1Δ tid1Δ genotypes were analyzed. (E) Mean telomere shortening rates (base pair/population doubling [bp/PD]) of the genotypes analyzed in AD over days 3–5. Mean ± SD of n = 3 independent experiments per genotype. See also Supplemental Figure S3.
Figure 4.
Figure 4.
Detection of DNA damage checkpoint activation with a fluorescent biosensor. (A) Schematic showing the mCherry-coupled Rad53-FHA1 fluorescent protein interacting with phosphorylated Rad9 in the nucleus in response to a DSB. (B) Representative phase contrast and fluorescence images of cells carrying the nuclear marker Hta2-yECFP and either the wild-type FHA1-mCherry (wt) or a mutant version that cannot bind to phosphorylated Rad9 (FHA1-H75A-mCherry). Cells were imaged 3.5 h after treatment with 300 µg/mL zeocin or nontreated. (C) Quantification of the experiment in B. Data are presented as the nuclear mCherry signal normalized to the untreated cells carrying wild-type FHA1-mCherry. N ≥ 50 untreated cells; N ≥ 160 zeocin-treated cells. (****) P < 0.0001; (n.s.) not significant by the Mann-Whitney U-test. (D, bottom panel) The experimental scheme: cdc13-1 cells carrying the FHA1-mCherry reporter were grown at 23°C (“unchallenged cells”) and then placed for 3 h at the restrictive temperature of 32°C (“arrested cells”). The cells were then split into two cultures: One was incubated for 2 h at 23°C (“recovered cells”), and the other was incubated for an additional 21 h at 32°C (“adapted cells”). (Top panel) Quantification of nuclear mCherry fluorescence normalized to the unchallenged cells. N = 279 unchallenged cells; N = 191 arrested cells; N = 255 recovered cells; N = 59 adapted cells. (*) P < 0.05; (****) P < 0.0001 by the Mann-Whitney U-test. See also Supplemental Figure S4.
Figure 5.
Figure 5.
A novel checkpoint activation reporter reveals adaptation events at the single-cell level in telomerase-negative lineages. (A,B) Average nuclear FHA1-mCherry signal in representative telomerase-negative lineages monitored over the course of senescence shown in Supplemental Figure S5A. Vertical lines represent budding events. The gray-shaded area represents the basal nuclear FHA1-mCherry signal in normally dividing cells ± 3 SD. (C) Average nuclear FHA1-mCherry signal per cell cycle quantified in telomerase-negative single cells with normal cell cycle durations (<2.5 h; n = 31 cell cycles), cell cycles showing prolonged arrest (>5 h, n = 32 cell cycles) (see Supplemental Fig. S5B, indicated by white arrows in Supplemental Fig. S5A), and the first cell cycle immediately following prolonged arrest (n = 64 cell cycles) (see Supplemental Fig. S5B). Data were taken from the experiment shown in Supplemental Figure S5A. (****) P < 0.0001; (n.s.) not significant by the Mann-Whitney U test. (D,F) The analysis in C was further divided into two subsets: adaptation (D; n = 38 pairs of two consecutive cell cycles) and recovery (F; n = 10 pairs of two consecutive cell cycles); only cells arrested for >5 h and displaying increased mCherry signal were included in this analysis, thus excluding 16 out of the 64 prolonged arrests from further analysis (Supplemental Fig. S5B). Adaptation and recovery are defined as a high nuclear mCherry signal that is maintained (adaptation; D) or decreases to a basal level (recovery; F) in the cell cycle immediately following prolonged arrest. (**) P < 0.01; (n.s.) not significant by the Mann-Whitney U-test. (E,G) Representative plots of the average nuclear FHA1-mCherry signal showing an adaptation (E) and a recovery (G) event. Blue lines show the prolonged arrest (>5 h) followed by cell division, budding, and the second cell cycle of the resulting mother (red) and daughter (green) cells. The gray-shaded area represents the average basal reporter signal during normal cell cycles, and the vertical lines indicate cytokinesis and budding. (H) Schematic summarizing the behavior of the FHA1-mCherry reporter during an arrest >5 h, the immediate following cell cycle, and its interpretation into adaptation (79% of the events) or recovery (21% of the events), as plotted in DG. These particular cell cycles are placed in the context of cell lineages from telomerase inactivation to senescence (red cells). A red nucleus indicates that the nuclear signal of FHA1-mCherry fusion protein is above background as in Figure 4A. See also Supplemental Figure S5. (I) Distribution of the number of cell divisions after prolonged arrest. n = 32.
Figure 6.
Figure 6.
Adaptation contributes to the increased mutation rate observed in senescence. (A) Experimental protocol for the fluctuation assay of CAN1 gene mutation during senescence. Cells were grown in liquid YPD medium and 30 µg/mL dox for 10 d. Cells were counted and diluted daily to ensure that CanR mutants were not transferred from the previous culture. A sample of cells was plated on canavanine-containing medium lacking arginine or on YPD plates (for normalization). The colonies formed after 2 d at 30°C were counted, and the mutation rate was calculated. (B,C) Average growth curves of 20 independent cultures of telomerase-inactivated CDC5 and cdc5-ad strains (B) and 10 independent cultures of telomerase-inactivated TID1 and tid1Δ strains (C). Data are presented as the means ± SD. (D,E) Rates of CAN1 gene mutation in the cultures shown in B and C, respectively. Data are presented as the mutation rate ±95% confidence interval. See also Supplemental Figure S6.
Figure 7.
Figure 7.
Adaptation drives genome instability in senescence. (A) Chromosomes of CanR colonies of the indicated genotypes were separated by PFGE and visualized by ethidium bromide staining. Arrows illustrate rearranged chromosomes. (B) Southern blot of the PFGE shown in A hybridized with a probe against the essential gene PCM1 on chromosome 5. (C) Fraction of the CanR colonies that grew on plates containing both canavanine and 5-fluoroorotic acid (5-FOA), selecting for loss of CAN1 and URA3 functions, events that were previously characterized as GCRs (Chen and Kolodner 1999). The percentages were derived from n > 2500 CanR colonies for each genotype and day and from N = 5–6 independent cultures per genotype. (Top panel) A scheme of the region bearing the CAN1 and URA3 reporter genes is shown. (D) Types of mutations found by sequencing the CAN1 gene of CanR colonies. (E) CanR colonies of the indicated genotypes were tested for the ability to arrest in G2/M following exposure to 300 µg/mL zeocin for 3.5 h. Data are presented as the means ± SD. (F) Model for the emergence of checkpoint activation-proficient adapted cells with persistent DNA damage. Upon telomerase inactivation, the DNA damage checkpoint is activated in response to telomere replication defects or telomere shortening (red cells), which interrupts cell proliferation and results in their progressive dilution in the population. Even if DNA repair fails, the cells may undergo adaptation by bypassing downstream checkpoint signaling. The proliferation capacity of these lineages is thus extended despite the persistence of the initial damage or repair intermediates. Some genome variants may arise that result in viable progeny. See also Supplemental Figure S7.

Similar articles

Cited by

References

    1. Artandi SE, DePinho RA. 2000. A critical role for telomeres in suppressing and facilitating carcinogenesis. Curr Opin Genet Dev 10: 39–46. - PubMed
    1. Artandi SE, DePinho RA. 2010. Telomeres and telomerase in cancer. Carcinogenesis 31: 9–18. - PMC - PubMed
    1. Aunan JR, Cho WC, Soreide K. 2017. The biology of aging and cancer: a brief overview of shared and divergent molecular hallmarks. Aging Dis 8: 628–642. - PMC - PubMed
    1. Batte A, Brocas C, Bordelet H, Hocher A, Ruault M, Adjiri A, Taddei A, Dubrana K. 2017. Recombination at subtelomeres is regulated by physical distance, double-strand break resection and chromatin status. EMBO J 36: 2609–2625. - PMC - PubMed
    1. Beyer T, Weinert T. 2016. Ontogeny of unstable chromosomes generated by telomere error in budding yeast. PLoS Genet 12: e1006345. - PMC - PubMed

Publication types

MeSH terms

LinkOut - more resources