. 2018 Nov 21;10(468):eaat0344.
doi: 10.1126/scitranslmed.aat0344.

Hepatocyte Notch activation induces liver fibrosis in nonalcoholic steatohepatitis

Affiliations

Hepatocyte Notch activation induces liver fibrosis in nonalcoholic steatohepatitis

Changyu Zhu et al. Sci Transl Med. .

Abstract

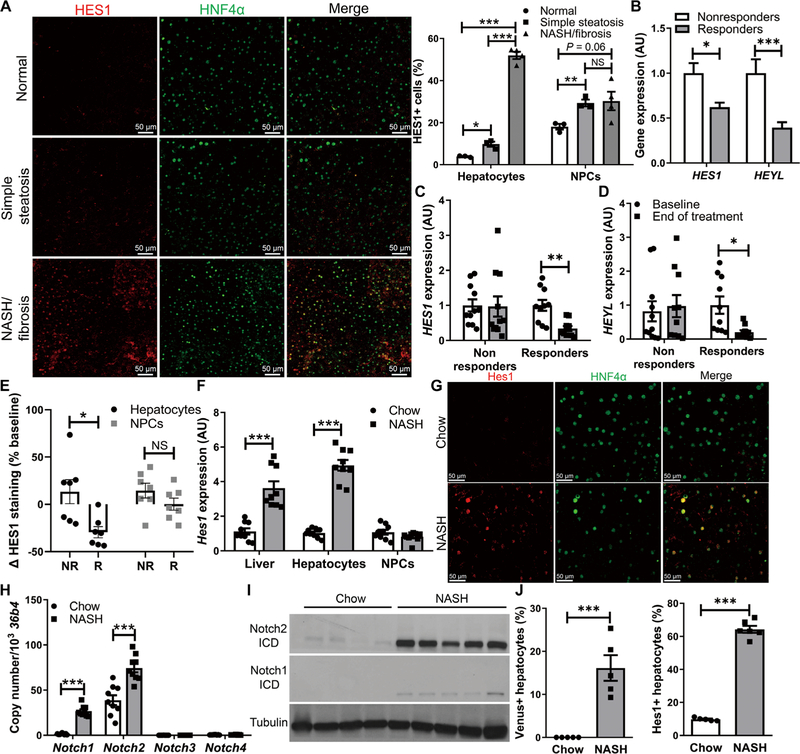
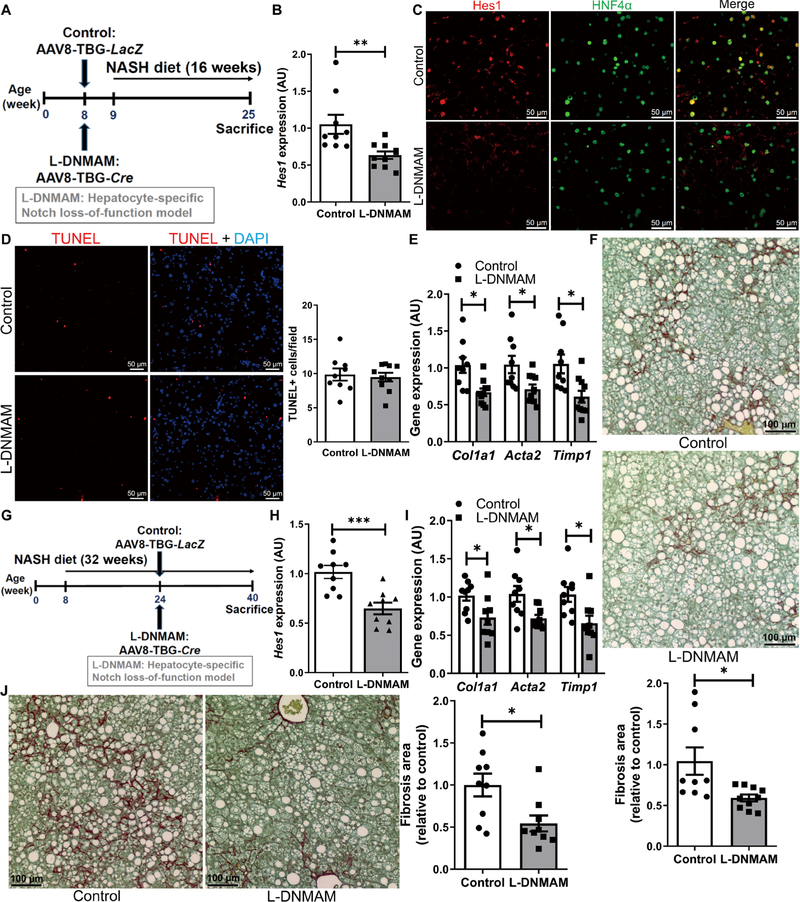
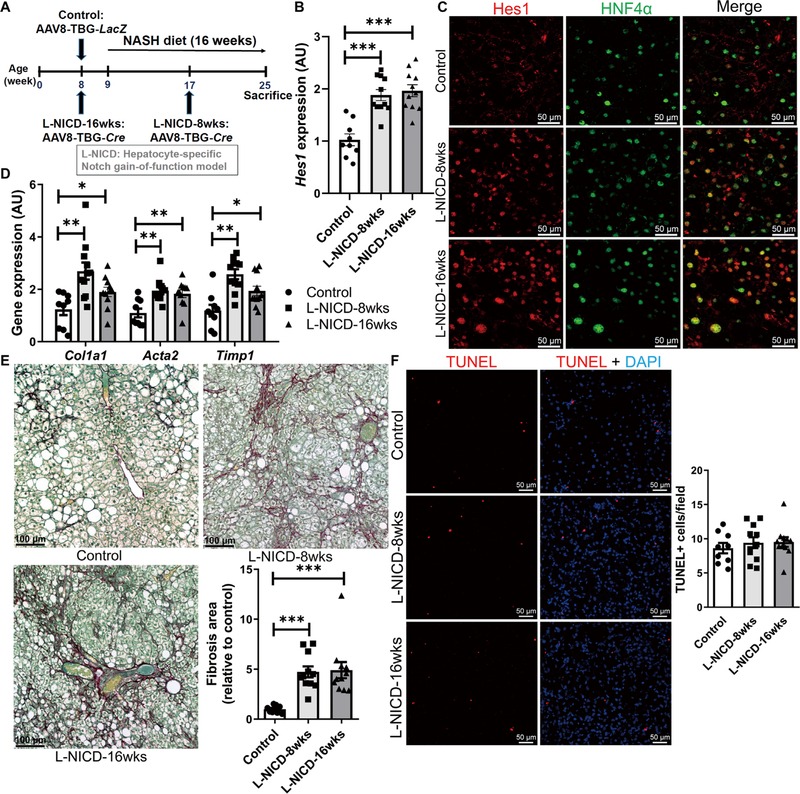
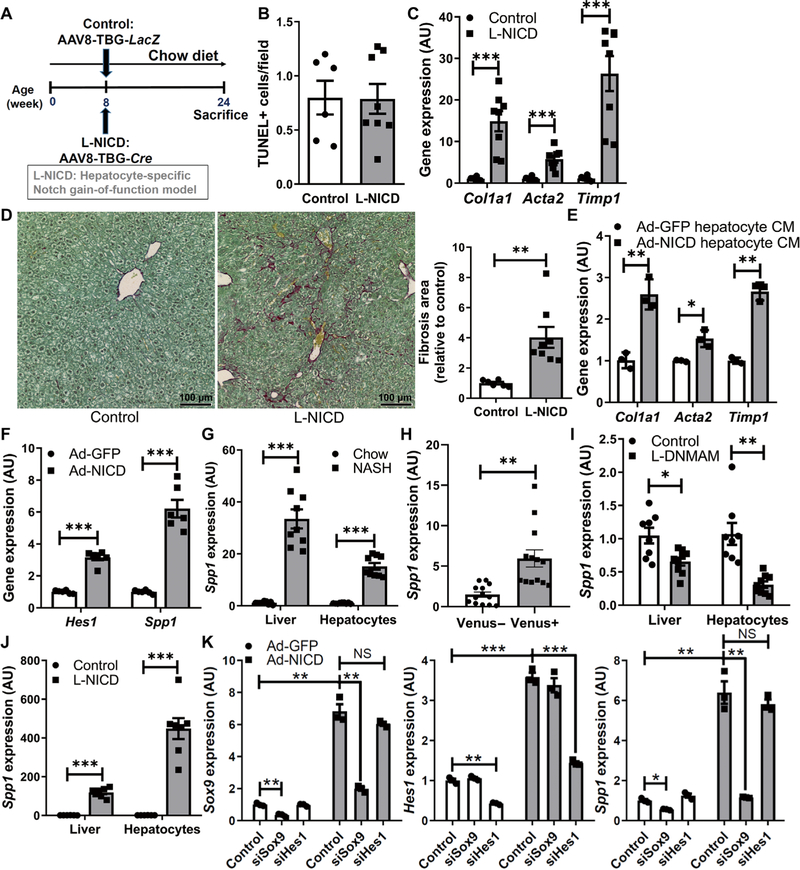
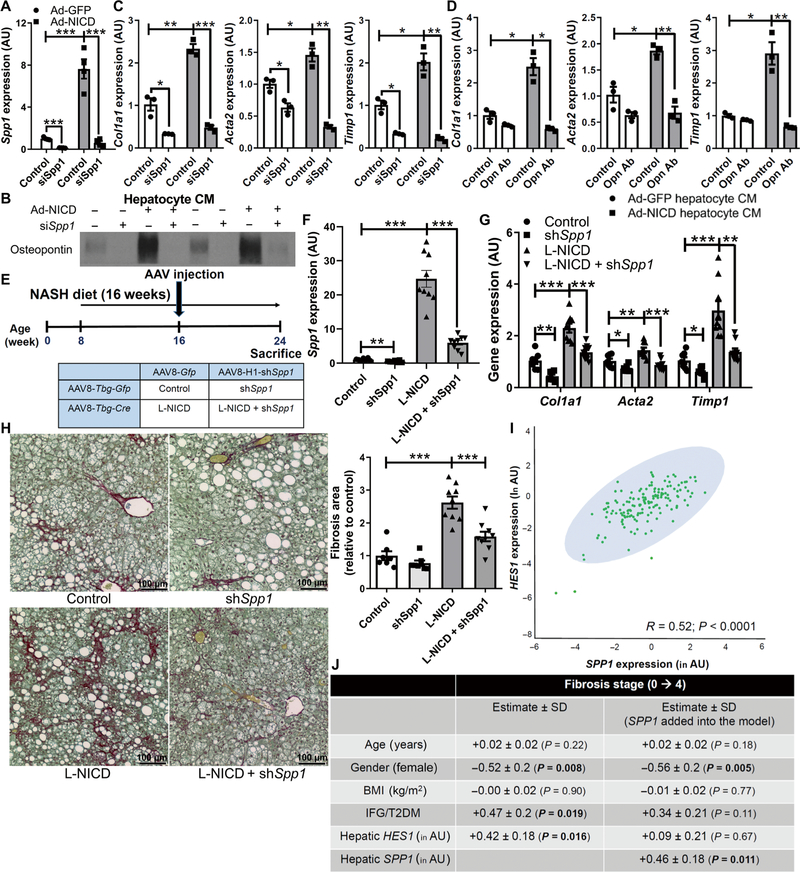
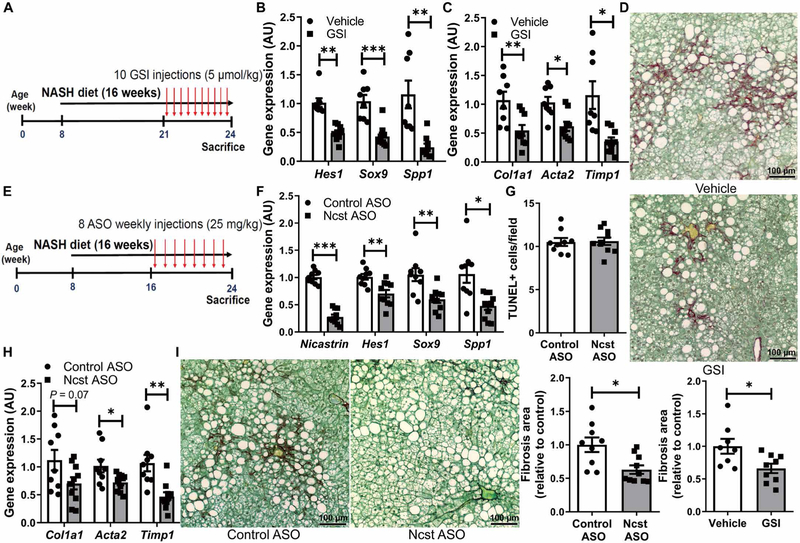
Fibrosis is the major determinant of morbidity and mortality in patients with nonalcoholic steatohepatitis (NASH) but has no approved pharmacotherapy in part because of incomplete understanding of its pathogenic mechanisms. Here, we report that hepatocyte Notch activity tracks with disease severity and treatment response in patients with NASH and is similarly increased in a mouse model of diet-induced NASH and liver fibrosis. Hepatocyte-specific Notch loss-of-function mouse models showed attenuated NASH-associated liver fibrosis, demonstrating causality to obesity-induced liver pathology. Conversely, forced activation of hepatocyte Notch induced fibrosis in both chow- and NASH diet-fed mice by increasing Sox9-dependent Osteopontin (Opn) expression and secretion from hepatocytes, which activate resident hepatic stellate cells. In a cross-sectional study, we found that OPN explains the positive correlation between liver Notch activity and fibrosis stage in patients. Further, we developed a Notch inhibitor [Nicastrin antisense oligonucleotide (Ncst ASO)] that reduced fibrosis in NASH diet-fed mice. In summary, these studies demonstrate the pathological role and therapeutic accessibility of the maladaptive hepatocyte Notch response in NASH-associated liver fibrosis.


Figures

Fig. 1.
Fig. 1.. Hepatocyte Notch activation in NASH.
(A) Representative images of HES1 (red) and hepatocyte nuclear factor 4α (HNF4α; green) immunofluorescence in liver biopsies from patients with histologically normal liver, SS, or NASH/fibrosis and quantification of the percentage of HES1+ cells among HNF4α+ hepatocytes and HNF4α nonhepatocytes (n = 3 to 4 per group). (B) Expression of Notch target genes HES1 and HEYL after 96 weeks of treatment in nonresponders (n = 49) or responders (n = 69) from the PIVENS trial. (C) Liver HES1 and (D) HEYL expression in paired baseline and 96-week end-of-treatment liver biopsy specimens from PIVENS subjects (n = 10 to 11 per group) and (E) percentage change of HES1+/HNF4α+ hepatocytes and HES1+/HNF4 NPCs in nonresponders (NR) and responders (R) from baseline to end of treatment (n = 7 per group). (F) Hes1 expression in liver, fractionated hepatocytes, and NPCs. (G) Representative images of Hes1 and HNF4α immunofluorescence in chow- and NASH diet–fed WT mouse livers and quantification of the percentage of hepatocytes with nuclear Hes1 staining (n = 9 per group). (H) Expression of Notch receptors in hepatocytes and (I) Western blots of Notch1 and Notch2 intracellular domains (ICDs) in livers from chow- and NASH diet–fed WT mice. (J) Quantification of Venus+ hepatocytes in livers from chow- and NASH diet–fed Notch reporter mice (n = 5 per group). *P < 0.05, **P < 0.01, and ***P < 0.001 as compared to the indicated controls by two-tailed t tests (two groups) or one-way analysis of variance (ANOVA), followed by post hoc t tests (three groups). All data are shown as the means ± SEM. NS, not significant; AU, arbitrary units.
Fig. 2.
Fig. 2.. Hepatocyte Notch blockade ameliorates NASH-associated fibrosis.
(A) RosaDNMAM mice (8 weeks old) were transduced with AAV8-TBG-LacZ (control) or AAV8-TBG-Cre to generate L-DNMAM mice and then fed for 16 weeks with NASH diet (n = 9 to 10 per group). (B) Hes1 expression and (C) representative images of Hes1 (red) and HFN4α (green) staining, (D) TUNEL (red) staining and quantification, (E) expression of fibrogenic genes, and (F) liver collagen staining and quantification in livers from Cre control and L-DNMAM mice. DAPI, 4′,6-diamidino-2-phenylindole. (G) RosaDNMAM mice (8 weeks old) were fed with NASH diet for 32 weeks with AAV8-TBG-LacZ or AAV8-TBG-Cre transduction in the 16th week (n = 9 per group). (H) Hes1 and (I) fibrogenic gene expression, and (J) collagen staining and quantification in livers from Cre controls and mice with delayed expression of DNMAM. *P < 0.05, **P < 0.01, and ***P < 0.001 as compared to the indicated controls by two-tailed t tests (two groups). All data are shown as the means ± SEM.
Fig. 3.
Fig. 3.. Hepatocyte Notch activation exacerbates NASH and fibrosis.
(A) RosaNICD mice (8 weeks old) were transduced with AAV8-TBG-LacZ (control) or AAV8-TBG-Cre to generate hepatocyte-specific Notch gain-of-function (L-NICD-16wks) mice before 16 weeks of NASH diet feeding or halfway through NASH diet feeding (L-NICD-8wks) (n = 9 to 11 per group). (B) Hes1 expression and (C) representative images of Hes1 (red) and HFN4α (green) staining, (D) expression of fibrogenic genes, (E) collagen staining and quantification, and (F) TUNEL (red) staining in livers from control and L-NICD mice. *P < 0.05, **P < 0.01, and ***P < 0.001 as compared to Cre control mice by one-way ANOVA, followed by post hoc t tests (three groups). All data are shown as the means ± SEM.
Fig. 4.
Fig. 4.. Hepatocyte Notch activation in chow-fed mice induces Sox9-dependent Spp1 expression and liver fibrosis.
(A) Male normal chow-fed RosaNICD mice (8 weeks old) were transduced with AAV8-TBG-LacZ (control) or AAV-TBG-Cre (L-NICD ) and maintained on normal chow diet for 16 more weeks (n = 6 to 8 per group). (B) Quantification of TUNEL staining, (C) fibrogenic gene expression, and (D) collagen staining and quantification in livers from control and L-NICD mice. (E) Fibrogenic gene expression in plated HSCs isolated form WT mice, exposed to control or Ad-NICD–transduced hepatocyte conditioned medium (CM; n = 3 per group). (F) Hes1 and Spp1 in control and Notch-activated primary hepatocytes (n = 6 per group). (G to J) Spp1 expression in (G) livers and isolated hepatocytes of NASH diet–fed mice (n = 9 per group), (H) hepatocytes sorted on the basis of Notch activity from Notch reporter mice (n = 13 per group), (I) livers and FACS-separated hepatocytes from NASH diet–fed L-DNMAM mice (n = 8 per group), and (J) NASH diet–fed L-NICD mice (n = 7 per group). (K) Spp1 expression in siSox9- or siHes1-transfected primary hepatocytes (n = 3 per group). *P < 0.05, **P < 0.01, and ***P < 0.001 as compared to the indicated controls by two-tailed t tests (two groups) or one-way ANOVA, followed by post hoc t tests (more than two groups). All data are shown as the means ± SEM.
Fig. 5.
Fig. 5.. Notch-induced hepatocyte Opn activates HSCs and induces liver fibrosis.
(A) Hepatocyte Spp1 expression (n = 4 per group) and (B) Opn secreted in hepatocyte CM from control or Notch-activated hepatocytes transfected with siRNA directed against Spp1 (siSpp1) or scrambled control. Expression of fibrogenic genes in HSCs exposed to CM (C) from control or Notch-activated siSpp1-transfected hepatocytes (n = 3 per group) or (D) CM pretreated with an Opn-neutralizing antibody (Opn Ab; n = 3 per group). (E) RosaNICD mice (8 weeks old) were fed with NASH diet for 8 weeks and then transduced with AAV8-TBG-Gfp or AAV8-TBG-Cre (to generate control and L-NICD mice, respectively) and simultaneously with AAV8-H1-Gfp or AAV8-H1-shSpp1 (n = 7 to 9 per group). (F) Spp1 and (G) fibrogenic gene expression and (H) collagen staining and quantification in livers from control and L-NICD mice transduced with shSpp1 (short hairpin–mediated RNA–transfected Spp1). *P < 0.05, **P < 0.01, and ***P < 0.001 as compared to the indicated controls by one-way ANOVA, followed by post hoc t tests (more than two groups). All data are shown as the means ± SEM. (I) Correlation between HES1 and SPP1 expression in liver biopsies from patients at risk of NASH (n = 159). (J) Table of association between HES1 expression and liver fibrosis stage after adjustment for key demographic variables (left column) or when additionally adjusted for SPP1 expression (right column). Expression of HES1 and SPP1 was log transformed to ensure the assumption of normal distribution. All data in the table are shown as the regression estimates ± SD and P values, which were generated by multivariate ordinal regression analyses. BMI, body mass index; IFG, impaired fasting glucose; T2DM, type 2 diabetes mellitus.
Fig. 6.
Fig. 6.. Pharmacologic Notch inhibitors ameliorate NASH diet–induced fibrosis.
(A) WT mice received vehicle or GSI (5μmol/kg of body weight) every other day for the last 3 weeks of NASH diet feeding (n = 8 to 9 per group). (B) Expression of Notch targets and (C) fibrogenic genes and (D) collagen staining and quantification in livers from vehicle or GSI-treated mice. (E) WT mice received weekly injections of control or Ncst ASO (25 mg/kg of body weight) for the last 8 weeks of NASH diet feeding (n = 9 to 10 per group). (F) Ncst and Notch target gene expression, (G) quantification of TUNEL staining, (H) expression of fibrogenic genes, and (I) collagen staining and quantification in livers from Control ASO– and Ncst ASO–treated mice. *P < 0.05, **P < 0.01, and ***P < 0.001 as compared to the indicated controls by two-tailed t tests (two groups). All data are shown as the means ± SEM.

References

    1. Hossain P, Kawar B, El Nahas M, Obesity and diabetes in the developing world—A growing challenge. N. Engl. J. Med 356, 213–215 (2007). - PubMed
    1. Lazo M, Clark JM, The epidemiology of nonalcoholic fatty liver disease: A global perspective. Semin. Liver Dis 28, 339–350 (2008). - PubMed
    1. Ogden CL, Carroll MD, Fryar CD, Flegal KM, Prevalence of obesity among adults and youth: United States, 2011–2014. NCHS data brief 28, 339–350 (2015). - PubMed
    1. Younossi ZM, Stepanova M, Afendy M, Fang Y, Younossi Y, Mir H, Srishord M, Changes in the prevalence of the most common causes of chronic liver diseases in the United States from 1988 to 2008. Clin. Gastroenterol. Hepatol 9, 524–530.e1 (2011). - PubMed
    1. Brunt EM, Pathology of nonalcoholic fatty liver disease. Nat. Rev. Gastroenterol. Hepatol 7, 195–203 (2010). - PubMed

Publication types