Long-term mechanical function and integration of an implanted tissue-engineered intervertebral disc
- PMID: 30463917
- PMCID: PMC7380504
- DOI: 10.1126/scitranslmed.aau0670
Long-term mechanical function and integration of an implanted tissue-engineered intervertebral disc
Abstract
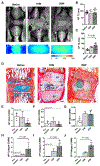
Tissue engineering holds great promise for the treatment of advanced intervertebral disc degeneration. However, assessment of in vivo integration and mechanical function of tissue-engineered disc replacements over the long term, in large animal models, will be necessary to advance clinical translation. To that end, we developed tissue-engineered, endplate-modified disc-like angle ply structures (eDAPS) sized for the rat caudal and goat cervical spines that recapitulate the hierarchical structure of the native disc. Here, we demonstrate functional maturation and integration of these eDAPS in a rat caudal disc replacement model, with compressive mechanical properties reaching native values after 20 weeks in vivo and evidence of functional integration under physiological loads. To further this therapy toward clinical translation, we implanted eDAPS sized for the human cervical disc space in a goat cervical disc replacement model. Our results demonstrate maintenance of eDAPS composition and structure up to 8 weeks in vivo in the goat cervical disc space and maturation of compressive mechanical properties to match native levels. These results demonstrate the translational feasibility of disc replacement with a tissue-engineered construct for the treatment of advanced disc degeneration.
Copyright © 2018 The Authors, some rights reserved; exclusive licensee American Association for the Advancement of Science. No claim to original U.S. Government Works.
Conflict of interest statement
Figures


Comment in
-
Moving towards tissue-engineered disc replacement.Nat Rev Rheumatol. 2019 Feb;15(2):66. doi: 10.1038/s41584-019-0159-0. Nat Rev Rheumatol. 2019. PMID: 30622296 No abstract available.
Similar articles
-
Restoration of physiologic loading after engineered disc implantation mitigates immobilization-induced facet joint and paraspinal muscle degeneration.Acta Biomater. 2025 Jan 15;192:128-139. doi: 10.1016/j.actbio.2024.12.014. Epub 2024 Dec 9. Acta Biomater. 2025. PMID: 39653318
-
Sacrificial Fibers Improve Matrix Distribution and Micromechanical Properties in a Tissue-Engineered Intervertebral Disc.Acta Biomater. 2020 Jul 15;111:232-241. doi: 10.1016/j.actbio.2020.05.019. Epub 2020 May 22. Acta Biomater. 2020. PMID: 32447064
-
In Vitro Maturation and In Vivo Integration and Function of an Engineered Cell-Seeded Disc-like Angle Ply Structure (DAPS) for Total Disc Arthroplasty.Sci Rep. 2017 Nov 17;7(1):15765. doi: 10.1038/s41598-017-15887-4. Sci Rep. 2017. PMID: 29150639 Free PMC article.
-
Mechanical design criteria for intervertebral disc tissue engineering.J Biomech. 2010 Apr 19;43(6):1017-30. doi: 10.1016/j.jbiomech.2009.12.001. Epub 2010 Jan 18. J Biomech. 2010. PMID: 20080239 Free PMC article. Review.
-
Role of biomechanics in intervertebral disc degeneration and regenerative therapies: what needs repairing in the disc and what are promising biomaterials for its repair?Spine J. 2013 Mar;13(3):243-62. doi: 10.1016/j.spinee.2012.12.002. Epub 2013 Jan 29. Spine J. 2013. PMID: 23369494 Free PMC article. Review.
Cited by
-
Optimization of a rat lumbar IVD degeneration model for low back pain.JOR Spine. 2020 Jun 22;3(2):e1092. doi: 10.1002/jsp2.1092. eCollection 2020 Jun. JOR Spine. 2020. PMID: 32613167 Free PMC article.
-
A Tunable Calcium Phosphate Coating to Drive in vivo Osseointegration of Composite Engineered Tissues.Cells Tissues Organs. 2023;212(5):383-398. doi: 10.1159/000528965. Epub 2023 Mar 24. Cells Tissues Organs. 2023. PMID: 36966531 Free PMC article.
-
Electrospinning and 3D bioprinting for intervertebral disc tissue engineering.JOR Spine. 2020 Aug 6;3(4):e1117. doi: 10.1002/jsp2.1117. eCollection 2020 Dec. JOR Spine. 2020. PMID: 33392454 Free PMC article. Review.
-
Biomimetic Microchannel Integrated Silk Fibroin Scaffold for Regeneration of Intervertebral Disc Degeneration.Biomater Res. 2025 May 28;29:0203. doi: 10.34133/bmr.0203. eCollection 2025. Biomater Res. 2025. PMID: 40438125 Free PMC article.
-
Injectable Radiopaque Hyaluronic Acid Granular Hydrogels for Intervertebral Disc Repair.Adv Healthc Mater. 2024 Oct;13(25):e2303326. doi: 10.1002/adhm.202303326. Epub 2023 Dec 31. Adv Healthc Mater. 2024. PMID: 38142300
References
-
- Deyo RA, Mirza SK, Martin BI, Back pain prevalence and visit rates: Estimates from U.S. national surveys, 2002, Spine (Phila. Pa. 1976). 31, 2724–2727 (2006). - PubMed
-
- Murray CJL, Vos T, Lozano R, Disability-adjusted life years (DALYs) for 291 diseases and injuries in 21 regions, 1990-2010: a systematic analysis for the Global Burden of Disease Study 2010., Lancet 380, 2197–223 (2012). - PubMed
-
- Martin B, DEYO RA, Mirza S, Turner J, Comstock B, Hollingworth W, Sullivan S, Expenditures and health status among adults with back and neck problems, JAMA 299, 656–664 (2008). - PubMed
-
- American Academy of Orthopaedic Surgeons and the United States Bone and Joint Decade, The Burden of Musculoskeletal Diseases in the United States (American Academy of Orthopaedic Surgeons, Rosemont, IL, 2008).
Publication types
MeSH terms
Grants and funding
LinkOut - more resources
Full Text Sources
Other Literature Sources

