. 2019 Jan 18;294(3):887-901.
doi: 10.1074/jbc.RA118.004143. Epub 2018 Nov 21.

Inhibition of ezrin causes PKCα-mediated internalization of erbb2/HER2 tyrosine kinase in breast cancer cells

Affiliations

Inhibition of ezrin causes PKCα-mediated internalization of erbb2/HER2 tyrosine kinase in breast cancer cells

Jaekwang Jeong et al. J Biol Chem. .

Abstract

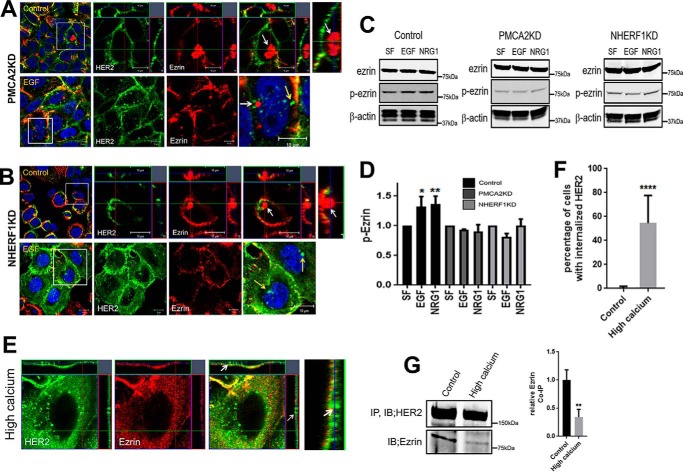
Unlike other ErbB family members, HER2 levels are maintained on the cell surface when the receptor is activated, allowing prolonged signaling and contributing to its transforming ability. Interactions between HER2, HSP90, PMCA2, and NHERF1 within specialized plasma membrane domains contribute to the membrane retention of HER2. We hypothesized that the scaffolding protein ezrin, which has been shown to interact with NHERF1, might also help stabilize the HER2-PMCA2-NHERF1 complex at the plasma membrane. Therefore, we examined ezrin expression and its relationship with HER2, NHERF1, and PMCA2 levels in murine and human breast cancers. We also used genetic knockdown and/or pharmacologic inhibition of ezrin, HSP90, NHERF1, PMCA2, and HER2 to examine the functional relationships between these factors and membrane retention of HER2. We found ezrin to be expressed at low levels at the apical surface of normal mammary epithelial cells, but its expression is up-regulated and correlates with HER2 expression in hyperplasia and tumors in murine mammary tumor virus-Neu mice, in human HER2-positive breast cancer cell lines, and in ductal carcinoma in situ and invasive breast cancers from human patients. In breast cancer cells, ezrin co-localizes and interacts with HER2, NHERF1, PMCA2, and HSP90 in specialized membrane domains, and inhibiting ezrin disrupts interactions between HER2, PMCA2, NHERF1, and HSP90, inhibiting HER2 signaling and causing PKCα-mediated internalization and degradation of HER2. Inhibition of ezrin synergizes with lapatinib in a PKCα-dependent fashion to inhibit proliferation and promote apoptosis in HER2-positive breast cancer cells. We conclude that ezrin stabilizes a multiprotein complex that maintains active HER2 at the cell surface.

Keywords: ErbB2/HER2; NHERF1; PDZ domain; PMCA2; breast cancer; ezrin; heat shock protein 90 (Hsp90); protein kinase C (PKC); scaffold protein.


Conflict of interest statement

The authors declare that they have no conflicts of interest with the contents of this article. The content is solely the responsibility of the authors and does not necessarily represent the official views of the National Institutes of Health

Figures

Figure 1.
Figure 1.
A, mutual exclusivity analysis of ERBB2 (HER2), EZR (Ezrin), and SLC9A3R1 (NHERF1) mRNA expression from the METRABRIC breast cancer database. B–D, correlations between ezrin (y axis) and HER2 (x axis) (B), NHERF1(y axis) and HER2 (x axis) (C), and ezrin (y axis) and NHERF1(x axis) mRNA levels in individual tumors from the METABRIC breast cancer database. E, Ezrin mRNA expression in breast cancer cell lines, as assessed by quantitative PCR. Error bars represent mean ± S.E. for three experiments. ***, p < 0.0005; ****, p < 0.00005. F, typical immunofluorescence staining for HER2 (green) and Ezrin (red) in normal murine virgin mammary ducts (top row), hyperplastic lesions from MMTV-Neu mice (center row), and mammary tumors from MMTV-Neu mice (bottom row). Right panels, merged images with DAPI staining (blue). Yellow arrows, apical plasma membrane; white arrows, basolateral membrane. G, representative HER2 (green) and Ezrin (red) immunofluorescence staining in human HER2-negative (top row) or HER2-positive (bottom row) DCIS lesions. Right panels, merged images with DAPI staining. Yellow arrow, apical plasma membrane; white arrow, basolateral membrane. Scale bars = 10 μm.
Figure 2.
Figure 2.
A, immunofluorescence staining for NHERF1 and Ezrin (top row), HER2 and Ezrin (center row), and phalloidin (actin) and Ezrin (bottom row) in SKBR3 cells. Right panels, merged staining to highlight co-localization (yellow). For all panels, insets on top and on the right of enlarged images represent Z stacks in two different orientations: the apical side of the cell facing down in the top inset and to the left in the side inset. Far right panels, enlargements of Z stack reconstructions. White arrows point to co-localizations in membrane protrusions. B, immunofluorescence staining of HER2 and phospho-Ezrin in SKBR3 cells. White arrows point to co-localization in membrane protrusions. Enlarged Z stacks at the far right show magnification of co-staining in apical membrane protrusions. C, co-immunofluorescence staining for Ezrin (top row) and HER2 (bottom row) in SKBR3 cells expressing PH-PLCδ-GFP. White arrows point to co-localization in apical membrane protrusions. Enlarged Z stacks at the far right show magnification of co-staining in apical membrane protrusions. D, immunofluorescence staining for HER2 and ezrin in SKBR3 cells in serum-free medium (top row) and after 2 h of treatment with EGF (center row) or NRG1 (bottom row). Right panels, merged images for co-localization. Enlarged Z stacks at the far right show magnification of co-staining in apical membrane protrusions. E, immunofluorescence staining for ezrin and EGFR (top row) or ezrin and HER3 (bottom row) in SKBR3 cells at baseline in serum-containing medium. Right panels, merged images for co-localization. Enlarged Z stacks at the far right show co-localization in protruding structures on apical surfaces of cells. F, immunofluorescence staining for Ezrin and EGFR (top row) or Ezrin and HER3 (bottom row) in SKBR3 cells treated with EGF or NRG1 for 2 h. Right panels, merged images for co-localization. Enlarged Z stacks at the far right show internalization of EGFR or HER3 into cells (white arrows). G, co-immunoprecipitation for HER2 and ezrin in SKBR3 cells. H, quantitation of PLA assays using antibodies for HER2 and NHERF1 or HER2 and Ezrin in control SKBR3 cells or in SKBR3 cells treated with EGF for 10 min. n = 8 for HER2 and NHERF1 in control cells, n = 7 for all other conditions. I, Western blot analysis of Ezrin, HER2, and phospho-HER2 in control and EzrinKD SKBR3 cells. Bar graphs represent quantitation of three separate experiments. J, Western blot analysis of HER2 and phospho-HER2 in control and NSC668394-treated SKBR3 and BT474 cells. Bar graphs represent quantitation of three separate experiments. K, the bar graph represents percentages of cells that form membrane protrusions in control (125 cells assessed) EzrinKD (97 cells assessed), and NSC668394-treated (99 cells assessed) SKBR3 cells. L, immunofluorescence staining of EzrinKD SKBR3 (left panel) cells and control SKBR3 cells treated with NSC668394 (right panel). Cells were stained for HER2 and phalloidin (top row), HER2 and Ezrin (center row), or HER2 and NHERF1 (bottom row). Enlarged Z stacks at the far right show internalization of HER2 within the cells (white arrows). M, the bar graph represents percentages of cells with internalized HER2 in control (219 cells assessed), EzrinKD (68 cells assessed), and NSC668394-treated (104 cells assessed) SKBR3 cells. N, immunofluorescence staining for HER2 and EGFR (top row) or HER2 and HER3 (bottom row) in EzrinKD SKBR3 cells. Right panel, magnification of the boxed area in the third panel in each row. White arrows indicate co-localization of internalized HER2 with EGFR (top row) or HER3 (bottom row). Error bars represent mean ± S.E. for three experiments unless otherwise indicated. **, p < 0.005; ***, p < 0.0005; ****, p < 0.00005. Scale bars = 10 μm.
Figure 3.
Figure 3.
A, immunofluorescence staining for HER2 and Ezrin in PMCA2KD SKBR3 cells at baseline (top row) and after acute treatment with EGF for 2 h (bottom row). The three right panels are magnifications of the boxed areas in the left panel. Insets on top and on the right represent Z stacks in two different orientations, and the rightmost panel on top represents a magnified view of the Z stack. White arrows indicate internalized Ezrin, and yellow arrows indicate internalized HER2. B, immunofluorescence staining for HER2 and Ezrin in NHERF1KD SKBR3 cells at baseline (top row) and after acute treatment with EGF for 2 h (bottom row). Right panel, magnification of the boxed area in the third panel in each row. Insets on top and on the right represent Z stacks in two different orientations, and the rightmost panel on top represents a magnified view of the Z stack. White arrows indicate internalized Ezrin, and yellow arrows indicate internalized HER2. C, typical immunoblots for ezrin and phospho-ezrin in control, PMCA2KD, and NHERF1KD cells in serum-free medium (SF) at baseline and after 2-h treatment with EGF or NRG1. D, quantitation of increases in ezrin phosphorylation in response to treatment with either EGF or NRG1 in control, PMCA2KD, and NHERF1KD SKBR3 cells. E, immunofluorescence staining for HER2 and Ezrin in SKBR3 cells treated with 10 mm calcium and ionomycin for 16 h. Far right panel, magnification of the Z stack with the apical surface oriented to the left. White arrows indicate internalized HER2. F, the bar graph represents the percentage of cells with internalized HER2. G, co-immunoprecipitation of HER2 and Ezrin in SKBR3 cells at baseline or after treatment with 10 mm calcium and ionomycin. The bar graph represents the relative levels of ezrin in IP for HER2 (corrected for total HER2). In all graphs, error bars represent mean ± S.E. for three experiments. *, p < 0.05; **, p < 0.005; ****, p < 0.00005. Scale bars = 10 μm.
Figure 4.
Figure 4.
A, co-immunoprecipitation of HER2 and Ezrin from control and PMA-treated or bryostatin 1–treated SKBR3 cells. Bar graphs represent the relative levels of ezrin in IP for HER2 (corrected for total HER2). B, immunoblot analysis of HER2 and phospho-HER2 levels in SKBR3 cells at baseline or after treatment with PMA or bryostatin 1. Bar graphs indicate the relative levels of pHER2. C, immunoblot analysis of Ezrin and phospho-Ezrin levels in SKBR3 cells at baseline or after treatment with PMA or bryostatin 1. Bar graphs indicate the relative levels of phospho-ezrin. D, immunofluorescence staining for HER2 and Ezrin in SKBR3 cells incubated with PMA (top row) and bryostatin 1 (bottom row). The three right panels represent a magnification of the boxed area in the left panel. Insets on top and on the right represent Z stacks in two different orientations. Far right panels, magnified Z stacks. White arrows indicate internalized Ezrin, and yellow arrows represent internalized HER2. E, immunofluorescence staining for HER2 and NHERF1 in SKBR3 cells incubated with PMA (top row) and bryostatin 1 (bottom row). The three right panels represent a magnification of the boxed area in the left panel. Far right panels, magnified Z stacks. White arrows indicate internalized Ezrin, and yellow arrows represent internalized HER2. F, immunofluorescence staining of NHERF1 and Ezrin in SKBR3 cells incubated with PMA (top row) and bryostatin 1 (bottom row). The three right panels represent a magnification of the boxed area in the left panel. Far right panels, magnified Z stacks. White arrows indicate internalized and co-localized NHERF1 and Ezrin. G, percentage of cells forming membrane protrusions in SKBR3 cells at baseline or after treatment with PMA or bryostatin 1. H, percentage of cells with internalized HER2 in SKBR3 cells at baseline or after treatment with PMA or bryostatin 1. I, percentage of cells forming membrane protrusions in control SKBR3 cells and in SKBR3 cells expressing either WT-PKCα or CA-PKCα. J, immunofluorescence staining of HER2 (top row), ezrin (center row), and NHERF1 (bottom row) in SKBR3 cells expressing HA-tagged WT-PKCα. The three right panels represent a magnification of the boxed area in the left panel. Far right panels, magnified Z stacks. White arrows indicate co-localization of HER2, NHERF1, or Ezrin with WT-PKCα in membrane protrusions. K, immunofluorescence staining of HER2 (top row), Ezrin (center row), and NHERF1 (bottom row) in SKBR3 cells expressing HA-tagged CA-PKCα. The three right panels represent a magnification of the boxed area in the left panel. Far right panels, magnified Z stacks. White arrows indicate co-localization of internalized HER2, NHERF1, or Ezrin with CA-PKCα. L, immunofluorescence staining of HER2 in SKBR3 cells expressing WT-PKCα at baseline (top row), and after treatment with PMA (center row) or 10 mm calcium and ionomycin (bottom row). The three right panels represent a magnification of the boxed area in the left panel. Far right panels, magnified Z stacks. White arrows indicate co-localization of HER2 and PKCα in membrane protrusions (top row) or internalized into the cell (center and bottom rows). M, immunofluorescence staining of Ezrin in SKBR3 cells expressing WT-PKCα at baseline (top row) and after treatment with PMA (center row) or 10 mm calcium and ionomycin (bottom row). The three right panels represent a magnification of the boxed area in the left panel. Far right panels, magnified Z stacks. White arrows indicate co-localization of Ezrin and PKCα in membrane protrusions (top row) or internalized into the cell (center and bottom rows). Error bars represent mean ± S.E. for three experiments. **, p < 0.005; ***, p < 0.0005; ****, p < 0.00005. Scale bars = 10 μm.
Figure 5.
Figure 5.
A, immunofluorescence staining for HER2 and HA-tagged WT-PKCα in SKBR3 cells treated with NSC668394. The top right panels and bottom row represent a magnification of the boxed area in the top left panel. Insets on top and on the right represent Z stacks in two different orientations. White arrows indicate co-localization of internalized HER2 and PKCα. B, immunoblot analysis of HER2 and phospho-HER2 levels in lysates from SKBR3 cells at baseline and after treatment with PMA alone or a combination of PMA plus Go6974. C, percentage of SKBR3 cells forming membrane protrusions at baseline or after treatment with NSC668394 alone or a combination of NSC668394 and Go6974. D, immunofluorescence staining for HER2 in control SKBR3 cells (left column), SKBR3 cells treated with NSC668394 (center column), and SKBR3 cells treated with a combination of NSC668394 and Go6974 (right column). Bottom row, magnification of the boxed areas in the top row. Insets on top and on the right represent Z stacks in two different orientations. White arrows indicate HER2 at cell surface protrusions. The yellow arrow indicates internalized HER2. E, percentage of cells with internalized HER2. F, co-immunoprecipitation of HER2 and Ezrin from control SKBR3 cells and from SKBR3 cells treated with NSC668394 alone or a combination of NSC668394 and Go6974. The bar graph represents the relative levels ezrin in IP for HER2 (corrected for total HER2). Error bars represent mean ± S.E. for three experiments. ****, p < 0.00005. Scale bars = 10 μm.
Figure 6.
Figure 6.
A, immunofluorescence staining of HER2 and HSP90 in control (top row), EzrinKD (center row), and NSC668394-treated SKBR3 cells (bottom row). The three right panels represent a magnification of the boxed area in the left panel. Insets on top and on the right represent Z stacks in two different orientations. Far right panels, magnified z-stacks. White arrows indicate co-localization of HER2 and HSP90 in membrane protrusions in the top row and internalized HER2 in the center and bottom rows. B, co-immunoprecipitation of HER2 and HSP90 from control and EzrinKD SKBR3 cells (top) and from control and NSC668394-treated SKBR3 cells (bottom). The bar graph represents the relative levels ezrin in IP for HER2 (corrected for total HER2). C, immunofluorescence staining of HER2 and ezrin (top row), HER2 and NHERF1 (center row), and NHERF1 and ezrin (bottom row) in HSP90KD SKBR3 cells. Right panel, magnification of the boxed region in third panel in each row. The white arrow indicates co-localization of internalized NHERF1 and Ezrin in the cytoplasm. D, immunoblot analysis of ezrin and phospho-ezrin in control and HSP90KD SKBR3 cells. E, co-immunoprecipitation of HER2 and ezrin from control and HSP90KD SKBR3 cells. The bar graph represents the relative levels of ezrin in IP for HER2 (corrected for total HER2). F, immunofluorescence staining of HER2 and Ezrin (top row), HER2 and NHERF1 (center row), and NHERF1 and Ezrin (bottom row) in geldanamycin-treated SKBR3 cells. The three right panels represent a magnification of the boxed area in the left panel. Far right panels, magnified z-stacks. White arrows indicate internalized HER2 in the top and center rows and co-localization of internalized NHERF1 and Ezrin in the bottom row. G, percentage of cells forming membrane protrusions in control and geldanamycin-treated SKBR3 cells. H, percentage of cells with internalized HER2. I, co-immunoprecipitation of HER2 and ezrin from control and geldanamycin-treated SKBR3 cells. The bar graph represents the relative levels of ezrin in IP for HER2 (corrected for total HER2). Error bars represent mean ± S.E. for three experiments. **, p < 0.005; ***, p < 0.0005; ****, p < 0.00005. Scale bars = 10 μm.
Figure 7.
Figure 7.
A, BrdU incorporation in SKBR3 cells and BT474 cells at baseline and treated with NSC668394 alone or with a combination of NSC668394 and Go6974. B, measurement of apoptosis in SKBR3 cells and BT474 cells at baseline and treated with NSC668394 alone or with a combination of NSC668394 and Go6974. C, BrdU incorporation in SKBR3 cells and BT474 cells at baseline and treated with PMA alone or with a combination of PMA and Go6974. D, measurement of apoptosis in SKBR3 cells and BT474 cells at baseline and treated with PMA alone or with a combination of PMA and Go6974. E, relative reductions in BrdU incorporation in SKBR3 cells or BT474 cells treated with lapatinib alone or with lapatinib and NSC668394 with or without Go6976. F, relative increases in apoptosis in SKBR3 cells or BT474 cells treated with lapatinib alone or with lapatinib and NSC668394 with or without Go6976. Error bars represent mean ± S.E. for three experiments. *, p < 0.05; **, p < 0.005; ***, p < 0.0005; ****, p < 0.00005.
Figure 8.
Figure 8.
A, working model for a membrane- and actin-tethered multiprotein signaling complex containing ezrin, NHERF1, PMCA2, HSP90, and heterodimers of HER2/EGFR or HER2/HER3 in lipid raft–rich membrane protrusions. B, PKCα-mediated disruption of interactions between NHERF1 and PMCA2 causes disassembly of the signaling complex, effacement of membrane protrusions, and internalization of ezrin–NHERF1 and PMCA2–HER2–EGFR–HER3 complexes.

Similar articles

Cited by

References

    1. U.S. Cancer Statistics Working Group (2017) United States Cancer Statistics: 1999–2014. Incidence and Mortality Web-based Report. U.S. Department of Health and Human Services, Centers for Disease Control and Prevention and National Cancer Institute, Atlanta, GA
    1. Arteaga C. L., Sliwkowski M. X., Osborne C. K., Perez E. A., Puglisi F., and Gianni L. (2011) Treatment of HER2-positive breast cancer: current status and future perspectives. Nat. Rev. Clin. Oncol. 9, 16–32 10.1074/jbc.RA117.001068 - DOI - PubMed
    1. Ursini-Siegel J., Schade B., Cardiff R. D., and Muller W. J. (2007) Insights from transgenic mouse models of ERBB2-induced breast cancer. Nat. Rev. Cancer 7, 389–397 10.1074/jbc.RA117.001068 - DOI - PubMed
    1. Arteaga C. L., and Engelman J. A. (2014) ERBB receptors: from oncogene discovery to basic science to mechanism-based cancer therapeutics. Cancer Cell 25, 282–303 10.1074/jbc.RA117.001068 - DOI - PMC - PubMed
    1. Hynes N. E., and MacDonald G. (2009) ErbB receptors and signaling pathways in cancer. Curr. Opin. Cell Biol. 21, 177–184 10.1074/jbc.RA117.001068 - DOI - PubMed

Publication types

MeSH terms